TABLE OF CONTENTS
Page number LIST OF FIGURES AND TABLES...1
ABSTRACT...2
CHAPTER
I. Introduction...4
II. Mutagenicity of butadiene and its epoxide metabolites in cultured human
lymphoblasts and in splenic T-cells isolated from exposed B6C3F1 mice...15
III. Mutational spectrum of 1,3-butadiene and its epoxide metabolites at the hprt
locus in cultured human lymphoblasts and in splenic T-cells of exposed
B6C3F1 mice...,...'...25
LIST OF FIGURES AND TABLES
Figure 1.1: Metabolism of 1,3-Butadiene
Figure 1.2: DNA Adducts in B6C3F1 mice after 1,3-Butadiene exposure
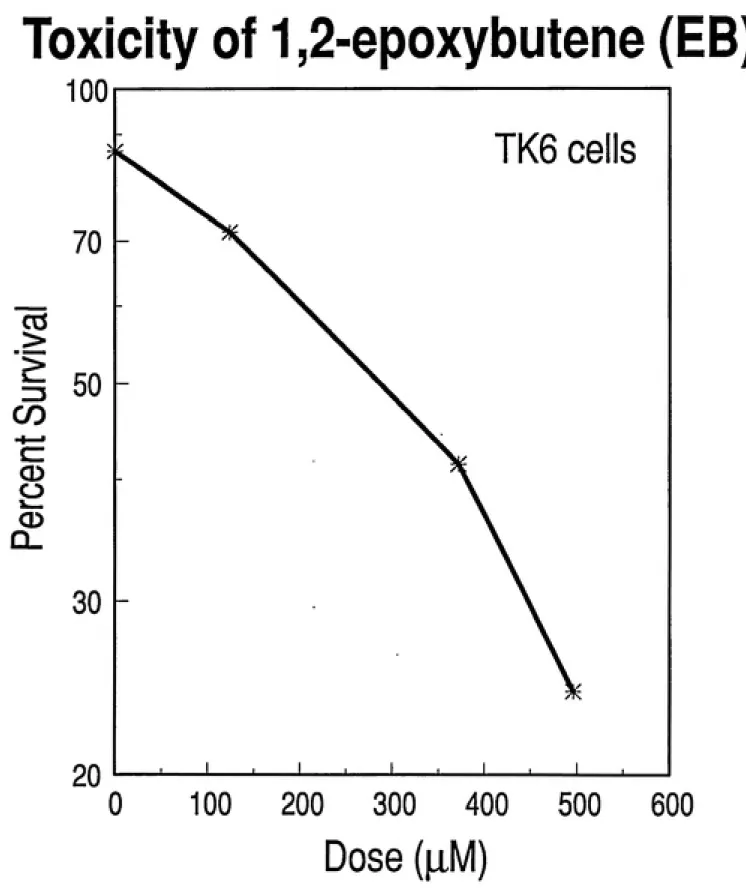
Figure 2.1: Toxicity of 1,2-Epoxybutene (EB) in TK6 cells Figure 2.2: Toxicity of Diepoxybutane (DEB) in TK6 cells
Figure 2.3: Toxicity of 3,4-Epoxy-1,2-butanediol (EBD) in TK6 cells
Figure 2.4: Comparison of Toxicities of Butadiene Metabolites in TK6 cells
Figure 2.5: Mutagenicity of EB in TK6 cells Figure 2.6: Mutagenicity of DEB in TK6 cells Figure 2.7: Mutagenicity of EBD in TK6 cells
Figure 2.8: Comparison of Mutagenicities of Butadiene Metabolites at hprt locus
Figure 2.9: Comparison of Mutagenicities of Butadiene Metabolites at tk locus Figure 2.10: Comparison of Induction of Slow-Growth Mutants by Metabolites Figure 2.11: Mutation Frequency Induced by 1,3-Butadiene in B6C3F1 MiceFigure 2.12: Mutation Frequency Induced by EB in B6C3F1 Mice
Figure 2.13: Mutation Frequency Induced by DEB in B6C3F1 Mice
Figure 3.1: Sample Southern Blot Autoradiograph
Table 3.2: Southern Blot Analysis of EB- and DEB-lnduced Mutant TK6 cells
Table 3.3: Mutational Spectrum of EB in TK6 cells
ABSTRACT
The objective of this research was to examine the mutagenic potential of butadiene and its epoxide metabolites in a human lymphoblastoid cell line (TK6) and in splenic T-cells isolated from exposed B6C3F1 mice. TK6 cells were exposed for 24
hours to 1,2-epoxybutene (EB), 3,4-epoxy-1,2-butanediol (EBD), or diepoxybutane
(DEB) and then plated to determine the toxicity of treatment and to measure mutation
frequency at the hypoxanthine-guanine phosphoribosyl transferase {hprf) and
thymidine kinase {tk) loci (Liber and Thilly, 1982). Treatments with 2.6 \xM DEB, 400 jxM EB, and 800 |xM EBD resulted in 37% culture survival. At the hprt locus, an
induced mutation frequency of 5 x 10"® was produced by 3.5 |iM DEB, 150 /vM EB,
and 450 }iM EBD; at the tk locus, an induced mutation frequency of 5 x 10® (normal
growth mutants) was produced by 2.6 |iM DEB, 250 |iM EB, and 450 |xM EBD. EB, EBD, and DEB also induced slow-growth tk mutants at approximately the samefrequency as normal-growth tk mutants. Thus, all three metabolites of butadiene were
mutagenic at both the hprt and tk loci, with DEB exhibiting mutagenic activity at
concentrations approximately two orders of magnitude lower than EB or EBD. The method of Southern blot was used to investigate the occurrence of
deletions induced in vitro at the liprt gene of human lymphoblastoid cells (TK6) after exposure to 1,2-epoxybutene (EB) and diepoxybutane (DEB). Thirty-five EB-induced mutants and 39 DEB mutants were analyzed by the method of Southern blot. Fifty-four percent (54%) of DEB-induced mutants showed altered banding patterns, compared to
11.4% for EB mutants.
The mutagenic response at the tiprt locus in splenic T-cells of exposed B6C3F1 mice (Skopek et al, 1992) was also studied. Twelve-day-old male mice were exposed to ambient air (controls) or 625 ppm butadiene for 2 weeks (6 hr/day, 5 days/week). Mice were sacrificed two weeks after the end of exposure. Hprt mutation frequencies
^0^). In another experiment, preweanling mice were exposed to 3 doses, every other
day, of 60, 80, and 100 mg/kg EB via Intraperitoneal injection. Animals were sacrificedtwo weeks later. Average hprt mutation frequencies of 5 x 10'^ (range 1-9 x 10"®; 7
mice), 4x10"® (range 3-6 x 10"®; 6 mice) and 8x10"® (range 4-15 x 10"®; 6 mice) were
seen in these groups, respectively, compared to 1 x 10"® (range 0.1-4 x 10"®; 7 mice) in
controls. Twelve-day-old mice were also exposed to i.p. doses of DEB every other day, totalling 21, 28 and 42 mg/kg, with sacrifice two weeks later. Average hprtmutation frequencies observed in these groups were 5x10"® (range 2-8 x 10"®; 3
mice), 9x10"® (range 6-14 x 10"®; 4 mice) and 12 x 10"® (range 5-22 x 10"®; 4 mice)
respectively, compared to 1 x 10"® (range 0.6-2 x 10"®; 4 mice) among control animals.
Thus, butadiene and its epoxide metabolites, EB and DEB, are mutagenic in vivo at
the fiprt locus in splenic T-cells of mice.
By the technique of denaturing gradient gel electrophoresis, we have also
investigated the mutational spectrum induced in exon 3 of tiprt in splenic T-cells of male B6C3F1 mice after inhalation exposure to 1,3-butadiene or intraperitoneal
administration of 1,2-epoxybutene or diepoxybutane. Thirteen of the 77 mutants
(17%) from 1,3-butadiene exposed animals contained mutations in exon 3. Twenty-six of the 276 mutants (9.4%) from animals exposed to EB contained
mutations in exon 3 . Treatment of mice with diepoxybutane (DEB) resulted in 11 of
205 mutants ( 5.4%) analyzed which contained mutations in exon 3. Mutant DNA was
PCR amplified and purified from contaminating wild-type DNA through a series of denaturing gradient gels and then sequenced by an automated DNA sequencer.
CHAPTER I
1,3-Butadlene (C4H6, CAS 106-99-0) is a colorless gas with a mildly aromatic, gasoline-like odor. Butadiene has been produced commercially since the 1930's as a
monomer that is used in the production of rubber and plastics, with approximately 75%
going into the production of synthetic mbbers (Chem. Engin. News, 1986). In 1985,
1,3-butadiene was the 36th highest volume chemical produced in the U. S. (Sax and Lewis, 1987). Domestic production of rubber grade 1,3-butadiene in 1988 was
approximately 3.2 billion pounds. 1,3-Butadiene is identified as one of the 189
hazardous air pollutants in the 1990 Clean Air Act amendments (EPA, 1991).
1,3-Butadiene may be released to the environment as an intentional or fugitive emission during its production, use, storage, transport or disposal. According to the
SARA Section 313 Toxic Release Inventory, 9.2 million pounds of this volatile hydrocarbon were released to the atmosphere from manufacturing and processing facilities in the United States during 1987 (TRI, 1989). Low levels of 1,3-butadiene are constantly emitted to the atmosphere from many sources including exhaust from motor
vehicle engines using petroleum-based fuels (Stump and Dropkin, 1985). Several
minor sources for the release of 1,3-butadiene to the atmosphere involve the thermal
breakdown of other materials. For example, 1,3-butadiene has been detected as a component of sidestream cigarette smoke (Bartle et al, 1969; Blomberg and Widmark,
1975) and the burning of plastics or rubber (Miller, 1978). 1,3-Butadiene has also been measured as a component of smoke from a brush fire (Stephens and Burleson, 1969) and as a stack emission from waste incinerators (Junk and Ford, 1980). The concentrations of 1,3-butadiene were not presented in these studies.
1,3-Butadiene is almost always present in the air at low levels due to its emission from motor vehicles. Therefore, the general population is probably routinely exposed to ppb levels of the compound, although adverse health effects have not
Safety and Health estimates that between 5300 and 8200 workers are exposed to 1,3-butadiene in facilities which produce 1,3-butadiene, or process the monomer into polymers (NIOSH, 1985). Occupational exposure to 1,3-butadiene is generally less than 20 ppm. However, a recent industrial hygiene survey found that exposures in certain jobs were as high as 375 ppm (Fajen, 1990). Levels of 1,3-butadiene in the workplace are controlled by the Occupational Safety and Health Administration
(OSHA). The previous exposure limit was 1000 ppm averaged over an 8 hour workday in a 40 hour workweek. However, the National Institute for Occupational Safety and Health (NIOSH) has recommended lowering this limit because 1,3-butadiene has been shown to cause cancer in laboratory animals. OSHA is in the process of lowering the occupational exposure standard to a permissable exposure limit of 2 ppm and a
15 minute short-term exposure limit of 10 ppm (OSHA, 1990).
Workers exposed to high levels of 1,3-butadiene during the manufacture of rubber reported irritation of the eyes, nasal passages, throat and lungs (Wilson, 1944). Some developed coughing, fatigue and drowsiness, but all symptoms disappeared upon removal of the gas. Exposure levels were not stated in this study, but
subsequent studies have shown that concentrations of several thousand ppm cause irritation to eyes, skin, nose, and throat (Carpenter et al, 1944; Parsons and Wilkins, 1976). An epidemiological study among workers at a 1,3-butadiene manufacturing facility found a statistically significant excess mortality from cancer of the lymphatic and hematopoietic system despite an overall deficit in cancer mortality, presumably caused by the "healthy worker effect" (Divine, 1990). Another study of 12,113 rubber workers in the U.S. and Canada also found an excess of lymphatic and hematopoietic malignancies despite an overall deficit in cancer mortality (Matanowski et al, 1990). In summary, available studies provide evidence of an association between an excess of leukemias and lymphomas and work in an environment with 1,3-butadiene. The International Agency for Research on Cancer has classified 1,3-butadiene as a group 2B carcinogen (lARC, 1987) with sufficient evidence for carcinogenicity in experimental animals, but inadequate evidence for carcinogenicity of 1,3-butadiene in humans.
studies of the chemical's interaction with DNA and the analysis of mutagenic potential. The mutagenic potential of 1,3-butadiene was tested in the Salmonella typhimurium
histidine reversion assay by DeMeester et al (1978). Mutagenic activity was observed
only when strain TA1530 or TA 1535 bacteria, which are sensitive to base pair
mutations, were exposed to 1,3-butadiene in the presence of S9 mix prepared from Aroclor 1254- or phenobarbitone-treated rats. This suggests that 1,3-butadiene is not a direct-acting mutagen and that it must be metabolized to mutagenic intermediates that cause base pair substitutions. DeMeester also reported that the mutagenic metabolites were volatile by co-incubating Salmonella plates with and without S9 in the same
1,3-butadiene atmosphere. Reversion rates were increased on both sets of plates indicating 1,3-butadiene was metabolized on the plates containing S9 to volatile mutagenic metabolites which were active in the plates without S9 mix.
The metabolism of 1,3-butadiene has been examined in vitro in the presence of rat liver microsomes supplemented with an NADPH-generating system (Malvoisin et al, 1979; Malvoisin and Roberfroid, 1982). (Figure 1.1) These studies showed that
1,3-butadiene is metabolized via a mixed function oxidase (MFO) catalyzed oxidation to its major metabolite 1,2-epoxybutene (EB). 1,2-Epoxybutene can be subsequently
metabolized to diepoxybutane (DEB) via MFO and 3-butene-1,2-diol via epoxide hydrolase. This last product can also act as a substrate for cytochrome
P450-dependent monooxygenation, forming of 3,4-epoxy-1,2-butanediol (EBD). The epoxide metabolites of butadiene are likely to be the ultimate mutagens and
carcinogens. Evidence in rats suggests that 1,3-butadiene is metabolized to
1,2-epoxybutene in vivo (Bolt et al, 1983) as 1,2-epoxybutene is present in the expired air of rats exposed to 1,3-butadiene. This indicates that the pathway outlined by
Malvoisin based on in vitro data also occurs in vivo.
As the major metabolite of butadiene metabolism, 1,2-epoxybutene (EB) is postulated to be the main cause of the mutagenicity of the parent compound in vivo and in S9 activated in vitro test systems. EB has been shown to react with
deoxyguanosine and DNA in vitro (Citti et al, 1984). The main adducts were identified
1.2). 7-(1-hydroxy-3-buten-2-yl) guanine was the major adduct produced. The rate of spontaneous depurination of EB-N(7)Gua-DNA was determined to follow first order kinetics with a half-life of 50 hours. Both 7-(1-hydroxy 3-buten-2-yl) guanine and 7-(2-hydroxy-3-butan-1-yl) guanine, and the expected reaction product of DEB with guanine [7-N-(2,3,4-trihydroxybutyl) guanine] were detected by Aminex-A6 column
chromatography in liver DNA hydrolysates from B6C3F1 mice exposed to
(1,4-^^C)1,3-butadiene, but not in rats exposed similarly (Jelitto et al, 1989).1,2-Epoxybutene has been shown to be a direct acting mutagen in bacteria by DeMeester et al (1978) and Hemminki et al (1980). Sharief et al (1986) demonstrated that EB is a powerful inducer of in vivo chromosomal damage as measured by
increased frequencies of sister-chromatid exchanges and chromosomal aberrations in the mouse. Diepoxybutane is a bifunctionai epoxide with a high reactivity toward
nucleophiles, alkylating DNA at the N7 position of guanine (Van Duuren, 1969). DEB interacts with DNA in a manner typical of bifunctionai alkylating agents to cause interstrand cross links between adjacent guanine bases (Lawley and Brookes, 1963,
1967). DEB is mutagenic in bacteria (Voogd et al, 1981; Wade et al, 1979); yeast
(Zaborowski et al, 1983) and Drosoptiila germ cells (Zimmering, 1983), and has been shown to induce both point mutations and multigenic deletions in Neurospora crassa (Luker and Kilbey, 1982). DEB also induced high levels of chromosomal abberrations
(CA) and sister-chromatid exchanges (SCE) in mouse cells after in vivo exposure (Conner et al 1983; Walk et al, 1987), as well as CAs and SCEs in cultured rat and
hamster cells (Dean and Hodgson-Walker, 1979; Perry and Evans, 1975). Both EB and DEB were shown to induce SCE in vitro in Chinese hamster ovary cells and cultured human lymphocytes (Sasiadek et al, 1991a; 1991b).
Inhalation carcinogenicity studies have been conducted with both B6C3F1 mice
and Sprague-Dawley rats (Huff et al, 1985; Owen et al, 1987). Mice exposed to 625
ppm and 1250 ppm 1,3-butadiene exhibited a marked increase in the incidence of primary tumors in both sexes. The study was planned for 104 weeks, but had to be terminated at 60-61 weeks because of excessive mortality among the exposed mice. The tumors included malignant lymphomas, hemangiosarcomas of the heart,
alveolar/broncheolar neoplasms, squamous cell neoplasms of the forestomach, acinar cell carconoma of the mammary gland, granulosa cell neoplasm of the ovary and hepatocellular neoplasms. The chronic exposure study in mice was repeated (National Toxicology Program, 1984,1993, Melnick et al, 1984), and divided into a
stop-exposure study and a two-year study. In the stop-stop-exposure study, groups of 50 male mice were exposed to 1,3-butadiene at concentrations of 200 ppm for 40 weeks, 625 ppm for 13 weeks, 312 ppm for 52 weeks, or 625 ppm for 26 weeks. The total
exposure of 1,3-butadiene (concentration times duration of exposure) of the first two groups was approximately 8000 ppm • wks, while that of the latter two groups was approximately 16000 ppm- weeks. The survival of all exposed mice was markedly
lower than that of controls. The incidences of lymphocytic lymphoma, histiocytic sarcoma, cardiac hemangiosarcoma, alveolar/bronchiolar adenoma and carcinoma, forestomach squamous cell papilloma and carcinoma, hepatocellular adenoma,
Harderian gland adenoma and adenocarcinoma, and preputial gland carcinoma were significantly increased. At similar total exposures, the incidence of lymphocytic
lymphoma was greater at higher concentrations of 1,3-butadiene for short exposure
times than lower concentrations for extended periods of time (34% at 625 ppm for 13 weeks versus 12% at 200 ppm for 40 weeks; 60% at 625 ppm for 26 weeks versus 8% at 312 ppm for 52 weeks).
In the 2-year studies, groups of 70 mice of each sex were exposed to air
containing 0, 6.25, 20, 62.5, or 200 ppm 1,3-butadiene for 6 hours per day, 5 days per week for up to 2 years. Groups of 90 mice of each sex were exposed to 625 ppm
1,3-butadiene on the same schedule. Exposure to 1,3-1,3-butadiene over a period of two years induced benign and malignant neoplasms at multiple sites. At 20 ppm, male mice had increased incidences of histiocytic sarcoma and hepatocellular adenoma and carcinoma, while at 6.25 ppm, female mice showed increased incidences of
gland carcinoma, adenoacanthoma, and malignant mixed tumor (females only); ovarian benign and malignant granulosa cell tumors; and forestomach squamous cell papilloma and carcinoma. Low incidences of uncommon neoplasms also occurred in exposed male and female mice, including intestinal carcinomas in males, renal tubule adenomas in males and females, skin sarcomas (all types combined) in females, and Zymbal's gland adenomas and carcinomas in females. Lymphocytic lymphomas appeared as early as week 23, appeared to originate in the thymus, and were the
principle cause of early death in male and female mice exposed to 625 ppm
1,3-butadiene. Butadiene exposure above 200 ppm resulted in an increased incidence of lymphocytic lymphomas in both male and female mice. The early and extensive
development of lethal lymphocytic lymphomas in mice exposed to 625 ppm resulted in a reduced number of mice at risk for neoplasms developing later at other sites.
An increased incidence of tumors was also seen in male and female rats
exposed to 1000 and 8000 ppm butadiene for 105 weeks (females) and 111 weeks (males) (Owen et al, 1987). In general, the types of tumors seen in rats differed from those seen in mice. At both high and low doses.the female rats had increased
incidences of uterine tumors, mammary tumors, and thyroid follicular cell tumors, and an increased incidence of zymbal gland carcinoma at high doses. Male rats had
increased incidences of pancreatic exocrine adenoma and testes Leydig cell tumors at
the high dose. In contrast to the observations in mice, the rat study showed no
increase in mortality secondary to neoplasia and therefore it was not necessary to
terminate the study early. In summary, long-term inhalation studies revealed that 1,3-butadiene is a potent carcinogen in B6C3F1 mice, and a weak carcinogen in the
Sprague-Dawley rat.
Differences in the activation or detoxication steps of butadiene metabolism may be responsible for species differences in carcinogenicity. Several studies have been conducted to examine species differences in susceptibility to butadiene-induced carcinogenesis. In mice and rats, metabolism of 1,3-butadiene to its primary metabolite 1,2-epoxybutene follows linear pharmacokinetics at exposure
concentrations below 1000 ppm (Laib et al, 1988). Saturation of butadiene metabolism
occurs at 2000 ppm in both species. These studies revealed that 1,3-butadiene is metabolized by mice at twice the rate of rats, at both low and high exposure
concentrations. Mice also retain a larger dose of inhaled butadiene and metabolites
per unit body weight than do rats at the end of a 6 hour exposure (Bond et al, 1986). Sampling during exposure revealed that the blood of mice contained concentrations of
EB 2-5 times greater than rat blood. However, identification of the metabolites in blood was tentative and based on codistallation in cold traps of authentic epoxide standards. Similar concentrations of 1,3-butadiene and diepoxybutane were measured in blood of
rats and mice.
When mice and rats are exposed to high concentrations of 1,3-butadiene (>2000 ppm; conditions of saturated metabolism), EB is detected in exhaled air of the animals. The concentration of exhaled EB increases with exposure time and for rats, reaches a maximum concentration at ~4 ppm. However for mice, the concentration of exhaled EB continues to increase with exposure time until signs of acute toxicity are observed at ~10 ppm (Kreiling et al, 1987). Also under these conditions, depletion of
hepatic nonprotein sulfhydryl (NPSH) content was different for rats and mice (Kreiling et al, 1988). Hepatic NPSH content of B6C3F1 mice declined to 20% of corresponding control values after 7 hours of exposure to >2000 ppm butadiene, and was further depleted to 4% after 15 hours, when signs of acute toxicity were observed. After 7
hours of exposure to butadiene, hepatic NPSH content in Sprague-Dawley rats only
declined to 80% of controls, and remained stable after 15 hours of exposure. In
summary, detoxication of EB is saturable in mice, but not in rats. At high exposure
concentrations, this leads to a continuous accumulation in mice of EB which can be
traced in the exhaled air of the animals.
In experiments with liver postmitochondrial fractions from mouse, rat, monkey
and man and a NADPH-regenerating system, the formation rate of EB from 1,3-butadiene was found to be different in the four species (Schmidt and Loeser, 1985). Female mouse liver produced the highest amounts of butadiene monoxide, followed by male mouse liver. EB formation in rat and human liver was lower, but similar in both
species. Of the four species tested, rhesus monkey liver yielded the lowest amounts of
epoxide. Ethoxycoumarin-O-deethylase (EOD) was determined as a monooxygenase marker, and with the exception of monkey liver, there was good correlation between relative EOD activities and monoxide formation in vitro. Activity of epoxide hydrolase was approximately 20 times higher in monkey and human liver than in the liver of rodents. Ethoxycoumarin-O-deethylase and epoxide hydrolase activities were 10 times lower in lung tissue of mice and rats than in liver. Lung EOD activities were similar
between rats and mice; however, formation of butadiene monoxide was 5-6 times
higher in mouse lung preparations than in those from rat. Very low EOD levels were detected in homogenates of monkey and human lung. Both were reduced by a factor of 1000 compared to liver. Epoxide hydrolase levels in lung were also lower than liver by a factor of 60. No butadiene monoxide was detected in those preparations.
The data of Schmidt and Loeser suggest that differences in butadiene
metabolism in rodents versus primates may prevent direct extrapolation of results from rodent inhalation studies to humans. More recently, Kreuzer et al (1991) have
examined the enzyme specific kinetics of butadiene monoxide in the microsomes and cytosol from mouse, rat and human livers. After standardizing the data based on body weight, the metabolism of EB in mice is 2X faster than that in rats, while the
metabolism in man is 7X slower than that in rats. Studies of the toxicokinetics of
inhaled butadiene in primates determined that for equivalent inhalation exposure, the levels of metabolites in the blood of primates were 5-50X lower than in mice, and 4-14X lower than rat blood levels (Dahl et al, 1991). This may suggest that the monkey maintains lower internal doses of electrophilic butadiene metabolites than mice given comparable exposures, and that rats are intermediate. The toxicokinetics of
1,3-butadiene in man have not yet been determined.
Several enzymes appear to control the metabolism of 1,3-butadiene in vivo: cytochrome P450 monooxygenases, epoxide hydrolases and
glutathione-S-transferases. In addition, butadiene epoxides may conjugate nonenzymatically with glutathione or nonenzymatically hydrolyze. In recent experiments with microsomal and cytosolic preparations from B6C3F1 mice, Sprague-Dawley rats, and humans,
significant species differences in the \/^^ were observed for oxidation of 1,3-butadiene
to EB (Csanady et al, 1992). Butadiene oxidation to EB in mouse liver exceeded that
of human or rat liver or lung microsomes. The rates of lung microsomal oxidation of
butadiene were significantly lower than for liver microsomes, with the exception of relatively high oxidation levels in mouse lung.
Significant species differences were found not only in rates of oxidation of butadiene, but in the rates and relative affinities of pathways for EB metabolism. Liver and lung tissues from all species were able to detoxify EB by both epoxide hydrolase hydrolysis and GSH transferase conjugation. EH activity was highest in human
samples compared to rats and mice, while conjugation with GSH was highest for mice. The rate of metabolism of EB to DEB was quantifiable only in mouse liver
microsomes, and the Vn,^^ for this reaction was almost 10-fold lower than the \/^^ for oxidation of butadiene to EB. Thus it appears that butadiene is a better substrate for P450-mediated oxidation than EB. In addition, correlation analysis form human liver preparations revealed that cytochrome P450IIE1 may be the major P450 enzyme responsible for butadiene oxidation to EB.
Studies conducted in our laboratory have focused on the mutagenicity of the epoxide metabolites of butadiene in vitro at the hprt and tk loci of cultured human TK6 lymphoblasts. We have also examined the relative mutagenicities of 1,3-butadiene and its major epoxide metabolites EB and DEB at the iiprt gene in splenic T-cells of
exposed mice. These studies allow the comparison of the mutagenicity of these compounds in vitro versus in vivo, and comparisons between human- and mouse-derived lymphoid cells utilizing a common genetic target. We also determined the types of mutations generated after exposure to butadiene metabolites in vitro and in
vivo, and compare these to mutations produced after in vivo exposure to the parent
compound. Results obtained in vivo reflect the effects of absorption, distribution, metabolic activation, detoxication and DNA repair in a whole animal. Analysis of induced mutations at the tiprt locus may allow us to infer which DNA lesions formed by the interaction of butadiene metabolites with DNA may be involved in mutagenesis.
Measurement of relevant DNA adducts in different species could potentially be used
as molecular dosimeters of exposure to 1,3-butadiene or its metabolites.
Metabolism of Butadiene
1,3-Butadiene
\ P450
1,2-epoxybutene
Epoxide hydrolase y /cd\ V P450
OH
3-butene-1,2-diol
</
Diepoxybutane
(DEB)
Epoxide hydrolase
3,4-epoxy-1,2-butanediol
(EBD)
CH2=CH-CHOH
HoN
/
CH2=CH
?
O CH-CH 2OH
HoN
7-(2-Hydroxy-3-buten-1 -yl)guanine 7-(1 -Hydroxy-3-buten-2-yl)guanine
OH
/
CH 2-CH-CH-CH 2OH
OH
HoN
7-(2,3,4-Trihydroxybutyl)guanine
CHAPTER 2
Mutagenicity of Butadiene and Its Epoxide Metabolites in Cultured Human Lymphoblasts and in Splenic T-cells Isolated from Exposed B6C3F1 Mice
INTRODUCTION
Butadiene must be metabolized to exhibit its genotoxic effects. In vitro data
suggest that butadiene is metabolized in vivo to several epoxide intermediates.
1,2-Epoxybutene, the first metabolite of butadiene activation, is formed by an inducible microsomal P450 monooxygenase (Bolt et al, 1983). Further metabolic transformation of 1,2-epoxybutene by P450 results in oxidation to diepoxybutane. Alternatively, EB may undergo non-enzymatic conjugation with glutathione, conjugation by
glutathione-S-transferase, hydrolysis by epoxide hydrolase, and/or further P450
oxidation to 3,4-epoxy-1,2-butanediol. The epoxide metabolites of butadiene are expected to be responsible for its ultimate carcinogenic potential.
The human lymphoblastoid cell line TK6 provides two loci in its genome at which mutants are selectable by the addition of purine or pyrimidine analogs. The first locus, the hypoxanthine-guanine-phosphoribosyl transferase gene, has been widely used in mutagenesis studies (review: Caskey and Kruh, 1979). The liprt gene is X-linked, therefore each cell carries only one functional copy so that a single mutational event can produce a selectable mutant cell, l-lprt is a nonessential gene; the enzyme catalyzes a purine salvage pathway which links free guanine or hypoxanthine to phosphoribosyl pyrophosphate, resulting in the formation of GMP or IMP. When provided with the purine analog 6-thioguanine, functional HPRT will form 6TGMP, which is toxic to the cell. Therefore, growth in the presence of 6-thioguanine selects for cells that lack functional HPRT. The thymidine kinase locus in TK6 cells has been manipulated so that it is heterozygous (tk+/-). Mutant cells are selected by growth in the presence of trifluorothymidine. Both the hprt and tk loci are capable of detecting point mutations, frameshift events, and deletions which remove part or all of the gene sequence. In addition, a class of tl<- mutants can be recovered which possess a slow-growth phenotype. Molecular analyses of these mutants have revealed that they
always involve complete loss of the tk gene. It is hypothesized that these mutations
involve large deletions which remove a flanking gene required for efficient growth
(Yandell et al, 1986). Therefore a partial characterization of mutation type can be accomplished by observing the growth characteristics of tl<- mutants, i. e., the
production of slow growth tk- mutants signals the induction of large deletions.
Two groups have developed techniques for the selection and cloning of somatic liprt mutants which arise in vivo in the T-lymphocytes of the mouse (Dempsey and Morley, 1986; Jones et al, 1987a; Jones et al, 1987b). Our laboratory has modified these techniques to select HPRT- splenic T-cells from B6C3F1 mice, the strain used in the National Toxicology Program bioassays. This strain has been shown to be much
more susceptible to the carcinogenic effects of 1,3-butadiene than the Sprague-Dawley rat (Huff et al, 1984; Owen et al, 1987).
The goals of this study were: 1) to examine the relative mutagenic potential of each of the epoxide metabolites of butadiene in vitro at two loci {tiprt and tk) in
human TK6 lymphoblastoid cells; and 2) to determine the relative mutation frequencies induced at the hprt locus in splenic T-cells of male B6C3F1 mice after exposure to 1,2-epoxybutene, diepoxybutane or 1,3-butadiene. TK6 cells are devoid of P450 and epoxide hydrolase activity, so interconversion of the epoxide metabolites is not possible. Therefore, the in vitro results should reflect the true relative activity of EB,
DEB and EBD in human cells in the absence of metabolism. These results can be
compared to the relative concentrations of the epoxide metabolites produced in vivo
following butadiene exposure to ascertain their contribution to the overall mutagenic burden produced by butadiene. The in vivo work confirms that butadiene is mutagenic in intact animals at the tiprt locus. EB and DEB were also administered in vivo to determine their mutagenic consequences. It should be remembered, however, that metabolic conversion of EB and DEB is possible in vivo. The in vitro and in vivo studies also will generate tiprt mutants for subsequent molecular analysis.
MATERIALS AND METHODS Chemicals and Media Components.
Materials were obtained from the following sources: fetal bovine serum, recombinant human IL2 (GIBCO Laboratories, Grand Island, NY); bovine calf serum
(Hyclon© Laboratories, Logan, UT) RPMI, HEPES buffer, glutamine, MEM
non-essential amino acids, pen-strep, sodium pyruvate (Lineberger Cancer Research Center, Tissue Culture Facility, UNC-CH); HL-1 medium (Ventrex Laboratories, Inc., Portland, ME); butadiene monoxide, butadiene diepoxide, 1,3-butadiene (purities 98%, 97%, and 99%, respectively, Aldrich Chemical Company, Milwaukee, Wl);
3,4-epoxy-1,2-butanediol (synthesized and generously provided by Dr. R. Irons, University of Colorado, Boulder, CO); DMSO (Fisher Biotech, Pittsburgh, PA); concanavalin A (United States Biochemical Corporation, Cleveland, OH); Lympholyte M (Cedarlane Laboratories Limited, Hornby, Ontario, Canada).
Cell Culture and Exposure
The TK6 human lymphoblast system has been described (Liber and Thilly, 1982; Skopek et al, 1978). Human lymphoblast cells (TK6) were maintained in RPMI 1640 + L-glutamine supplemented with 10% heat-inactivate bovine calf serum, and 12.5 mM HEPES buffer. Cultures were exposed to varied concentrations of EB, DEB,
or EBD and kept closed capped for 24 hours. Preliminary experiments for each
compound tested determined the relative survival of TK6 over a wide range of exposure levels. Immediately after exposure the cells were washed and plated at a density of 2 - 8 cells per well in 96-well microtiter dishes to determine relative survival. After 12 days of incubation, plates were scored for the presence of positive wells and plating efficiency (survival) was calculated by the formula: % survival = [-In (negative
wells/total wells)/(cells per well)] x 100%.
Prior to exposure TK6 cells were treated with CHAT
(cytidine-hypoxanthine-aminopterin-thymidine) to reduce the spontaneous hprt
background. For each experiment, three 50 ml cultures (4x10^ cells/ml) were
exposed for 24 hours. Non-treated control cultures were also included in each experiment. Immediately after treatment, cells were centrifuged and resuspended in fresh medium. Survival of the treatment was evaluated by plating a portion of each culture at 2 - 8 cells/well in 96-well microtiter dishes. All cultures were diluted daily to 4
X 10^ cells/ml. Two to three days after treatment, a portion of each culture was plated
in 96-well microtiter dishes at 40,000 cells/well with 1 |ig/ml trifluorothymidine (TFT) to
select for tk mutants. Cells were also plated at 2 cells/well in the absence of selective agent to determine plating efficiency. Ten days after plating, TFT plates were scored for the presence of normal-growth tk- mutants and re-fed with 25 p.1 medium with 10 |a,g/ml TFT. After an additional 10 days, TK- slow-growth mutants were scored.
The remainder of the treated cultures were maintained with daily dilution to 4 x
10* c/ml for 7-8 days after treatment to allow full expression of the 6-TG resistant
mutant phenotype. At this time cultures were plated as describe above, except 1 jig/ml 6-TG was used as the selective agent. HPRT- mutants were counted 14 days after plating. The number of clone forming units (cfu) per well on the PE and 6TG plates
were calculated by observing the fraction of negative wells and then applying Poisson
statistics. The mutant fraction was calculated as follows: [(cfu/well for 6TG plates)(5 x
10"*)]/(cfu/well on PE plates). Animals and Treatment.
Male B6C3F1 pups (7 to 10 days old) and C57BI6 dams were obtained from
Charles River Breeding Laboratories (Raleigh, NC). Dams were fed standard chow and distilled water ad libitum and maintained in a 12 hour light/dark cycle. Beginning at 12 days old, eight animals per dose group were treated with butadiene monoxide (in DMSO) at 60, 80, or 100 mg/kg body weight delivered as 3 intraperitoneal injections administered every other day. Cumulative doses were 180, 240, and 300 mg EB/kg body weight. In a similar experiment, diepoxybutane in water (7, 14, and 21 mg/kg) was administered i.p. every other day, but increased mortality required the premature cessation of dosing. As a result, only the lowest dose animals received 3 doses. Cumulative doses for these groups were
21, 28, and 42 mg DEB/kg body weight. After injection, the animals were maintained as described above for two weeks. In a separate inhalation experiment conducted in
collaboration with Dr. Rogene Henderson of ITRI, Albuquerque, NM,dams and pups were
exposed to ambient air (controls) or 625 ppm 1,3-butadiene for 6 hours/day, 5 days/week
for two weeks. Two weeks after the end of exposure, animals were coded as to their identity and shipped to UNC-CH for sacrifice and analysis.
Mutant T-cell Isolation.
Animals were sacrificed by COg asphyxiation followed by cervical dislocation and
their spleens were removed aseptically. Spleens were crushed individually with the end of
a 5 ml syringe plunger in 1 ml RPMI medium supplemented with 10% VA/ fetal bovine serum, 20% VA/ HL-1 medium, 2 mM glutamine, MEM nonessential amino acids, 20 mM HEPES buffer, 1 mM pyruvate, IX pen-strep, 50 |j.M mercaptoethanol, and 15 U/ml recombinant human IL-2, drawn through a 5/8" 25 gauge syringe needle, and expelled gently into an additional 5 ml of medium. The cell suspension from each spleen was then layered onto a 5 ml aliquot of Lympholyte M and spun at room temperature for 15 minutes at 500 X g. Mononuclear cells at the interface were removed with a pipette and washed twice with 5 ml of the medium described above. Cells were then resuspended in complete
medium, enumerated by a Coulter Counter, and adjusted to a concentration of 2 x 10®
cells/ml. Concanavalin A was then added at a concentration of 4 ^ig/ml. Cells were thenincubated for 24 hours at ST'C in a 6% C02 humidified incubator. A total of 4 x 10''
mononuclear cells per spleen were routinely obtained. To determine plating efficiency (PE), a sample of the culture was diluted with complete medium to 60 cells per ml, and plated in
0.1 ml aliquots in 96-well microtiter dishes in the presence of 4 x 10* lethally irradiated (10
krad) mouse T-cells per well (primed as above for the experimental samples). To isolate
mutants, the original culture was diluted to a concentration of 5 x 10^ cells/ml,
supplemented with 1 ^ig 6TG/ml, and seeded in 96 well plates at 0.1 ml per well. Plates were scored for colony growth at 100X magnification on day 10. The number of clone forming units (cfu) per well on the PE and 6TG plates was calculated by observing the fraction of negative wells and then applying Poisson statistics. The mutant fraction was
calculated as follows: [(cfu/well for 6TG plates)(1.2 x 10"*)]/(cfu/well on PE plates).
RESULTS
The cells were exposed to the following concentration ranges: 1,2-epoxybutene (EB) - 0, 124, 248, 372, and 496 ^iM; 3,4-epoxy-1,2-butanediol (EBD) - 0, 288, 576, and 864 ^iM; diepoxybutane (DEB) - 0, 1.3, 2.6, 3.9, and 5.2 nM. All three metabolites
of butadiene exhibited toxicity to human lymphoblastoid cells (TK6) in a
dose-dependent manner after a 24-hour exposure (Figures 2.1, 2.2, 2.3). Survival of 37% was achieved at approximately 400 |iM EB, 800 |iM EBD, and 2.6 ^iM DEB. Therefore, DEB exerts toxic effects in TK6 cells at concentrations greater than
100-fold lower than EB or EBD (Figure 2.4).
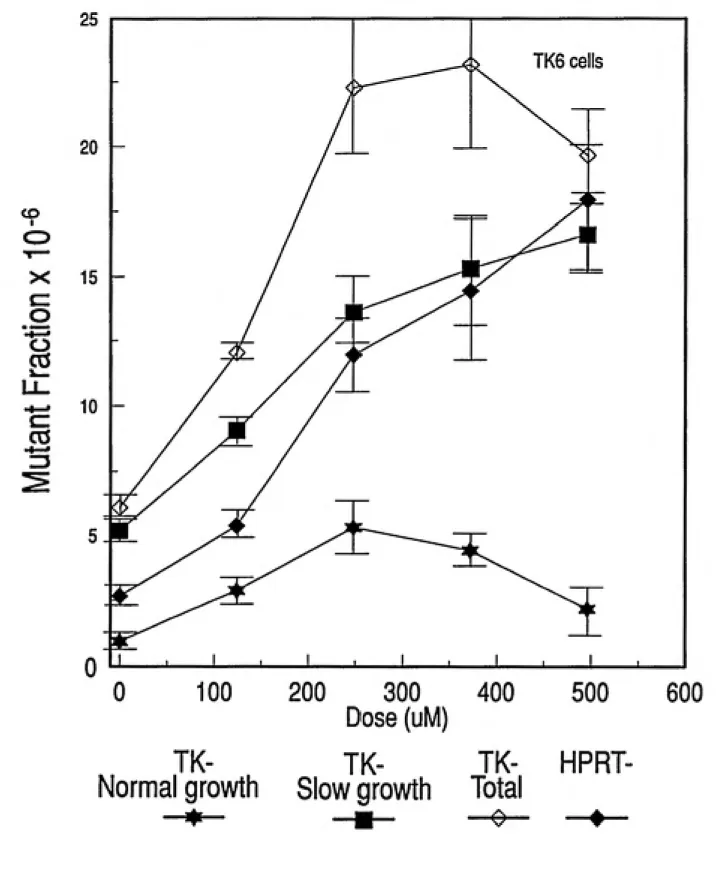
Each butadiene metabolite tested exhibited dose-dependent increases in mutation frequency at both the hprt and tk loci of TK6 cells (Figures 2.5, 2.6, 2.7). Concentration ranges of EB and DEB were the same as stated for toxicity
determinations. Concentrations used in mutagenicity studies with EBD were 0, 179, 448, and 807 |iM, because of the limited amount of compound available. At the hprt
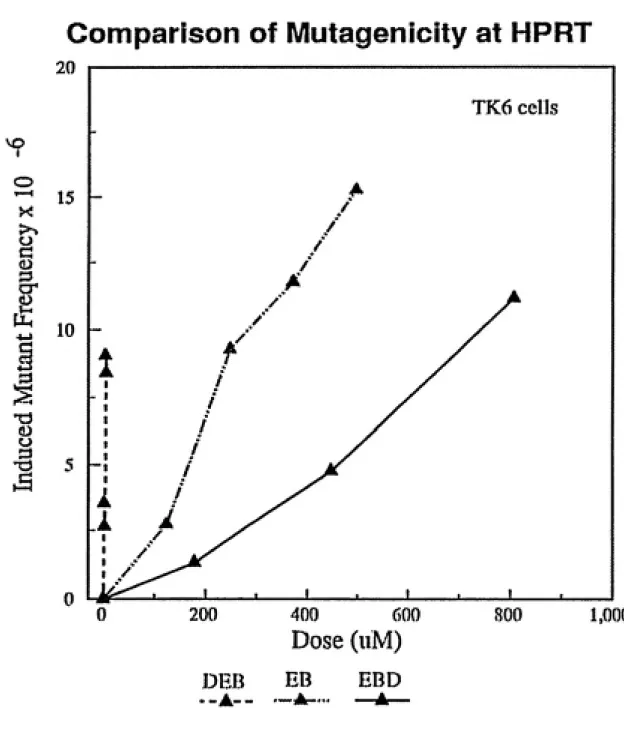
locus, an extrapolated induced mutation frequency of 5 x 10"^ was produced by
treatment with 3.5 |iM DEB, 150 ]xM EB and 450 |iM EBD (Figure 2.8). Similar results were obtained at the tk locus, with exposures of 2.6 |j.M DEB, 250 ^.M EB and 450 p-M
EBD resulting in an induced normal growth mutant fraction of 5 x 10"® (Figure 2.9). All
three metabolites were also capable of inducing slow growth TK- mutants (Figure 2.10). Induction of slow growth tk mutants occurred at approximately the same frequency as normal growth tk mutants for each compound studied. Thus, all three epoxide metabolites of butadiene were mutagenic at both the hprtanti the tk loci, withmutagenic potency of DEB»>EB>EBD. Diepoxybutane exhibited mutagenic activity at
concentrations one or two orders of magnitude lower than 1,2-epoxybutene or
3,4-epoxy-1,2-butanediol.
For all compounds tested in the B6C3F1 mouse, the plating efficiencies of splenic T-cells from treated animals were indistinguishable from control animals and were consistently between 4 and 11%. Mice exposed via inhalation to 1,3-butadiene did not show acute toxicity, but experienced some growth retardation. Spleens from exposed animals were noticeably smaller than controls, and average T-cell recovery
(1.7 X 10'' cells/spleen) was less than one-half of controls (3.6 x 10^ cells/spleen).
Spleens from exposed mice exhibited a six-fold increase in average mutationfrequency over controls (Figure 2.11).
Exposure to intraperitoneal injections of 1,2-epoxybutene resulted in early
mortality for one animal in the 60 mg/kg dose group, and two animals in each of the higher dose groups. Mice exposed to 1,2-epoxybutene exhibited increased mutation frequencies at the hprt locus in splenic T-cells two weeks after the end of exposure. (Figure 2.12} Although considerable interindividual variation was detected, a significant dose-dependent increase in mutation frequency was demonstrated among the dose
groups.
Intraperitoneal administration of diepoxybutane also resulted in acute toxicity and early mortality for several mice in each dose group (2 of 6 in the 7 mg/kg group, and 2 of 6 in theU mg/kg dose group, 3 of 8 in the 21 mg/kg dose group.) Dosing with DEB was terminated prematurely in the second and third groups due to the increased mortality rate. Therefore, total dose of DEB for each of the groups was 21 mg/kg, 28 mg/kg and 42 mg/kg. Splenic T-cells from DEB exposed mice exhibited a dose-dependent increase in mutation frequency at the hprt locus compared to
controls (Figure 2.13}.
DISCUSSION
Selectable mutations at the X-linked hprt locus can result from point mutations,
frameshifts, or small deletions. The autosomal tk locus can also be used to detect these DNA alterations. Moreover, an additional class of TK- mutants have been shown
to exhibit slower growth characteristics than "normal growth" mutants and molecular analysis suggests that these mutants arise from large deletions. Therefore, the presence of slow growing tk- colonies on microtiter dishes is indicative of large deletion mutants. Exposure of TK6 cells to the epoxide metabolites of 1,3-butadiene resulted in marked increases in mutation frequency at both the hprt and the tk loci. In addition, EB, DEB and EBD all induced slow growth tk- mutants and therefore are capable of causing large deletions in DNA. An induced slow-growth mutant frequency
of 10 X 10"® was produced by treatment with 2 |iM DEB, compared to 400 |j.M for both
EBand EBD.
Male B6C3F1 mice were used in this study to correlate the findings of this
study with the National Toxicology Program carcinogenicity study in rodents. Previous experiments in the development of the in vivo mouse T-cell mutagenicity model utilized adult B6C3F1 mice. When adult mice administered single and multiple i.p injections of
1,3-butadiene dissolved in 80% DMSO:20% EtOH were sacrificed 8 weeks post¬ exposure, no increases in mutant fraction were observed (data not shown). However,
preweanling mice given the same treatment exhibited a small but significant increase
over background (data not shown). Enhanced sensitivity of preweanling mice relative to adults has also been observed in our laboratory with other compounds, including
ENU and ethylene oxide. Preweanling mice (12 days old) have higher rates of cell proliferation than adult mice in target organs, such as the thymus and spleen. Spleen weight and number of splenic T-cells in these mice has been found to increase 3- to 4-fold between birth and four weeks of age (unpublished results). Since cell replication is needed to fix mutations, it is not surprising that preweanling mice are more sensitive to induced mutation than adults. Rate of migration of differentiated T-cells from the thymus to the spleen is also maximum in mouse pups. Mutants induced in the thymus must first traffic to the spleen for their isolation and detection. We have determined empirically that sampling spleens 2 weeks post-exposure yields maximum hprt mutation frequencies in splenic T-cells. This sampling time was used in the present
experiment.
Although B6C3F1 mice are a hybrid of two inbred strains, individual mice exhibited marked differences in induced mutation at the hprt locus of splenic T-cells after exposure to 1,2-epoxybutene, diepoxybutane, or 1,3-butadiene. This
interindividual variation can be the result of one or more of the following: 1.) variation in the measurement of mutation frequency, 2.) variation in the true mutagenic
response among different animals, or 3.) clonal expansion of hprt mutants in the body.
The latter phenomenon has been observed previously in both mouse (Skopek et al,
1992) and human subjects (Redo et al, 1990; Nicklas et al, 1988).
The inhalation exposue level of 625 ppm 1,3-butadiene is below the previous time-weighted average (TWA) value for occupational human exposure of 1000 ppm. Exposure of the mice to 625 ppm, 5 days/week for 2 weeks was chosen to mimic
conditions of a similar study by Tice et al (1987) in which bone marrow from adult male B6C3F1 mice showed significant increases in a range of indicators of genotoxic and cytotoxic damage. The highest doses of 1,2-epoxybutene and diepoxybutane
administered approach the LD50 values for these compounds in other mouse strains.
Multiple doses were found to be the most effective in inducing mutants for study. Actual blood and target tissue levels of the metabolites after i.p. injection are not known in this study, but this would be an interesting area of future investigation.
In summary, the epoxide metabolites of butadiene are mutagenic in vitro in
human cells and in vivo in the splenic T-cells of exposed B6C3F1 mice. In addition,
1,3-butadiene exposure (625 ppm) for two weel<s induces a mutagenic response in
B6C3F1 mice. The mutagenicity of the parent compound in vivo is attributed to its
metabolism to one or more of the epoxide metabolites. Further molecular
characterization of the mutants induced by butadiene in vivo and comparison with the
mutational spectra induced by each of its metabolites may allow determination of
which metabolite is primarily responsible for the mutagenic potential of butadiene.
Toxicity of 1,2-epoxybutene (EB)
03
CO
CD
O
CD
Q-TK6 cells
100 200 300 400 500 600
Dose (|LiM)
Toxicity of Diepoxybutane (DEB)
100
13
>
g
TK6 cells
2 3 4
Dose (uM)
Toxicity of 3,4-epoxy-1,2-butaneclioi (EBD)
TK6 cells
400 600
Dose (uM)
1,000
Butadiene Metabolite Toxicities
100
1X6 cells
13 30
400 600
Dose (uM)
DEB
—n—
EB EBD
1,000
<9
o
OJ
TK6 cells
TK-Normal growth
200 300 400
Dose (uM)
TK- TK-
HPRT-Slow growth Total
—e—
Figure 2.5 Mutagenicity of 1,2-epoxybutene at the hprt and tk loci in
TK6 cells
2 3 4
Dose (uM)
TK-Normal growth Slow growth jotal ^^^'^'
TK6 cells
TK-Normal growth
400 600
Dose(uM)
TK- TK-
HPRT-Slow growth Total
1,000
ͣ
^
Figure 2.7 Mutagenicity of 3,4-epoxy-1,2-butanediol at the hprt and tk
Connparison of IVIutagenicity at HPRT
20
O
X
a
cr
tin
15
Z 10
CD
O
0
TK6 cells
0 200 400 600
Dose(uM)
EB EBD
800 1,000
Figure 2.8 Comparison of relative mutagenicities of EB, DEB,
and EBD at the hprt locus in human lymphoblastoid
Comparison of Mutagenicity at TK
Normal Growth mutants
TK6 cells
200 400 600
Dose (uM)
DEB EB EBD
,000
Figure 2.9 Comparison of relative mutagenicities of EB, DEB
Comparison of Mutagenicity at TK
Slow growth mutants
I
30
23
X
>>
s
^
20
:: 15
-I
u
I
10
5
-0
TK6 cells
DEB
400 600
Dose (uM)
EB EBD1.000
c
9
JMPf
e
I
Mutagenicity of 1,3-butadiene
in male B6C3F1 mice
10
8
6
-1-
8
[ͣ
©
u
l- o
u
&
r °
r °
1 9
t 10 600
Dose (ppm)
Mutagenicity of 1,2-epoxybutene
in male B6C3F1 mice
>. 10
I
40 60 80
Dose X 3 (mg/kg)
120
Figure 2.12 Hprt- mutant frequency induced in splenic T-ceI!s of B6C3F1 mice exposed to 1,2-epoxybutene (EB) via
I\/lutagenicity of Diepoxybutane
in maie B6C3F1 mice
25
20
-X
I
71 10
5
-0
l-
o
1-o
o
u o
Y - ͣ
o
o o
o
U
o
o
qd|o-
1o
1 1 1 1 1 •
0 10 20 30 40
Total Dose (mg/kg)
50
Figure 2.13 Hprt- mutant frequency induced in splenic T-cells of
B6C3F1 mice exposed to Diepoxybulane (DEB) via i.p.
CHAPTER 3
Mutational Spectrum of 1,3-Butadiene and its Epoxide Metabolites at the Hprt Locus in
Cultured Human Lymphoblasts and in Splenic T-cells of Exposed B6C3F1 Mice
INTRODUCTION
The hprt gene has been a useful tool for the study of mutations occurring in
human or other mammalian cells (Caskey and Kruh, 1979; Fenwick 1985). Purine
analogs such as 6-thioguanine allow the relatively easy selection of mutants deficient in HPRT activity from cultured somatic cells. Isolated mutants can then be
characterized at the molecular level to reveal the specific outcome of mutagenesis.
The technique of Southern blot is used to identify large alterations in genomic DNA.
Polymerase chain reaction (PCR) amplification of hprt cDNA (Simpson et al, 1988; Yang et al, 1989 ) can be used to examine clonally isolated mutants capable of
producing hprt mRNA. The cDNA - PCR approach is only feasible for cells which
possess sufficient growth potantial in culture to permit isolation of clonally pure and viable HPRT- populations. Nucleotide sequencing of PCR products detects point
mutations, frameshift mutations, exon losses, small deletions and insertions.
Sequencing of intron regions of DNA can often identify point mutations resulting in mRNA splicing aberrations with resultant exon loss.
Recently developed techniques permit the selection and cloning of somatic hprt mutants which arise in vivo in the T-lymphocytes of the human (Albertini et al, 1982;
Morley et al, 1983), mouse (Jones et al, 1987), rat (Aidoo et al, 1991) and monkey
(Zimmer et al, 1991). Our group has developed a method to sequence hprt mutations
induced in vivo in splenic T-cells of B6C3F1 mice (Skopek et al, 1992) and has used this technique to analyze mutants induced by exposure to 1,3-butadiene (via
inhalation), 1,2-epoxybutene, or diepoxybutane (via i.p. injection). Mutational spectrum analysis at exon 3 of hprt utilizes the technique of denaturing gradient gel
electrophoresis (DGGE) in which mutant DNA sequences are separated from wild-type based on changes in their electrophoretic mobility when run in a denaturing
polyacrylamide gel (Cariello et al, 1990). Purified mutant sequences are then
sequenced by a fluorescence detection automated DNA sequencer. Comparison of the
mutational spectrum induced by metabolites of 1,3-butadiene in vitro and in vivo to that of the parent compound in vivo may reveal which metabolite is ultimately
responsible for its mutagenic potential. Identification of the major DNA lesions responsible for genotoxic damage by butadiene may be suitable to quantitation of
specific adducts as biomarkers of butadiene exposure.
MATERIALS AND METHODS
Materials.Chemicals and Enzvmes.
Materials were obtained from the following sources: Hybond-N (Amersham,
Arlington Heights, IL); Pst 1 restriction enzyme, Sephadex G50 columns
(Boehringer-Mannheim Biochemica, Indianapolis, IN); alpha-'^P dCTP (NEN Reseach
Products, Boston, MA); Random Prime Labelling Kit ( Bethesda Research Laboratories, Gaithersburg, MD); deoxynucleotide triphosphates (Pharmacia LKB Biotechnology AB, Piscataway, N.J.); Sequenase" and dideoxynucleotide triphosphates, (United States Biochemical Corporation, Cleveland, OH); AmpliTaq" DNA polymerase (Perkin-Elmer
Cetus, Norwalk, CT).
Mutant Isolation
Human TK6 lymphoblasts were maintained and prepared for treatment as
described previously. HPRT- mutant cells were induced by exposing cells to
concentrations of EB (372 |iM) and DEB (3.9 ^iM) which resulted in approximately 40%
cell survival. Five to six cultures of TK6 cells (4 x 10^ cells/ml, 50 ml/culture) were
treated with EB or DEB and incubated closed capped for 24 hours. To assure isolation of independent mutant clones, these cultures were then pooled and split into 50
individual 10 ml-culture flasks seeded at 1x10^ cells/ml. These cultures were maintained
(diluting when necessary) to allow for 6-TG' phenotypic expression. After 7 days the cultures were plated into individual microtiter dishes in the presence of 1 M.g/ml
6-thioguanine. After 12-14 days of incubation, one mutant colony was chosen per plate and allowed to grow. As normal growth resumed, each independent culture was plated at a limiting density of 0.03 cells/well in the presence of 6-TG. Ten to 14 days later,
independent clones were selected from each plate, allowed to grow, and then frozen for
later cDNA analysis and extraction of genomic DNA.
Southern Blot Analysis.
Genomic DNA was extracted from cell pellets and purified by phenol/chloroform extraction. After ethanol precipitation, genomic DNAs were quantitated by acid
hydrolysis of a small aliquot of each followed by HPLC analysis for guanine content.
Restriction digests used 15 ng of each mutant DNA and 5U of Psti restriction enzme
per lag of DNA and were incubated at 37°C for 2-12 hours. DNA was fractionated on 0.8% agarose gels. Southern blotting utiizing Hybond-N (Amersham) nylon membrane
was performed as directed by the manufacturer. Probes were prepared by the method of random prime labeling (Feinberg and Vogelstein, 1983) of single stranded PCR product. The single-stranded DNA was generated from a wild-type human hprt cDNA using PCR primers described by Bronstein et ai (1991). TK6 wild-type genomic DNA was used as a positive control on each blot. Blots were exposed to Kodak XAR-5 film with an intensifying screen for 4-7 days at -70°C.
PCR Amplification of cDNA
Amplification and sequencing of hprt mRNA from TK6 mutant clones were based on the method Yang et al (1989) with modifications as described in Bronstein et al
(1991).
Mutant splenic T-cell analysis.
Mutant T-cell clones were isolated from spleens of exposed mice as described previously. Cells from positive wells were pipetted into eppendorf tubes and washed with Dulbecco's phosphate buffered saline (without magnesium). To isolate genomic DNA, cell pellets were resuspended in 20 |j,l digestion mix [0.5% VA/ Tween 20, 0.1 mg/ml proteinase
K, IX PCR buffer (see below)], incubated at 55° C for one hour, boiled for 10 minutes, and
then frozen until needed (Skopek et al, 1992).
PCR Conditions.
To facilitate processing, aliquots of DNA samples were pooled in groups of two. Unless specified otherwise, all PCR volumes were 25 |il and were overlaid with 30 iil
mineral oil. The PCR mixtures contained IX PCR buffer (15 mM Tris-HCI [pH 8.7], 2.75
ͣͣ
mM MgCI2, 60 mM KCI), 0.75 mM of each dNTP, 1 |j.M of each primer, and 1.0 units Taq
polymerase. The thermal cycle consisted of 1 minute at 94" C, quick ramp to 45° C, 1
minute at 45° C, 2 minute ramp to 72° C, and 30 seconds at 72° C. Initial PCR
amplification from genomic DNA used 2 |il DNA solution and primers homologous to intron
sequences immediately adjacent to exon 3 (5' primer: 5'-CCTGATTTTATTTCTATAG-3'; 3'
primer: 5'-TTTAATTATAAGTAATTATACTTAC-3'). Thirty-five cycles were performed. To
analyze the high temperature melting domain of exon 3, the DNA from the initial PCR
reaction was gel-purified and then used as template for a second PCR amplification
containing a GC-clamped primer
(5'-CCGCGGGCGGGCCTCGCGCCGCGGGCCGGGACCCGCGGCCTGATTTTATTTCTAT
AG-3') and a primer homologous to internal sequences of exon 3 (P3HI primer:
5'-TCCAGCAGGTCAGCAAA-3'). The melting characteristics of the full length exon 3
fragment and of the GC-clamped, truncated fragment were determined by the melting
algorithm of Lerman and found to be very similar to those reported for human hprt (Cariello
etal, 1990).
DGGE and Mutant Sequence Purification
Oil was removed from PCR reactions and the volumes adjusted to 50 [i\ with water.
Samples were extracted twice with phenol and twice with chloroform. Mutant/wt
heteroduplexes of full length exon 3 fragments were formed by heating samples at 98° C for
10 minutes and then holding at 37° C for greater than one hour to allow reannealing.
Mutant/wt heteroduplexes of GC-clamped, truncated exon 3 fragments were formed by
denaturing the DNA at 98° C and holding overnight at 67° C. Samples were then
vacuum-dried and resuspended in 7 nl of loading buffer.One millimeter thick, 12.5% polyacrylamide (37.5:1 acrylamide:bisacrylamide) gels
containing linear gradients of denaturant were used. A 18% to 36% denaturant gradient
was used to resolve mutations in the low-temperature domain and a 36% to 53% gradient
for the high temperature domain (100% is defined as 7 M urea plus 40% VA/ formamide).
Samples were loaded onto gels while submerged in a water bath at 60°C and run for 15
hours at 150 V in TAE buffer. Gels were stained with ethidium bromide and visualizedunder UV light. Thin slices of gel containing mutant/wt heteroduplex bands were carefully
excised from the gel, crushed, and eluted overnight at 4° C in 100 iillO mM Tris (pH 8.0), 1
mM EDTA. Since the heteroduplexes isolated at this point were usually faint and
contaminated with wt homoduplex DNA, an additional round of purification was performed.
The supernatant from the crushed gel (100 |il) was diluted 25-fold into another PCR
reaction and reamplified with 20 additional cycles. Samples were then processed as
described above to form heteroduplexes, and loaded onto another denaturing gradient gel.
Mutant/wt heteroduplexes were again excised from the gel and eluted as above.
The supernatant containing each heteroduplex was then diluted 25-fold into two PCR
reactions, one containing only the upstream primer and the other containing only the
downstream primer; 15 cycles were performed. This reaction biased the concentration of
one strand of the heteroduplex relative to the other strand. The appropriate second primer
was then added to the PCR reactions and an additional 15 cycles performed. To determine
which PCR reactions produced the mutant homoduplex, samples from each were then
mixed with an equimolar amount of known wt PCR product, processed to form mutant/wt
heteroduplexes, and run on another denaturing gradient gel. The appearance of
pronounced mutant/wt heteroduplex bands indicated the presence of mutant homoduplex in
the corresponding PCR reaction. PCR samples with mutant homoduplex DNA were diluted
50-fold into another PCR reaction (50 ]x\) containing the appropriate downsteam primer (3'
primer or P3HI) and an upstream primer (5'+C primer) which contained a universal
sequencing primer sequence attached to the 5' end of the 5' primer sequence (5'+C primer:
5'-CAGGAAGACATTCTTTCCAGTTCCTGATTTTATTTCTATAG-3'). After 20 cycles, a
fraction of these reactions was njn on an 8% polyacrylamide gel for visualization. The
remainder of the full-length exon 3 products were electroeluted, ethanol precipitated, and
checked on an 8% polyacrylamide gel. Remaining GC-clamped truncated fragment was
applied to a Sephadex G50 column to remove excess primers and effluent collected.
DNA Sequencing.
Single-stranded sequencing template was generated by adding 1-5 ^il of the eluted
material to a 50 ^il PCR reaction with 0.5 ^ig of the appropriate downstream primer and
processed for 25 cycles (94°C, 1 min.; 44°C, 15 sec; 72°C, 30 sec). Reactions
were extracted twice with phenol and chloroform, ethanol precipitated, washed, and dried.
DNA was sequenced by the Sequenase dideoxy protocol specified by Applied Biosystems
for use with their DNA sequencer and a fluorescently-tagged primer
(5'-CAGGAAGACATTCTTTCCAGTT-3').
RESULTS
Southern Blot results.
Probing of Pst1 digested genomic DNA with wild-type '^P-labeled hprt cDNA results
in a distinctive banding pattern allowing identification of each of the exons in the hprt gene
sequence (Yang et al, 1984) (Figure 3.1). Several pseudogenes in human genomic DNA
also hybridize to hprt cDNA sequences, one migrating coincidentally with exon 1 of hprt.
Therefore, in this investigation definitive determination of the presence or absence of exon 1
was not possible. Of 35 EB-induced mutants analyzed by Southern blot, 31 showed no
change in banding pattern from wild-type when hybridized to wt hprt cDHA (88%) (Figure
3.2). In contrast, only 18 of the 39 DEB mutants analyzed gave wild-type banding patterns
(46.2%). Southern blot detectable alterations were seen in 11.4% of the EB-induced
mutants, compared to 53.8% of the DEB-induced mutants.cDNA/PCR Seouencinq results
Sequencing of cDNA from 11 EB-induced mutants has been completed (Figure 3.3).
All of the mutants sequenced gave wild-type banding patterns on Southern blot. Four were
point mutations (1 AT transition, 1 AT transversion, 1GC transition, 1GC transversion) and 7
were missing a specific exon from their cDNA (4 lost exon 4, 2 lost exon 6, 1 lost exon 5).
Results of DGGE Analysis
Of 77 mutants analyzed, 13 mutants in exon 3 have been sequenced from mice
exposed to 1,3-butadiene via inhalation (Figure 3.4). Of the 7 base pair substitution
mutations detected, 4 were transitions ( 3 AT>GC, 1 TA>CG) and 3 were transversions (2
TA>GC, 1 TA>AT). All were either transitions or transversions at AT sites. A +G frameshift
(+G, 207-212) present in a run of 6 guanines was observed in four separate mice exposed
to gaseous 1,3-butadiene. A -T frameshift (base 216) and a +A frameshift in a run of three
adenines were also found.In mice exposed to 1,2-epoxybutene via i.p. injection, 26 exon 3 mutants have been
sequenced (Figure 3.5) from 276 total mutants analyzed. Twelve of these mutants were
base pair substitutions, while 14 were frameshift mutations. Of the 12 base pair
substitutions, 8 were transversions ( 6 GC>TA, 1 GC>CG, 1 AT>CG) and 4 were transition
mutations (1 AT>GC, 1 CG>TA, 2 GC>AT). Therefore, of these 12 base pair substitutions,
one was an AT transition and one an AT transversion, and the rest were transitions andtransversions at GC sites. The same+G frameshift (bases 207-212) seen in
butadiene-exposed mice was also detected in four separate mice butadiene-exposed to EB. Six separate mice
also yielded the same -C frameshift (bases 231-232).Diepoxybutane-treated mice yielded 205 mutants for analysis, 11 of which reside in
exon 3 of hprt (5.4%). Sequencing revealed that 4 were base pair substitutions, while 7
were frameshift mutations (Figure 3.6). Of the base pair substitutions, 3 were GC>AT
transitions and 1 was a transversion (AT>TA). The putative "hotspot" +G frameshift
(207-212) was observed in two separate mice exposed to DEB. A -A(140) frameshift and a +T
(294) were also seen. The deletion of 4 bases (-CCAT, 273-276) was detected in a single
mouse.
DISCUSSION
Previous work examining induction of mutation at the tk locus of TK6 cells implied
that EB and DEB are capable of producing large deletions in DNA. 11.4% of EB mutants
exhibited Southern blot detectable alterations, compared to 53.8% of the DEB induced
mutants which suffered deletions. The ability of DEB to induce large deletions is likely to be
related to its ability to react as a bifunctional crosslinking agent (Lawley and Brookes,
1963). Deletions would be a likely outcome of DNA-DNA or DNA/protein crosslinking.
Approximately one-third of spontaneously arising mutations in human TK6 cells in
vitro result from Southern blot-detectable deletions (Liber et al, 1987). The EB and DEB
mutants analyzed in this study were isolated from cultures with fiprt- frequencies
approximately 6-fold above background (spontaneous) levels. Therefore, of the 35 EB
mutants analyzed, 5 could be of spontaneous origin, with the expected occurrence of 1.7
spontaneous deletions. Similarly for DEB, 5.6 mutants could have arisen spontaneously,
containing 1.8 expected deletion mutants. Thus, the contribution of spontaneous deletion
events should not significantly affect the induced patterns of deletions seen here.
Preliminary cDNA analysis of EB-induced TK6 mutants revealed several different
types of mutations. The mutants exhibiting single exon loss probably result from a mutation
at a splice site, which led to incorrect mRNA splicing. Results from a recently developed
computerized hprt database (Cariello et al, 1993) show that of 50 cases where the cause of
aberant splicing was determined, only 3 resulted from genomic deletions. 84% of the time
splicing resulted from a single base mutation, frameshift, or tandem mutation in the intron
within 5 bases of the intron/exon boundary. Exon 4 was most frequently deleted from the
cDNA. In general, point mutations near intron/exon boundaries caused most of the incorrect
mRNA splicing and resultant single exon loss from the cDNA.Analysis of the mutational spectrum of 1,3-butadiene, 1,2-epoxybutene, and
diepoxybutane in vivo revealed several kinds of hprt mutations including frameshifts and
base substitutions at both GC and AT base pairs. Mice were analyzed individually so that in
vivo clonal expansion of a mutant clone in a single animal (probably as in the GC
transversion at base 157 seen in animal #34) was distinguishable from a genuine
mutagenic "hotspot" observed in several animals. Notably, a +G frameshift mutation in a run
of 6 guanines was observed in 4 mice exposed to 1,3-butadiene, 4 mice exposed to EB,
and 2 mice exposed to DEB. Therefore, this +G (207-212) is a putative "hotspot" for
1,3-butadiene-induced mutation. Analysis from the hprt database has also shown that this run
of six guanines is a base pair substitution hotspot for a number of mutagens, as well as a
hotspot for single base frameshift mutations. Recent in vivo studies with ethylene oxide in
B6C3F1 mice (Walker and Skopek, 1993) showed the same +G hotspot observed multiple
times In several animals.
Base pair substitution mutations from mice exposed to 1,3-butadiene were located
solely at AT base pairs (5 out of 5 sites). Conversely, in EB exposed mice 5 of the 7 sites
at which point mutations were detected were GC sites. DEB treatment resulted in base pair
changes at both AT and GC sites. This apparent discrepancy may be explained by the
small sample number of 1,3-butadiene-mutants examined (13) compared to
epoxybutene (26). Twice as many EB-induced exon 3 mutants have been analyzed as for
1,3-butadiene. Therefore, the mutational spectrum of 1,3-butadiene may expand as more
mutants are sequenced. However, the occurrence of mutations at AT base pairs does
indicate a need for further studies of adduct formation with adenine or thymine.
The mouse T-cell cloning/sequencing assay represents a useful system for studying
the mechanisms of chemically-induced mutation in a native transcribed gene. Further
mutational spectum analysis in B6C3F1 mice may be necessary to unambiguously
determine which metabolite(s) of 1,3-butadiene are involved in its mutagenesis. Species
differences in the formation of these metabolites in vivo will then need to be consideredbefore extrapolating exposure levels from laboratory animals to humans, l-lprt mutations in
B6C3F1 mice may also provide evidence for selecting the most appropriate DNA adduct(s)
for monitoring of people who are occupationally or environmentally exposed to
1,3-butadiene.
^ ^^ e s s
u ^ti>Arl
f%
m
m!k
^...^hgl&'Mi^.