ARTIGO ORIGINAL
Vitamin D Insufficiency in a Hospital
Population: A Photograph from the
Laboratory Perspective
Carência de Vitamina D numa População Hospitalar: Uma Fotografia pela
Perspetiva Laboratorial
* Co-primeiro autor.
1. Serviço de Endocrinologia. Hospital de Braga. Braga. Portugal. 2. Serviço de Patologia Clínica. Hospital de Braga. Braga. Portugal. Autor correspondente: Maria Joana Santos. [email protected].
Recebido: 29 de Janeiro de 2015 - Aceite: 08 de Julho de 2015 | Copyright © Ordem dos Médicos 2015
Maria Joana SANTOS*1, Vera FERNANDES*1, Fernando Mota GARCIA2
Acta Med Port 2015 Nov-Dec;28(6):726-734
RESUMO
Introdução: Apesar da hipovitaminose D ser cada vez mais reconhecida em todo o mundo, existem poucos estudos sobre a realidade portuguesa. Este trabalho pretende analisar o nível de vitamina D nos doseamentos realizados no nosso hospital e sua relação com idade, sexo, especialidade requisitante e momento da colheita.
Material e Métodos: Estudo observacional dos doseamentos de 25(OH)D realizados no nosso Hospital entre junho de 2012 e no-vembro de 2014. Variáveis estudadas: sexo, idade, especialidade requisitante, mês de colheita. O status de vitamina D foi classificado como: ‘Deficiência’ (≤ 20 ng/mL), ‘Insuficiência’ (21 – 29 ng/mL) e ‘Suficiência’ (≥ 30 ng/mL).
Resultados: Incluímos 5 439 doseamentos; 55,0% pertenciam a mulheres; a idade mediana foi 64,0 anos. Sessenta por cento apresentavam ‘Deficiência’, 20,7% ‘Insuficiência’ e 18,9% ‘Suficiência’. Encontrámos uma correlação negativa entre idade e nível de vitamina D (p < 0,001), não havendo diferenças significativas entre sexos. Nove especialidades requisitaram 98% dos doseamentos, destacando-se a Nefrologia (56,2%). Encontrámos diferenças entre especialidades requisitantes relativamente à idade e nível de vitamina D (p < 0,001). O nível de vitamina D variou ao longo do ano, com níveis superiores no verão, seguido do outono, primavera e inverno (p < 0,001). Apesar desta variação sazonal, a suficiência de vitamina D foi sempre minoritária, sendo de 27,8% no Verão e 9,2% no Inverno.
Discussão: A carência de vitamina D nesta população é elevada, transversal a todas as idades e não compensada pela variação sazonal da exposição solar.
Conclusão: A hipovitaminose D é um problema real, prevalente e merecedor de atuação na nossa população, atendendo às suas implicações clínicas.
Palavras-chave: Deficiência de Vitamina D; Estações do Ano; Portugal; Vitamina D. ABSTRACT
Introduction: Although vitamin D deficiency is increasingly recognized around the world, there are few studies on the Portuguese reality. This study aims to analyse vitamin D levels in the assays performed in our hospital and their relationship with age, genre, requesting specialty and moment of sample collection.
Material and Methods: Cross-sectional study of measurements of 25(HO)D performed in our Hospital between June 2012 and November 2014. Included variables: gender, age, requesting specialty, month of sample collection. Vitamin D status classified as: ‘Deficiency’ (≤ 20 ng/mL), ‘Insufficiency’ (21 - 29 ng/ml) and ‘Sufficiency’ (≥ 30 ng/mL).
Results: We included 5 439 assays; 55.0% from women; the median age was 64.0 years. Sixty per cent had ‘Deficiency’, 20.7% ‘Insufficiency’ and 18.9% ‘Sufficiency’. We found a negative correlation between age and vitamin D level (p < 0.001). We didn’t find differences in vitamin D levels between genres. Nine specialties requested 98% of the assays, namely Nephrology (56.2%). We found differences between specialties based on age and vitamin D level (p < 0.001). Vitamin D levels changed throughout the year, with higher levels in the summer, followed by autumn, spring and winter (p < 0.001). Despite this seasonal fluctuation, vitamin D sufficiency was only present in a minority of assays (27.8% in summer and 9.2% in winter).
Discussion: Vitamin D deficiency is prevalent in this population, affects individuals of all ages and is not offset by the seasonal variation of sunlight.
Conclusion: Vitamin D deficiency is a real and prevalent problem in our population that needs further attention and action, given its clinical implications.
Keywords: Portugal; Seasons; Vitamin D; Vitamin D Deficiency.
INTRODUCTION
Vitamin D refers to a fat-soluble hormone obtained mainly from diet and sunlight-mediated production in the skin;1 the 7-dehydrocholesterol, a cholesterol derivative and
a precursor to vitamin D, is produced in the skin through a reaction triggered by ultraviolet irradiation. The metabolites are subsequently submitted to two hydroxylation reactions, the first one in the liver, producing the 25(OH)D and the second one in the kidney producing the metabolically active
1,25(OH)2D hormone or calcitriol.1,2 This has a crucial role
in the regulation of calcium and phosphate homeostasis, together with PTH. Vitamin D is responsible for calcium intestinal absorption and calcium and phosphate kidney resorption and is also crucial for bone mineralisation.3
ARTIGO ORIGINAL
four to six-week period, making it suitable for an estimation of vitamin D reserves.4,5
Vitamin D ‘deficiency’ is defined at a 25(OH)D level ≤ 20 ng/mL, ‘insufficiency’ at 21 - 29 ng/mL and sufficiency at 30 – 100 ng/mL.5 Even though the minimum threshold
of vitamin D for optimal health is not consensual, a level of vitamin D over 30 ng/mL was not shown to be associated to any further benefit and some authors consider that levels of vitamin D over 50 ng/mL may be associated to potentially adverse effects.5-7 However, vitamin D intoxication is a rare
event and generally occurs at levels > 150 ng/mL.3,5
Vitamin D deficiency is globally prevalent and approximately 1 billion people are estimated to be affected.6
All age groups in the Western countries, in Asia and in the Middle East are affected and has been gradually increasing.6,8-10 Hypovitaminosis D is even highly prevalent
in urban populations in the tropical countries.4
There are no epidemiological studies in Portugal on the prevalence of inadequate levels of vitamin D. However, different European studies found relevant prevalence of vitamin D deficiency and Portugal is expected to have a similar reality.11
Therefore, considering the significant and increasing prevalence of vitamin D deficiency and its clinical implications, this is currently a relevant public health concern and its identification is crucial as there is a specific therapeutic approach with pharmacologic supplementation. Our study aimed to obtain and to analyse the vitamin D measurements carried out in our hospital and its latest evolution, the relationship between the vitamin D level and patient’s age and gender, as well as the requesting medical specialty and moment of blood sampling (pattern of seasonal variation).
MATERIAL AND METHODS
This was an observational study of all 25(OH)D measurements carried out at the Department of Clinical Pathology between 26 June 2012 and 13 November 2014 (from the time when computerized laboratory test requests were available).
The following variables were assessed for each test: file number; patient’s gender and age; blood sample date and requesting specialty.
Electrochemiluminiscence technology was used for 25(OH)D measurement (using a Liaison® (Diasorin)
equipment) and 30-100 ng/mL were used as reference values. Each sample was ranked into three groups, according to the serum 25(OH)D levels: deficiency (≤ 20 ng/mL), insufficiency (21 - 29 ng/mL) and sufficiency (≥ 30 ng/mL).5
The clinical record number was used for the identification of tests from the same patient and to obtain the number of measurements from each patient.
Sample dates were organized per months, semesters and seasons of the year and months were distributed by seasons as follows: winter (January to March); spring (April to June); summer (July to September) and autumn (October
to December).
IBM® SPSS®Statistics v. 21 software was used for the
statistical analysis. Median, the 25th and 75th percentiles,
minimum and maximum values were obtained for continuous variables and frequency and percentage for categorical variables. Pearson’s χ2-test was used for the inferential
analysis of the association between two qualitative variables and Mann-Whitney and Kruskal-Wallis non-parametric tests were used for the comparison between one qualitative and one quantitative variable, the latter showing a non-normal distribution. The results were considered as statistically significant for p-values <0.05.
Ethical and deontological principles were ensured as regards best practice in data collection and statistical analysis. The research protocol was approved by the Ethics Committee of the Hospital de Braga, complying with the Helsinki declaration.
RESULTS
Characteristics of study sample
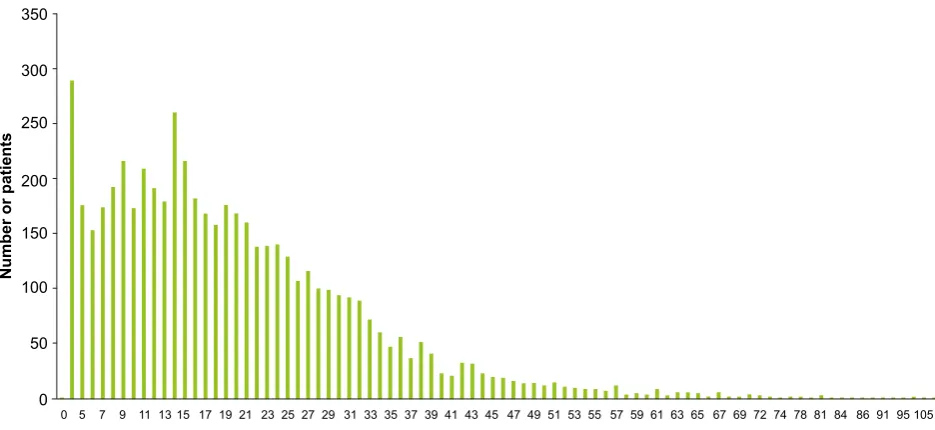
In total, 5,456 vitamin D measurements were carried out over the study period, based on different Departments in our hospital (inpatient, day-hospital, outpatient and Emergency [A&E]). From these, 17 were excluded from the study as they were used for quality control. A final study sample was obtained, with 5,439 measurements, corresponding to 3,257 different patients. Most patients (2,016; 61.9%) had only one measurement; 678 (20.8%) had two; 331 (10.2%) had three; 149 (4.6%) had four. The remaining 83 patients (2.5%) had five or more measurements.
From the 5,439 tests, 2,447 (45.0%) corresponded to male patients. A median 64 years of age was obtained, with a 46.0-76.0 interquartile range (IQR), varying from 0 to 99 years of age; 1.9% of the tests regarded patients aged under 19; 13.9% regarded patients aged 20-39; 26.5% regarded patients aged 40-59 and 57.6% regarded patients aged over 60.
Evolution of the number of measurements
The number of vitamin D tests increased around ten times over the study period, from 35 monthly requests in June 2012 to 368 in October 2014. The number of tests per semester progressively increased: June to November 2012: 259; December 2012 to May 2013: 736; June to November 2013: 1,195; December 2013 to May 2014: 1,555; June to November 2014: 1,694. A percentage increase between consecutive semesters of 184.2%, 62.4%, 30.1% and 8.9%, respectively, was found. The number of measurements did not show any significant variation along the seasons of the year and 20.9% were carried out in winter months, 24.4% in spring, 29.0% in summer and 25.6 in autumn (p > 0.05).
Vitamin D
ARTIGO ORIGINAL (60.3%) tests showed the presence of deficiency, 1,128 (20.7%) of insufficiency and 1,030 (18.9%) of sufficiency.
A statistically significant negative correlation was found between patient’s age and vitamin D absolute value, i.e. the higher the patient’s age, the lower the vitamin D level (p
< 0.001; r = -0.054). Similarly, vitamin D status was also different according to patient’s age (p < 0.001) (Fig. 2). Vitamin D level was not significantly different between genders (male - Med 17.0, IQR 11.0 – 27.0 vs. female - Med 17.0, IQR 10.0 – 26.0) (p > 0.05). Similarly, male/female vitamin D deficiency (44.4% / 55.6%), insufficiency (44.6% / 55.4%) and sufficiency (47.4% / 52.6%) distribution was not significantly different (p > 0.05).
Requesting specialties
As regards medical specialties that have requested vitamin D testing, we found that nine specialties were responsible for 98% of all requests. The distribution per specialty was as follows: Renal Medicine (3,045; 56.2%); Endocrinology & Diabetes (439; 8.1%); General Internal Medicine (436; 8.0%); General Surgery (429; 7.9%); Gastroenterology (324; 6.0%); Rheumatology (264; 4.9%); Multidisciplinary Outpatient for Obesity (MOO) (213; 3.9%); Neurology (104; 1.9%); Paediatrics (58; 1.1%); Other (108; 2.0%).
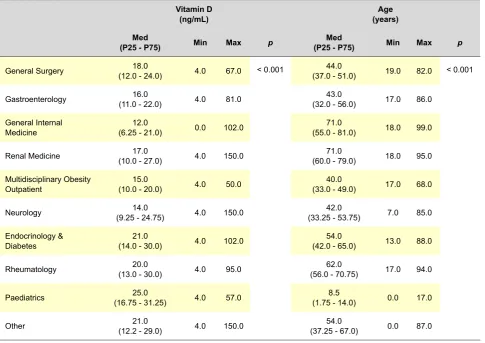
Significant differences regarding patient’s age and the level of vitamin D were found between specialties (Table 1). ‘Paediatrics’ and ‘Other’ categories were excluded from the statistical analysis regarding patient’s age. Statistically significant differences were found between all the remaining categories (p < 0.05) except between MOO, Gastroenterology, General Surgery and Neurology as well as between General Internal Medicine and Renal Medicine. Therefore, General Internal Medicine and Renal Medicine showed a
significantly higher median age than the other specialties, while Gastroenterology, General Surgery, Neurology and MOO had the youngest patients (p < 0.05).
When the category ‘Others’ was excluded from the comparison between specialties, due to the fact of being a category with a heterogeneous composition, statistically significant differences were found in vitamin D levels between the following specialties: General Internal Medicine versus
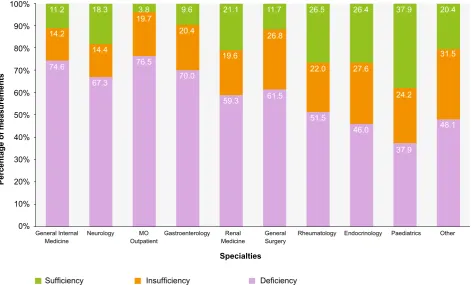
all the others except Neurology and MOO; MOO versus all the others except General Internal Medicine, Neurology and Gastroenterology; Neurology, Gastroenterology, Renal Medicine and General Surgery versus Endocrinology & Diabetes, Rheumatology and Paediatrics. Therefore, we may reach the conclusion that General Internal Medicine showed significantly lower vitamin D levels when compared to almost all the other specialties and that Endocrinology & Diabetes, Rheumatology and Paediatrics showed significantly higher levels when compared to the remaining specialties (p < 0.05). The distribution of significantly different categories of vitamin D status according to medical specialties is shown in Fig. 3 (p < 0.001).
Season of the year
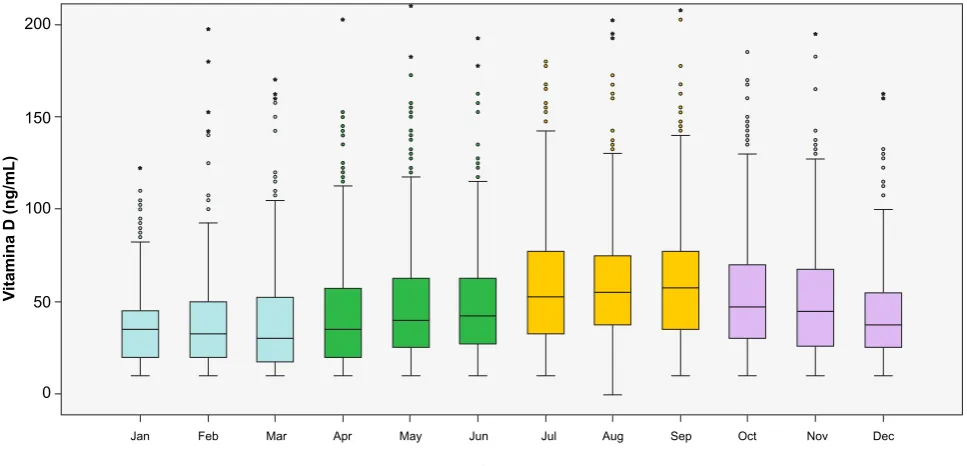
The level of vitamin D significantly varied according to the season of the year (p < 0.001). The highest levels were found in summer months (Median 22.0; IQR 14.0 – 31.0 ng/mL), followed by autumn (Median 18.0; IQR 11.0-27.0 ng/mL), spring (Median 16.0; IQR 10.0 – 25.0 ng/mL) and winter (Median 13.0; IQR 7.0 – 20.0 ng/mL).
As regards the variation according to the months of the year, we found that even within each season, there was a progressive variation, as shown in Fig. 4. March was the month with the lowest level of vitamin D (Median 12.0; IQR 6.5 – 21.0 ng/mL), corresponding to the end of winter and September was the month with the highest level (Median
Figure 1 - Vitamin D (ng/mL) levels
0 5 7 9 11 13 15 171921 23 252729 31 33 35 37 39 41 43 45 47 49 51 53 55 57 596163 65 67697274 78 81 84 86 91 95 105130 0
50 100 150 200 250 300 350
Number or patients
ARTIGO ORIGINAL
Table 1 - Patient’s age (years) and levels of vitamin D (ng/mL) per requesting specialty
Age (years) Vitamin D (ng/mL) p Max Min Med
(P25 - P75)
p
Max Min
Med (P25 - P75)
< 0.001 82.0
19.0 44.0
(37.0 - 51.0) < 0.001
67.0 4.0
18.0 (12.0 - 24.0) General Surgery
86.0 17.0 43.0
(32.0 - 56.0) 81.0
4.0 16.0
(11.0 - 22.0) Gastroenterology
99.0 18.0 71.0
(55.0 - 81.0) 102.0
0.0 12.0
(6.25 - 21.0) General Internal
Medicine
95.0 18.0 71.0
(60.0 - 79.0) 150.0
4.0 17.0
(10.0 - 27.0) Renal Medicine
68.0 17.0 40.0
(33.0 - 49.0) 50.0
4.0 15.0
(10.0 - 20.0) Multidisciplinary Obesity
Outpatient
85.0 7.0 42.0
(33.25 - 53.75) 150.0
4.0 14.0
(9.25 - 24.75) Neurology
88.0 13.0 54.0
(42.0 - 65.0) 102.0
4.0 21.0
(14.0 - 30.0) Endocrinology &
Diabetes
94.0 17.0 62.0
(56.0 - 70.75) 95.0
4.0 20.0
(13.0 - 30.0) Rheumatology
17.0 0.0 8.5
(1.75 - 14.0) 57.0
4.0 25.0
(16.75 - 31.25) Paediatrics
87.0 0.0 54.0
(37.25 - 67.0) 150.0
4.0 21.0
(12.2 - 29.0) Other
Figure 2 - Vitamin D status per age group 0%
10%
< 10 35.0
49.2
58.3 59.0 60.2 59.7 59.3 60.9
64.0
73.0
25.0
23.9
23.9 23.8 25.0 21.9 22.7
18.9 13.9 9.5 40.0 26.9 17.8 17.2 14.8 18.3 18.0 20.2 22.1 17.5
10 - 19 20 - 29 30 - 39 40 - 49 50 - 59 60 - 69 70 - 79 80 - 89 ≥ 90 20% 30% 40% 50% 60% 70% 80% 90% 100% Sufficiency Insufficiency Deficiency
Percentage of patients
ARTIGO ORIGINAL 23.0; IQR 14.0 – 31.0 ng/mL), corresponding to the end of summer. However, even in months with higher levels
of vitamin D, these remained low, showing median levels under the limit that defines sufficiency.
Vitamin D status followed the seasonal variation of vitamin D absolute levels (Fig. 5). This analysis allowed for the identification of statistically significant differences in vitamin D levels on the four seasons of the year (p < 0.001 in all comparisons between seasons). Summer months showed the highest levels of vitamin D, followed by autumn, spring and finally winter. However, despite the improved levels of vitamin D found in months with stronger sunlight exposure, we found that the percentage of patients with sufficiency showed a mild variation between the 4 seasons and this was always minor. The median level of vitamin D did not show any significant variation between seasons of the year in patients with vitamin D sufficiency (winter: Med 36.0; IQR 32.0 – 42.5 ng/mL; spring: Med 37.0; IQR 32.0 – 46.0 ng/mL; summer: Med 37.5; IQR 32.0 – 45.0 ng/mL; autumn: Med 36.0; IQR 32.0 – 44.0 ng/mL) (p > 0.05).
DISCUSSION
A progressive increase in the number of vitamin D measurements was found in our hospital, with different possible explanations. Vitamin D deficiency has been potentially associated to different pathologies, which has raised the attention of the scientific community towards this issue, shown by the increased number of scientific publications in this area as well the increase in the number of measurements and in expenditure with vitamin D supplements in several countries.10 In addition, a significant
increase in the number of staff members occurred at the Department of Renal Medicine in our hospital. The increase of the number of measurements was expected, given the close link between chronic kidney disease and vitamin D deficiency.
We found that at most four vitamin D tests were obtained for 97.5% of our patients. As vitamin D concentrations in patients with deficiency should be monitored 3-4 months after commencing treatment and given the high percentage of patients with inadequate levels, this may be considered as an expected result.12
Vitamin D deficiency was highly prevalent in our population, in line with other studies showing that many countries and all age groups are affected.5 A 19.9 ng/mL
average level of 25(OH)D was found in the North-American population in 2005-2006, showing a 63% deficiency in Hispanics and 82% in Afro-Americans.10 It is estimated that
30-50% of the population has vitamin D deficiency, even in regions of high sunlight exposure.6 There are no studies
on the levels of vitamin D in the Portuguese population and only studies with specific populations exist. One study with patients admitted to a Department of General Internal Medicine found a 92.7% deficiency.13 This high prevalence
may be due to the fact that this study was confined to the months of April and May, only involving high-functioning polymedicated elderly inpatients with multiple comorbidities. Another study involving inpatients with a stress fracture to the wrist, between June and October, with or without vitamin D supplementation, found a 26.2% prevalence of vitamin D sufficiency, 45.2% insufficiency and 28.6% deficiency.14
A more recent Portuguese study, similar to ours, found
Figure 3 - Vitamin D status per requesting specialty 0%
10%
General Internal Medicine
74.6
67.3
76.5
70.0
59.3 61.5
51.5
46.0
37.9
48.1 14.2
14.4
19.7
20.4
19.6
26.8
22.0 27.6
24.2
31.5 11.2 18.3 3.8 9.6 21.1 11.7 26.5 26.4 37.9 20.4
Neurology MO
Outpatient Gastroenterology MedicineRenal General Surgery Endocrinology Paediatrics Other 20%
30% 40% 50% 60% 70% 80% 90% 100%
Sufficiency Insufficiency Deficiency
Percentage of measurements
Specialties
ARTIGO ORIGINAL
Figure 4 - Vitamin D level (ng/mL) variation along 12 months
prevalence of insufficiency and deficiency similar to those that we described. This study involved 2,071 vitamin D measurements between September and December 2010: 88.1% showed levels < 30 ng/mL and 65% < 20 ng/mL.15
The high vitamin D deficiency observed in the 21st
century is mainly related to the decreased production of vitamin D in the skin, associated to lifestyle of urban populations. Sunlight exposure is the major source of vitamin D in humans (influenced by latitude, exposure time, hour of the day and season of the year), which has been strongly reduced as most people spend the day indoors.4,5 The use of sunscreens that significantly reduce
the absorption of UVB radiation (≥95% reduction with sun protection factor - SPF30) also contributes to deficiency.5,6
The decreased bioavailability of vitamin D found in fat mal-absorption, obesity, poor intake of vitamin D-supplemented food or rich in vitamin D and exclusive breastfeeding also leads to vitamin D deficiency.5,6 The risk is higher in Europe
and in Portugal, where vitamin D-supplemented food is scarce.5,6 A 70.5% inadequate intake of vitamin D was found
in women aged under 30 and 96.0% in women aged 60-69, increasing with age, from a group of adult female living in Porto.16 In addition, the increased metabolism of vitamin
D caused by some drugs (antiepileptic, antiretroviral, steroids) or associated to chronic granulomatous disorders (tuberculosis, sarcoidosis), as well as to the decreased synthesis of 25(OH)D (severe liver failure), the increased loss of 25(OH)D (nephrotic syndrome) and decreased synthesis of 1,25(OH)2D (stage 4 and 5 chronic kidney disease) also lead to vitamin D deficiency.5,6
Some of our patients showed levels of vitamin D over 100 ng/mL. Different studies found that very high levels of vitamin D do not produce any additional benefits and are associated to cardiovascular disease, falls, frailty status,
pancreatic carcinoma and an increase in overall mortality.7
The levels of vitamin D should be maintained under < 100 ng/mL, as levels > 150 ng/mL involve the risk of hypercalcaemia.5
We found in our population that older patients had lower levels of vitamin D. Several studies confirmed the high prevalence of vitamin D deficiency in the elderly. An European study carried out in the eighties found that 36% of male and 47% of female elderly patients had vitamin D deficiency, which was more severe in the Southern European countries.4 More recent studies found a 40-100%
prevalence of vitamin D deficiency in elderly American and European community-living patients.5,6,9 Although vitamin D
deficiency affects all ages, the elderly show a higher risk, due to lower involvement in outdoor activities, food intake, intestinal absorption and vitamin D synthesis in the skin.4,5,9
This is even more severe in institutionalised patients.17
Several observational studies found an association between the serum levels of vitamin D (mainly < 20 ng/mL) and the propensity to falls and fractures.3,17 Vitamin D deficiency is
potentially more severe in elderly patients as it may affect their functional independence.4
Despite more adequate levels of vitamin D were found in children, sufficiency in this age group was just 37.9%. International and national studies confirmed the low prevalence of vitamin D sufficiency in young people. An American study found a 48% prevalence of vitamin D deficiency in pre-adolescent white female patients.5
A German study found an 87% prevalence in more than 10,000 children and adolescents.9 Two Portuguese studies
found disappointing results. In one study involving 122 children aged 5-18, 92.5% showed vitamin D insufficiency, from which 40% showed deficiency.18 One other study with
73 children showed levels of vitamin D sufficiency in <20%
Jan Feb Mar Apr May Jun Jul Aug Sep Oct Nov Dec
0 50 100 150 200
Vitamina D (ng/mL)
ARTIGO ORIGINAL
and 30.9% had deficiency and 42.5% insufficiency. This study also confirmed that schoolchildren had worse levels of vitamin D when compared to younger children.19
As expected, no significant gender differences were found in our population, as vitamin D production does not relate to this variable, as described in other studies.13
Screening of vitamin D deficiency is not recommended in general population and should be reserved for high-risk deficiency situations.5 We found in our study that the nine
leading specialties for 21(OH)D measurement requests correspond to the major subgroups of patients in higher risk for vitamin D deficiency, such as Renal Medicine, Endocrinology & Diabetes, Gastroenterology and MOO.6
As expected, statistically significant differences between requesting specialties were found regarding patient’s age. General Internal Medicine and Renal Medicine showed the oldest patients, reflecting the more prevalent pathology in these specialties.
Significant differences between requesting specialties were found regarding the levels of vitamin D. General Internal Medicine showed significantly lower levels of vitamin D, probably reflecting patients aged greater. However, it did not occur in Renal Medicine where patients, despite their age, present with a better vitamin D status, probably reflecting a better approach to vitamin D deficiency. Paediatrics, Endocrinology & Diabetes and Rheumatology showed the best results. In Paediatrics, this probably reflects the lower age group and a more active attitude towards treatment. It is expected a special concern towards this problem in Endocrinology & Diabetes and in Rheumatology due to
skeletal and metabolic consequences. Renal Medicine would also be included into the same category, even though its worst results could be explained by the fact that this was a specialty more recently introduced to our hospital. The remaining specialties had an intermediate performance, with inadequate vitamin D levels, namely in populations at risk for vitamin D deficiency. An inverse relationship between BMI ≥ 30 Kg/m2 and serum levels of 25(OH)D is
known to exist in MOO patients.5 Obese patients have in
general levels of vitamin D ranging between 10 - 20 ng/mL, probably not only due to sequestration in adipose tissue, but also due to lower physical activity and sunlight exposure than normal-weight patients.3 Despite these differences
between specialties, the levels of vitamin D were globally low and far from an optimum value.6
Despite no significant variation has been found regarding the date of sampling, we found significant differences in levels of 25(OH)D between the seasons of the year, with higher levels in summer, followed by autumn, spring and winter. The levels obtained in the autumn probably reflect sunlight exposure in summer, reaching a maximum level around 30 - 60 days after the peak of sunlight exposure in summer months.20 There was a progressive evolution of the
levels of vitamin D according to seasonal intensity of sunlight within each season. It is known that seasonal variation of sunlight is approximately 20% from summer to winter in the northern hemisphere and that the more efficient sunlight for the production of vitamin D occurs between 10:00 and 15:00 h in spring, summer and in autumn, making the risk/ benefit relationship between the risk of skin cancer and the
Figure 5 - Vitamin D status per season of the year 0%
10%
Winter 76.8
65.1
45.5
59.2 14.0
17.2
26.7
22.8 9.2 17.7 27.8 18.0
Spring Summer Autumn
20% 30% 40% 50% 60% 70% 80% 90% 100%
Sufficiency
Insufficiency
Deficiency
Percentage of measurements
ARTIGO ORIGINAL
production of vitamin D a problem in debate.5,21
In all seasons, the median vitamin D level was under the limit for sufficiency, even in a country with high sunlight exposure. As already described, different factors associated to lifestyle may explain for it. We found a 69.2% increase in patients with vitamin D deficiency from summer to winter. An adequate sunlight exposure in months with higher sunlight intensity may allow for adequate levels of vitamin D to be obtained, which are stored into the adipose tissue and released in winter, a time when the production of vitamin D is less efficient.6 However, we hypothesized that
patients with vitamin D sufficiency in months with higher sunlight exposure showed borderline levels of sufficiency, with reserves unable to maintain the levels of vitamin D in months with lower sunlight exposure. In fact, we found that the levels of vitamin D in patients with sufficiency in the different seasons of the year did not significantly vary and that their median level was borderline. Therefore, we may reach the conclusion that even patients with vitamin D sufficiency showed low reserves, reducing the availability of vitamin for the months with lower sunlight exposure.
Strengths and limitations
Our study involved a high number of vitamin D measurements over a long study period and allowed for a better knowledge of vitamin D status in patients attending our hospital. However, the fact that it has been carried out in a single hospital prevents from the generalisation of results. In addition, the limitations of an observational and retrospective study were also present. Finally, the absence of data regarding variables not related to vitamin D status, namely ethnicity, comorbidities, functional index, nutritional habits and status, number of hours of daily sunlight exposure, body mass index, current or recent replacement treatment and usual medication, did not allow for a more reliable explanation for some data that were found.
CONCLUSION
We have shown with this study that vitamin D deficiency is highly prevalent in recent measurements of vitamin D in our hospital. Despite a significantly variation in vitamin D levels throughout the different seasons of the year, in a close relation with the number of seasonal sunlight hours and intensity, levels fell short from what is required, even in summer. Vitamin D reserves in patients with sufficiency seem minor, considering the increased percentage of patients with deficiency in winter. We consider that these results show a vitamin D status of deficiency in need for action, considering the outcomes. We hope that the recognition of this issue may allow for an improvement in further healthcare to our patients.
HUMAN AND ANIMAL PROTECTION
The study was approved by the Ethics Research Committee of the Hospital de Braga, complying with the Helsinki declaration.
DATA CONFIDENTIALITY
The authors declare that they have followed the protocols of their work centre on the publication of patient data.
CONFLICTS OF INTEREST
The authors declare that there were no conflicts of interest in writing this manuscript.
FINANCIAL SUPPORT
The authors declare that there was no financial support in writing this manuscript.
REFERENCES
1. Bringhurst FR, Demay MB, Kronenberg HM. Hormones and disorders of mineral metabolism. In: Melmed S, Polonsky KS, Larsen PR, Kronenberg HM, editors. Williams textbook of endocrinology. Philadelphia: Elsevier Saunders; 2011. p. 1237-304.
2. Shoback D, Sellmaeyer D, Bikle DD. Metabolic bone disease. In: Gardner DG, Shoback D, editors. Greenspan’s basic & clinical endocrinology. New York: The McGraw-Hill; 2011. p. 227-84.
3. Rosen CJ. Vitamin D insufficiency. N Eng J Med. 2011;364:248-54. 4. Boucher BJ. The problems of vitamin D insufficiency in older people.
Aging Dis. 2012;3:313-29.
5. Holick MF, Binkley NC, Bischoff-Ferrari HA, Gordon CM, Hanley DA, Heaney RP, et al. Evaluation, treatment, and prevention of vitamin D deficiency: an Endocrine Society Clinical Practice Guideline. J Clin Endocrinol Metab. 2011;96:1911-30.
6. Holick MF. Vitamin D deficiency. N Eng J Med. 2007;357:266-81. 7. Ross AC, Manson JE, Abrams SA, Aloia JF, Brannon PM, Clinton SK, et
al. The 2011 report on dietary reference intakes for calcium and vitamin D from the Institute of Medicine: what clinicians need to know. J Clin Endocrinol Metab. 2011;96:53-8.
8. Girgis CM, Clifton-Bligh RJ, Hamrick MW, Holick MF, Gunton JE. The roles of vitamin D in skeletal muscle: form, function, and metabolism. Endocr Rev. 2013;34:33-83.
9. Domarus CV, Dipl-Ing JB, Barvencik F, Amling M, Pogoda P. How much vitamin D do we need for skeletal health? Clin Orthop Relat Res. 2011;469:3127-33.
10. Engelman CD. Vitamin D recommendations: the saga continues. J Clin Endocrinol Metab. 2011;96:3065-6.
11. Pisco L, Barros H, Mascarenhas M, Carvalheiro M, Cantista P, Laíns J, et al. Declaração Portuguesa da Vitamina D. 2009; [consultado 2015 jan 02]. Disponível em: http://www.spmi.pt/pdf/Declaracao_Port_ VitD_2009_final.pdf.
12. Dawson-Hughes B. Vitamin D deficiency in adults: Definition, clinical manifestations, and treatment. Uptodate. 2014; [consultado 2015 jan 03]. Disponível em: http://www.uptodate.com/contents/vitamin-d-deficiency-in-adults-definition-clinical-manifestations-and-treatment? source=machineLearning&search=deficency+vitamin+d&selectedTit le=1~150§ionRank=1&anchor=H7#H2.
13. Santiago T, Rebelo M, Porto J, Silva N, Vieira J, Nascimento Costa JM. Hipovitaminose D em doentes internados num Serviço de Medicina Interna. Acta Med Port. 2012;25:68-76.
14. Silva L, Freitas J, Sampaio L, Terroso G, Pinto JM, Veludo V, et al. Níveis séricos de vitamina D em portugueses com fracturas de fragilidade. Acta Reumatol Port. 2010;35:352-7.
15. Alves M, Bastos M, Leitão F, Marques G, Ribeiro G, Carrilho F. Vitamina D – importância da avaliação laboratorial. Rev Port Endocrinol Diabetes Metab. 2013;8:32-9.
16. Lucas R, Costa L, Barros H. Ingestão de cálcio e vitamina D numa amostra urbana de mulheres Portuguesas. Arq Med. 2005;19:7-14. 17. Rosen CJ, Adams JS, Bikle DD, Black DM, Demay MB, Manson JE, et
ARTIGO ORIGINAL
statement. Endocr Rev. 2012;33:456-92.
18. Ferreira S, Nascimento S, Barros C, Tomada I, Carreiro E, Rêgo C. Status de vitamina D e de mineralização óssea em crianças e adolescentes residentes na cidade do Porto. Rev SPCNA. 2012;18:54. 19. Rocha A. Avaliação do estado de Vitamina D numa população pediátrica
do grande Porto. [Dissertação de Mestrado]. Porto: Instituto de Ciências Biomédicas Abel Salazar; 2012. [consultado 2015 jan 03]. Disponível
em: http://hdl.handle.net/10216/62189.
20. Adams JS, Hewison M. Update in vitamin D. J Clin Endocrinol Metab. 2010;95:471-8.