Longitudinal Associations Among Popularity, Likeability, and Drinking Across the Adolescent Transition:
A Multivariate Latent Growth Curve Analysis
Sophia C. Choukas-Bradley
University of North Carolina at Chapel Hill
A thesis submitted to the faculty of the University of North Carolina at Chapel Hill in partial fulfillment of the requirements for the degree of Master of Arts in the Department of Psychology (Clinical)
Chapel Hill 2011
ABSTRACT
SOPHIA C. CHOUKAS-BRADLEY: Longitudinal Associations Among Popularity, Likeability, and Drinking Across the Adolescent Transition: A Multivariate Latent
Growth Curve Analysis
(Under the direction of Mitch Prinstein, Ph.D.)
iii
TABLE OF CONTENTS
LIST OF TABLES ... iv
I. INTRODUCTION ... 1
II. METHOD ... 11
Participants ... 11
Measures ... 12
Data Analytic Plan ... .. ... 13
III. RESULTS ... 17
Preliminary Analyses ... 17
Course of Alcohol Use and Moderate Episodic Drinking Over Time ... 17
Baseline Likeability and Popularity as Predictors of Drinking Trajectories ... 22
IV. DISCUSSION ... 26
LIST OF TABLES
Table
1. Means (and Standard Deviations) for Primary Variables
at Time 1 - Time 3.………47 2. Bivariate Associations Among Primary Variables………48 3. Longitudinal Prediction of Alcohol Use Trajectories by Popularity, Likeability,
and the Interaction between Popularity and Likeability (n = 165)………49 4. Longitudinal Prediction of Moderate Episodic Drinking Trajectories by
Popularity, Likeability, and the Interaction between Popularity
INTRODUCTION
Surprisingly, studies of adolescent alcohol use are only a recent focus of inquiry. A Pubmed search for articles using “alcohol” and “adolescent” in the title and/or abstract yielded 17 hits in 1983 (Matthews, 2010); the same Pubmed search today yields hundreds of articles, and an equivalent search in PsycInfo yields thousands. Most research has begun to look at risk factors, including the social contexts and processes associated with adolescent alcohol use. The peer context has been highlighted as perhaps the strongest predictor of substance use among adolescents (e.g., Chassin, Hussong, & Beltran, 2009). Peer factors, such as friends’ drinking behaviors and perceptions of peer attitudes and social norms regarding alcohol, are consistently found to be strong predictors of
adolescent alcohol use (see Borsari & Carey, 2001, 2003). Such peer factors appear to be more strongly related to adolescents’ drinking behaviors than are parental factors (Beal, Ausiello, & Perrin, 2001; Cumsille, Sayer, & Graham, 2000; D'Amico et al., 2001).
3
motivation to engage in behaviors that will earn adult approval (Juvonen & Murdock, 1995). Indeed, research suggests that an adolescent’s drinking behaviors may be influenced by the alcohol use of his/her friends (e.g., Andrews, Tildesley, Hops, & Li, 2002), friend group (e.g., Urberg, Degirmencioglu, & Pilgrim, 1997), and peer “crowd” (e.g., Dolcini & Adler, 1994). Research has also provided evidence of a potential link between alcohol use and high peer status (e.g., “popularity”; Cohen & Prinstein, 2006; Mayeux, Sandstrom, & Cillessen, 2008).
Moffitt’s (1993) theory of the maturity gap provides a theoretical framework that may help explain the high rates of substance use during adolescence. According to her theory, adolescents reach biological maturity with the onset of puberty, but society expects them to delay their adoption of adult social roles until after middle school, high school, and – in many cases – college. Adolescents in the United States are, by law, restricted from driving before roughly age 16, voting before age 18, and drinking before age 21. The five-to-ten-year gap between biological maturity and social maturity creates a “role vacuum” during which the modern teenager is expected to “delay most of the positive aspects of adult life” (Moffitt, 1993, p. 686). During this time, teens may feel eager to engage in substance use and other delinquent activities that symbolize the
independence and maturity for which they feel biologically prepared but from which they are legally and socially restricted (Moffitt, 1993). Indeed, in a qualitative study of
According to Moffitt, it is around the time that adolescents begin to feel the “discomfort” of the maturity gap that they also enter high school, where they come into contact with older students, a “social reference group that has endured the gap for 3 to 4 years and has already perfected some delinquent ways of coping with it” (Moffitt, 1993, p. 687). Social reference groups in the high school setting may play a significant role in influencing other youths’ substance use behaviors (Cohen & Prinstein, 2006). An emerging body of research suggests that one of the strongest social reference groups among adolescents is the group of peers who are considered to be “popular” (Prinstein, Meade, & Cohen, 2003; Cohen & Prinstein, 2006; Mayeux, Sandstrom, & Cillessen, 2008). Preliminary evidence indicates that these high-status adolescents engage in higher levels of alcohol use (e.g., Mayeux et al., 2008), which suggests that other youth may view these behaviors as normative among their popular peers.
5
these behaviors in order to increase their own peer status. Moreover, those who are themselves members of a group associated with substance use (e.g., perhaps, youth with high social status) may feel pressure to conform to the behaviors that are perceived to be the group’s norms. These general ideas have not been stringently examined in the literature, however.
The lack of research examining these fundamental hypotheses may be due to a need for developmentally-sensitive measures of peer status that have been revealed only in very recent years. Specifically, two forms of peer status are now discussed in the literature – likeability (or “social preference”), which is assessed with sociometric nominations of “who do you like the most?” and “who do you like the least?” (Coie & Dodge, 1983); and peer-perceived popularity (or “social reputation”), a construct
prosocial characteristics, but popularity is associated with antisocial characteristics as well (Parkhurst & Hopmeyer, 1998). More specifically, while low levels of likeability are associated with aggression, high levels of popularity have been found to be associated with aggression and dominance, including both overt and relational aggression (Parkhurst & Hopmeyer, 1998; Prinstein & Cillessen, 2003; LaFontana & Cillessen, 2002).
Based on the social norms and social rewards models, in conjunction with Moffitt’s theory of the maturity gap, longitudinal associations between high peer status and alcohol use are hypothesized. These theories suggest that adolescents who are
popular may engage in higher levels of drinking in order to adhere to social norms
associated with drinking and popularity (Cohen, 2003; Gibbons & Gerrard, 1995; Mayeux et al., 2008). More specifically, it is hypothesized that high popularity early in adolescence will be associated with increases in alcohol use over time. Although few studies have examined the longitudinal associations between popularity and drinking, preliminary evidence suggests a potential link. For example, findings suggest that adolescents who identify with stereotypically popular cliques or “crowds” engage in higher levels of alcohol use than their peers (Dolcini & Adler, 1994) and that those who self-report higher levels of popularity also report drinking more frequently (Diego, Field, & Sanders, 2003) and binge drinking more frequently (Pirkle & Richter, 2006) than their peers. Two prior studies of the longitudinal associations between peer-perceived
popularity and alcohol use offer mixed findings (c.f., Mayeux, Sandstrom, & Cillessen,
7
“ever had a drink of alcohol, even just one sip”). Mayeux et al. found that higher popularity in 10th grade predicted increased 12th grade alcohol use, while Lansford et al. found that changes in popularity from 7th to 8th grade did not significantly predict 8th grade alcohol use.
Expected patterns of association between likeability and alcohol use are less clear. Based on links between low childhood likeability, high aggression, and higher rates of adolescent delinquency (e.g., Parker & Asher, 1987), it might be expected that
adolescents lower in likeability will engage in higher levels of alcohol use over time, in comparison to their peers. Researchers have indeed demonstrated that low likeability in childhood is related to increased adolescent substance use in both boys (e.g., Dishion, Capaldi, & Yoerger, 1999) and girls (Prinstein & La Greca, 2004). On the other hand, the majority of these studies have focused on likeability in childhood rather than in adolescence, and the negative relationship between likeability and substance use may not apply during adolescence. Because substance use and other deviant behaviors are
increasingly accepted by peers during adolescence (Moffitt, 1993), the pattern of associations between likeability and alcohol use among adolescents might instead be expected to be similar to that hypothesized for popularity and alcohol use. Under this hypothesis, it would be expected that high likeability early in adolescence will be associated with longitudinal increases in alcohol use. Lending empirical support to this hypothesis, Allen, Porter, McFarland, Marsh, and McElhaney (2005) found that higher likeability at age 13 predicted greater increases in alcohol use by one year later.
examining the growth of alcohol use across more than two time points, and examining how peer status predictors may influence this growth, may illuminate longitudinal associations not captured by regression analyses. Moreover, very few studies have examined peer status and drinking during the transition from middle school to high school, a developmental period highlighted by Moffitt (1993) as highly relevant to the understanding of adolescent delinquency and its relation to social reference groups. The current study examined trajectories across the transition to high school, examining associations among popularity, likeability, and drinking in grades 8, 9, and 10, using standardized peer status scores.
9
study examined longitudinal associations among popularity, likeability, and two alcohol variables – a basic “alcohol use” variable (defined as having one or more drink) and a “moderate episodic drinking” variable (defined as having three or more drinks within a few hours). A measure of moderate episodic drinking was used in place of heavy episodic drinking due to low rates of binge drinking among early adolescent samples (Johnston et al., 2009; SAMHSA, 2009). Although a high correlation between the alcohol use variable and the moderate episodic drinking variable was expected (in part because adolescents who engage in moderate episodic drinking are, by definition, also engaging in alcohol use), it is important to examine the association between peer status and different levels of drinking. Research suggests that experimentation with substance use in adolescence is normative and may even be associated with healthier outcomes than complete abstinence (e.g., Shedler & Block, 1990; Hersh & Hussong, 2006), whereas using alcohol to excess has been found to be associated with a variety of significant negative consequences (e.g., Patrick & Schulenberg, 2010).
the associations between peer status variables and drinking trajectories. However, based on a lack of prior research regarding differential relationships by gender between alcohol use and these measures of peer status, no specific gender differences were hypothesized.
In addition to examining the relationship between baseline popularity and likeability and longitudinal drinking trajectories, an interaction term was computed between likeability and popularity and explored as a potential predictor of alcohol use and moderate episodic drinking. It may be that an adolescent’s level of popularity in 8th grade moderates the relationship between his/her 8th grade likeability and trajectories of drinking, and/or that the initial level of likeability moderates the relationship between baseline popularity and drinking trajectories. However, based on the lack of previous research on the interaction between popularity and likeability, no specific hypotheses were proposed. The following four primary study hypotheses were examined using latent growth curve modeling: (1) higher baseline (i.e., 8th grade) popularity would be
METHOD
Participants
Participants included 165 adolescents (52% girls, 48% boys) in Grade 8 at study onset. All participants were between the ages of 12 and 14 (M = 13.68, SD = .38) at baseline. The ethnic composition of the sample included 87% White/Caucasian, 1% African American, 5% Asian American, 3% Latino American, and 4% mixed ethnic background. At baseline, participants were enrolled at a public middle school in a city of primarily middle-class socioeconomic status in the northeastern United States.
Neighborhood and school records revealed that the average adult per-capita income was approximately $30,220, and 11% of children were eligible for free or reduced-priced lunch.
continue to participate (n = 2), reasons common to this type of research. At Time 3, approximately one year later, a total of 165 participants (94% of Time 2 participants; 86% of Time 1 participants) completed testing. Attrition between Time 2 and Time 3 was due to participants’ moving away from the area (n = 4) or being unavailable for testing (n = 7).
Measures
Sociometric nominations of peer status (i.e., likeability and popularity) were
conducted at Time 1 (i.e., Grade 8). A self-reported instrument of alcohol use and moderate episodic drinking was collected at all three time points (Grades 8, 9, and 10).
Peer status. At Time 1, adolescents were presented with an alphabetized roster of
all grademates, from which they were asked to nominate an unlimited number of peers whom they “like the most” and “like the least” (Coie & Dodge, 1983). The order of alphabetized names on rosters was counterbalanced (i.e., A through Z and Z through A) to control for possible order effects on nominee selection (e.g., Prinstein & Cillessen, 2003). For each participant, the sum of the number of nominations received was standardized, such that each participant received a standardized “like most” and “like least” score. A measure of likeability was then created by calculating the difference between each participant’s standardized “like most” and “like least” scores. These difference scores were then restandardized, with higher scores indicating greater
likeability among peers (Coie & Dodge, 1983). Adolescents also were asked at baseline
13
indicate higher levels of popularity relative to peers. Sociometric nomination procedures are widely accepted as the most reliable and valid measures of peer status (Coie & Dodge, 1983; Parkhurst & Hopmeyer, 1998).
Alcohol use and moderate episodic drinking. Adolescents’ alcohol use and
moderate episodic drinking were assessed at Times 1, 2, and 3, using items adapted from the Youth Risk Behavior Surveillance System (CDC, 1998), as in previous research on adolescent health risk behaviors (e.g., Faden, 2006). Participants were asked to report the number of days, over the past 30 days, on which they had consumed at least one drink of alcohol (“alcohol use”), and the number of days on which they had had three or more drinks on a single occasion, defined as “within a few hours” (“moderate episodic
drinking”). A five-point Likert scale ranged from “0 days” to “10 or more days.” As is
typical in research on adolescents’ substance use, the data were positively skewed for both the alcohol use variable and the moderate episodic drinking variable. Due to the highly skewed nature of both alcohol variables, the alcohol use and moderate episodic drinking variables were transformed using a logarithmic function (Cohen, Cohen, West, & Aiken, 2003).
Data Analytic Plan
Attrition Analyses. Attrition analyses were conducted to compare participants who
without complete data, with the exception that those with incomplete data were lower in likeability, t (189) = 2.28, p = .02.
Descriptive Statistics. Descriptive statistics were conducted to examine the means
and standard deviations on all study variables (i.e., popularity, likeability, alcohol use, moderate episodic drinking) at all three time points. Correlational analyses were also performed between all study variables.
Hypothesis Testing. Using multivariate latent growth curve modeling in AMOS
18.0, all hypotheses were examined using two sets of analyses. In each set of analyses, a growth curve was estimated for one of the two alcohol variables using indicators from the three time points; baseline popularity, likeability, and their interaction term were each tested as predictors of this alcohol trajectory. In one set of analyses, the alcohol variable used was the “alcohol use” variable, and in the second set, “moderate episodic drinking” was examined.
15
For each of the two sets of analyses (i.e., the set using “alcohol use” as the alcohol variable, and the set examining “moderate episodic drinking”), prior to examining
hypotheses, an unconditional model was examined for the alcohol growth curve. Once an adequate fit was achieved for each of the growth curves, conditional models were
examined in a multivariate format to examine each of the study hypotheses (Bollen & Curran, 2006).
To test the hypotheses that higher baseline popularity and higher baseline likeability each would be associated with higher concurrent levels of 8th grade drinking, paths were estimated between popularity and likeability (respectively) and the alcohol intercept. To test the hypotheses that higher baseline popularity and higher baseline likeability would each be associated with increased drinking trajectories over time, paths were estimated between popularity and likeability (respectively) and the alcohol slope. Although no specific hypotheses were proposed for the interaction between popularity and likeability as a predictor, a path was estimated between the interaction and the alcohol intercept, to test whether there was a significant association between baseline drinking and the baseline interaction between popularity and likeability; and an additional path was estimated between the interaction and the alcohol slope, to test whether there was a significant association between the interaction at Time 1 and the growth of drinking over time.
RESULTS
Preliminary Analyses
Means and standard deviations for all primary variables are presented in Table 1. T tests revealed no significant gender differences in primary study variables, with the exception that girls were higher in likeability.
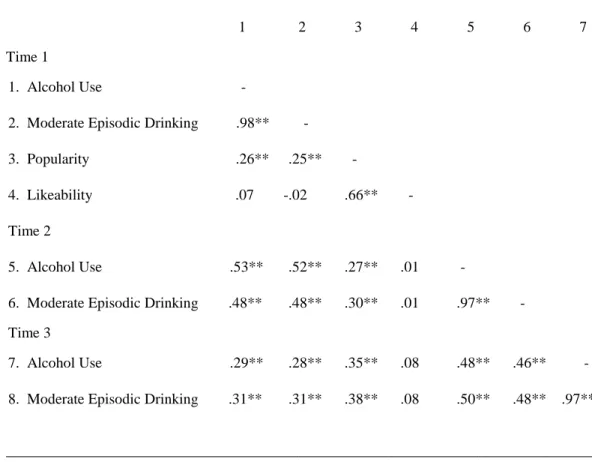
Pearson correlations were conducted to examine bivariate associations among all study variables (see Table 2). At all three time points, results revealed highly significant correlations between alcohol use and moderate episodic drinking. Significant
associations also were revealed between Time 1 popularity and both drinking variables at each time point. No significant correlations were found between Time 1 likeability and either of the drinking variables at any time point. Consistent with past literature, a
significant correlation was found between popularity and likeability at Time 1. Moderate to high levels of stability were revealed for moderate episodic drinking and alcohol use over time.
Course of alcohol use and moderate episodic drinking over time
Prior to examining primary study hypotheses, unconditional models of alcohol use and moderate episodic drinking were examined.
Alcohol use. Analysis of unconditional growth curve models for the alcohol use
index (NFI) = .89; root-mean-square error of approximation (RMSEA) = .24. The poor model fit was attributed to the nonlinear growth of the means over time (see Table 1). As was expected based on theory, different patterns of growth in alcohol use and differences in variability were observed across gender. Additionally, it was anticipated that alcohol use slopes may be nonlinear, given that the transition to high school may be associated with steeper increases in drinking trajectories. Therefore, a multiple group analysis (by gender) was conducted in order to allow for different patterns of growth by gender, and to allow for non-linear growth. Sufficient degrees of freedom were available to test
nonlinear growth by allowing the path from the latent slope to the 9th grade indicator to vary freely (Bollen & Curran, 2006). In examining multiple group models, I first fixed all residual variances, covariances, factor means, and path weights across gender. Model fit improved, but still was inadequate, χ2 (9) = 34.93, p < .001; χ2/df = 3.88; CFI = .78; NFI = .73; RMSEA = .12.
The next step in the analyses was to systematically free individual gender
19
examined. Again, no significant difference in model fit was observed, χ2 (1) = 2.73, p = .10. Next, I examined whether the model fit changed if I freely varied the covariance between the latent factors (i.e., intercept and slope); this model was compared with a model in which the covariance between the latent factors was fixed across gender. Fixing the covariance between the latent factors did not significantly change model fit, χ2 (1) = 3.84, p = .05, indicating that the covariance was comparable for boys and girls, and thus the constraint was retained for parsimony. Last, I tested whether I could freely vary the error variances across the three observed indicators of alcohol use, as well as between and within gender. Results revealed that it was possible to set error variances to be fixed across the three time points for boys, but not for girls. Constraining error variances across the three time points did not significantly change model fit for boys, χ2 (2) = 1.21, p = .55, and thus constraints were retained for parsimony. However, with respect to girls, fixing the residual variances across time significantly worsened model fit, χ2 (2) = 18.66,
p < .001. Therefore, the error variances must be allowed to vary freely across time for
girls, and it was not possible to fix the error variance across gender. The final
unconditional model for alcohol use, using a multiple group analysis (by gender), yielded a good fit, χ2 (5) = 9.22, p = .10; χ2/df = 1.84; CFI = .96; NFI = .93; RMSEA = .07. The model fit indicates that the observed data are comparable to the expected model.
The estimated unstandardized path weight for alcohol use at 9th grade on the slope factor was .10 (p = .12) for boys and .43 (p < .001) for girls. Estimated intercept
was significantly greater than zero (M = .17, p < .001) with significant variability around this mean for both boys (.05, p < .001) and girls (.05, p = .01).
Moderate episodic drinking. As with the alcohol use variable, analysis of
unconditional growth curve models for the moderate episodic drinking variable began with an examination of a single slope model including 8th grade, 9th grade, and 10th grade measures of moderate episodic drinking, collapsed across gender. The model was a poor fit, χ2 (1) = 12.12, p < .001; χ2/df = 12.12; CFI = .88; NFI = .88; RMSEA = .24. The poor model fit was attributed to the nonlinear growth of the means over time (see Table 1). Additionally, as was expected based on theory, and as was the case with the alcohol use variable, different patterns of growth in moderate episodic drinking were observed across gender. Therefore, a multiple group analysis (by gender) was conducted in order to allow for different patterns of growth by gender. In examining multiple group models, I first fixed all residual variances, covariances, latent factor means, and path weights across gender. Model fit was again poor, χ2 (9) = 29.19, p = .001; χ2/df = 3.24; CFI = .79; NFI = .73; RMSEA = .11.
The next step in the analyses was to systematically free individual gender
21
not significantly change the model fit, χ2 (1) = 1.29, p = .26, and thus the constraint was retained for model parsimony. Next, gender differences in the latent slope mean were examined. Again, no significant difference in model fit was observed, χ2 (1) = 1.20, p = .27. Next, I examined whether the model fit changed if I freely varied the covariance between the latent factors (i.e., intercept and slope); this model was compared with a model in which the covariance between the latent factors was fixed across gender. Fixing the covariance between the latent factors did not significantly change model fit, χ2 (1) = 3.27, p = .07, indicating that the covariance was comparable for boys and girls, and thus the constraint was retained for parsimony. Last, I tested whether I could freely vary the error variances across the three observed indicators of moderate episodic drinking, as well as between and within gender. Results revealed that it was possible to set error variances to be fixed across the three time points for boys, but not for girls. Constraining error variances across the three time points did not significantly change model fit for boys, χ2 (2) = .55, p = .76, and thus constraints were retained for parsimony. However, with respect to girls, fixing the residual variances across time significantly worsened model fit, χ2 (2) = 13.87, p = .001. Therefore, the error variances must be allowed to vary freely across time for girls, and it was not possible to fix the error variance across gender. The final unconditional model for moderate episodic drinking, using a multiple group analysis (by gender), yielded a good fit, χ2 (5) = 8.94, p = .11; χ2/df = 1.79; CFI = .96; NFI = .92; RMSEA = .07.
than 0 at baseline (M = .06, p < .001) with significant variability around this mean for boys (.02, p < .001) and for girls (.01, p < .001). Estimated slope parameters indicated that the moderate episodic drinking slope was significantly greater than zero (M = .16, p
< .001) with significant variability around this mean for boys (.05, p < .001), and
marginally significant variability around this mean for girls (.03, p = .07).
Baseline likeability and popularity as predictors of drinking trajectories
The next goal of analyses was to build upon the unconditional growth curve models described above in order to examine central study hypotheses related to the prospective prediction of drinking trajectories. Three exogenous predictors were added to each of the models: (a) popularity, (b) likeability, and (c) the interaction between
popularity and likeability. These predictors were centered prior to the computation of the interaction term and prior to being entered in the models.
Alcohol use. For the alcohol use model, paths were estimated between all
23
use appears to be moderated by gender, and the path must be allowed to vary freely. An additional chi-square difference test indicated that fixing the path between likeability and the alcohol use intercept also worsened model fit, χ2 (1) = 3.76, p = .05, and this path was also allowed to vary freely. However, fixing the path predicting the alcohol use intercept from the interaction between popularity and likeability did not significantly worsen model fit, χ2 (1) = .78, p = .38, indicating that this relationship was not moderated by gender; the path was therefore fixed for parsimony. The paths between all three predictors and the alcohol use slope were fixed across gender for parsimony: The relationship between popularity and the alcohol use slope was not found to be significantly moderated by gender (χ2 (1) = 1.51, p = .22), and neither were the
relationships between the alcohol use slope and likeability (χ2 (1) = .002, p = .96) or the interaction between likeability and popularity (χ2 (1) = 1.91, p = .17). Final model fit was good, χ2 (18) = 16.75; p = .54; χ2/df = .93; CFI = 1.00; NFI = .94; RMSEA = .00.
All unstandardized and standardized path weights from the alcohol use model are listed in Table 3. Associations consistent with study hypotheses were revealed for popularity, but not for likeability. Among boys, higher levels of baseline (i.e., Grade 8) popularity were significantly associated with higher levels of baseline alcohol use (i.e., intercept), as well as with increased alcohol use trajectories (i.e., slope). Among girls, however, higher levels of baseline popularity only were significantly associated with increased alcohol use trajectories and not with Grade 8 alcohol use; the path weight between popularity and the alcohol use intercept approached but did not reach
increased alcohol use trajectories. Among girls, lower levels of baseline likeability were also significantly associated with increased alcohol trajectories, but no relationship was found between likeability and Grade 8 alcohol use. Additionally, no relationships were found between the interaction of popularity and likeability, and either baseline alcohol use or alcohol use trajectories, for either boys or girls.
Moderate episodic drinking. For the moderate episodic drinking model, paths
were estimated between all predictors and the moderate episodic drinking latent intercept and slope (hereafter referred to in this section as the “alcohol intercept” and “alcohol slope”). Model fit was good, χ2 (11) = 11.27, p = .42; χ2/df = 1.02; CFI = 1.00; NFI = .96; RMSEA = .01. I next tested whether I would be able to fix all three covariances among the predictors across gender. The chi-square difference test indicated that constraining the covariances did not significantly change model fit, χ2 (3) = 1.31, p = .73, and thus
25
p = .47; the path between popularity and the alcohol slope, χ2 (1) = .84, p = .36; the path between likeability and the alcohol slope, χ2 (1) = .12, p = .73; or the path predicting the alcohol slope from the interaction between popularity and likeability, χ2 (1) = .92, p = .34. Thus, each of these five paths was fixed across gender for parsimony. Final model fit was good, χ2 (19) = 17.40; p = .56; χ2/df = .92; CFI = 1.00; NFI = .93; RMSEA = .00.
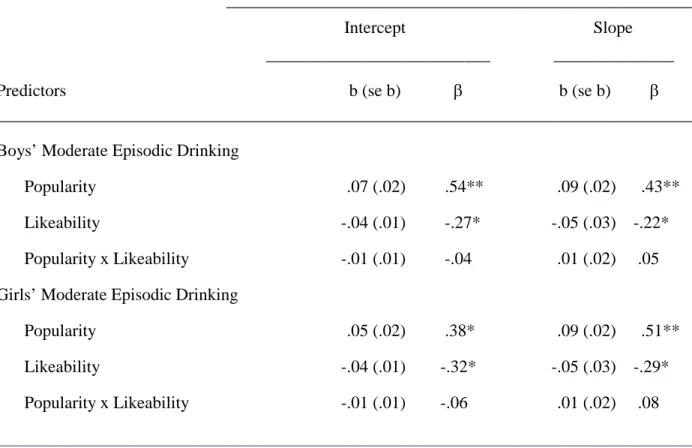
All unstandardized and standardized path weights from the moderate episodic drinking model are listed in Table 4. Associations consistent with study hypotheses were revealed for popularity, but not for likeability. Similar, but not identical, relationships were found between the predictors and the moderate episodic drinking latent factors, as compared to the relationships between the predictors and the alcohol use latent factors. Among both boys and girls, higher levels of baseline (i.e., Grade 8) popularity were significantly associated both with higher levels of baseline moderate episodic drinking (i.e., intercept), as well as with increased drinking trajectories (i.e., slope). Contrary to hypotheses, lower levels of baseline likeability were significantly associated both with higher levels of initial moderate episodic drinking and with increased drinking
DISCUSSION
27
support for study hypotheses; higher levels of popularity, but lower levels of likeability, were associated with higher levels of concurrent and longitudinal drinking.
The trajectories of two different alcohol variables were examined in this study: alcohol use (defined as having one or more drinks) and moderate episodic drinking (defined as having three or more drinks within an episode). A very strong correlation was found between alcohol use and moderate episodic drinking, which is not surprising given that adolescents who engage in moderate episodic drinking must by definition also be consuming at least one drink within an episode. The patterns of results for
unconditional and conditional models were similar for the two variables, and except where explicitly noted, references to “drinking” or “alcohol” will apply to results for both alcohol variables. However, in cases where differences emerged in the associations between the peer status variables and the two different alcohol variables, these
differences will be explicitly noted and speculations about possible explanations for the differences will be proposed.
Prior to examining the primary study hypotheses, unconditional trajectories of alcohol use and moderate episodic drinking were examined. As expected based on well-established findings of increases in drinking over the course of adolescence (e.g.,
did not yet reflect participants’ changes in attitudes toward alcohol use associated with the high school transition. Over the course of 9th grade, as adolescents become immersed in the high school culture and exposed to older youth who are already engaging in
alcohol use, they may increase in their own frequency of drinking; these increases would be reflected in their use reported at the beginning of 10th grade (i.e., Time 3).
Gender differences emerged in the initial levels of drinking and in the growth of drinking trajectories. Consistent with findings that males engage in higher frequencies of drinking and consume greater amounts of alcohol (e.g., Wechsler et al., 1995), 8th grade boys reported higher levels of drinking than girls, although the difference was not statistically significant. Interestingly, while the overall latent slope factor did not significantly differ by gender, girls showed a sharper increase in drinking from 8th to 9th grade than did boys (i.e., the path weight from the slope to the 9th grade indicator was moderated by gender). It may be that for girls, norms surrounding alcohol use may differ more significantly between middle school and high school, whereas for boys, drinking in middle school may be more accepted or reinforced in the peer culture. However, these theories are speculative, and more research is needed regarding how gender may moderate the relationship between peer norms and adolescents’ alcohol use in middle school and high school.
29
popularity in 8th grade were significantly associated with higher levels of 8th grade drinking and with increased longitudinal drinking trajectories from 8th to 10th grade (however, among girls, the relationship between popularity and the baseline alcohol use variable approached but did not reach significance). These findings suggest that youth who are considered by their peers to be higher in popularity (relative to grademates) at the end of middle school, may be at higher risk for drinking at the transition to high school.
Another theory that may help explain the longitudinal association between popularity and drinking has been proposed by Allen and colleagues (2005), who tested a
popularity-socialization hypothesis in which “popular” adolescents are particularly likely
to be socialized to engage in drinking and other mild to moderate forms of deviance that are endorsed by peers (however, of note, “popularity” was based on nominations of peers with whom the participants would most like to spend time on a Saturday night). These researchers found that “popular adolescents were indeed more likely than less popular adolescents to move in the direction of perceived peer norms over time,” in terms of engagement in alcohol use and other mild to moderate risk behaviors (Allen et al., 2005; p. 757). Additionally, the prototype willingness model, proposed by Gibbons, Gerrard, and colleagues (Gibbons & Gerrard, 1995; Gibbons, Gerrard, Blanton, & Russell, 1998), posits that if adolescents associate a particular health risk behavior with a specific
prototype, and if their associations with that prototype are positive, their willingness to engage in that behavior will increase. Gerrard et al. (2002) found that when adolescents were instructed to “think for a minute about the type of person your age who drinks (alcohol) frequently,” participants endorsed “popular” as describing that drinker prototype. Perhaps adolescents who are considered popular feel pressure to engage in drinking in order to match the prototype of the popular drinker and to reassert their social status, especially at the transition to high school, when the social hierarchy may be redefined.
31
additional possible explanation to consider is that popular adolescents may find
Insofar as popularity is associated with larger social networks and higher levels of social contact, it may be that popular adolescents are more frequently in situations in which alcohol is available, as compared to their less popular peers. In particular, indirect evidence suggests a connection between popularity and attendance at social parties, and parties have been cited as a common setting in which high school drinking occurs (e.g., Hussong, 2000). Theory and research regarding the importance of behavioral willingness (e.g., Gibbons et al., 1998) provide potential support for the idea that the relationship between popularity and drinking may in part be related to popular youths’ increased exposure to alcohol use. According to theories of behavioral willingness, adolescents’ engagement in health risk behaviors such as alcohol use may not involve rational planning or forethought, but rather may constitute “reactions to risk-conducive
33
with higher levels of deviance and health risk behaviors (e.g., Prinstein, Meade, & Cohen, 2003; Xie, Li, Boucher, Hutchins, & Cairns, 2006). Because popularity may confer increased pressure to conform to social norms (Allen et al., 2005), popular adolescents may be more willing to engage in alcohol use once the opportunity is presented, in order to match the prototype (e.g., Gibbons & Gerrard, 1995) associated with popularity. Importantly, these theorized relationships between popularity, party attendance, and willingness to engage in drinking are speculative; research is needed to rigorously examine possible mediators of the relationship between popularity and drinking.
Interestingly, examinations of the relationships between likeability and drinking yielded results contrary to study hypotheses and in the opposite direction of the
relationship observed between popularity and drinking. Among both girls and boys,
lower levels of baseline likeability were associated both with higher levels of initial
drinking and with increased drinking trajectories; the exception was that for the alcohol use variable, there was no relationship between 8th grade likeability and 8th grade alcohol use among girls. Overall, the findings of this study suggest that adolescents who are disliked by their peers at the end of middle school are at increased risk for drinking in 8th grade and across the transition to high school. It seems that in spite of the high
correlation between popularity and likeability in 8th grade (r=.61), higher popularity, and not likeability, confers unique risk for alcohol use. The finding that lower likeability is associated with increases in concurrent drinking as well as longitudinal drinking
are engaging in alcohol use in attempts to demonstrate their maturity, rebel against adult-prescribed norms, and fit in with their peers, perhaps to improve their standing in the social hierarchy – reasons that are theorized to contribute to popular youths’ drinking. Alternatively, it is possible that rejected adolescents are using alcohol as a coping mechanism (e.g., self-medicating; Hussong, 2007). Additionally, it may be that lower likeability in 8th grade is associated with more global problems, such as academic and family difficulties, which may contribute to the increased risk for alcohol use. The results of this study suggest a complex relationship between peer status and drinking, and underscore the need for further research into the differential relationships between these two forms of status and the risk for alcohol use.
35
methodological differences among the studies must also be considered when comparing findings. For example, Lansford and colleagues examined changes in likeability from one year to the next, rather than examining the relationship between baseline likeability and concurrent and longitudinal increases in drinking. Additionally, in the Allen et al. study, although the peer status variable is more similar to likeability than to popularity (the researchers emphasize that their variable is a “liking-based” measure rather than a “status-based” measure), the measurement of the peer status variable differed from the current study’s construct of likeability in several key ways. Specifically, Allen et al. asked adolescents to nominate grademates with whom they would most like to spend time on a Saturday night (defined as “like” nominations), and the calculation of their peer status variable did not incorporate “dislike” nominations. It may be that adolescents who are actively disliked by their peers are at higher risk for alcohol use than are adolescents who simply receive a low number of “like” nominations. It is also important to note that differences in the measurement of alcohol use in these studies may have contributed to the different findings observed. For example, the alcohol use variable in Lansford and colleagues’ study was based on responses to the question “Have you ever had a drink of alcohol, even just one sip?” In summary, the conflicting findings of the current study and past studies linking adolescent likeability and drinking may be due in part to the ages of the participants and the time periods studied, to the differences in the constructs and their measurements, and/or to other methodological differences.
Interestingly, the findings of the current study are more in accord with findings from studies examining the associations between childhood likeability and later
that measured likeability once participants had already reached adolescence. Early studies of the connection between childhood rejection (i.e., low likeability) and later negative adolescent outcomes found connections between lower childhood likeability and higher rates of adolescent delinquency (e.g., Parker & Asher, 1987). Additionally,
researchers have specifically demonstrated that low likeability in childhood is related to increased substance use in adolescence (e.g., Prinstein & La Greca, 2004; Dishion et al., 1999). The findings of the current study add further complexity to our understanding of the possible associations between likeability and alcohol use, suggesting that adolescents who are disliked by their peers at the transition to high school may be at risk for
increased drinking trajectories, whereas findings from previous studies of likeability and alcohol use in adolescence have not indicated this association. Clearly, further research on the longitudinal relationship between likeability and drinking will be needed to clarify the risk factors associated with high and low levels of peer acceptance.
Given this study’s findings that higher levels of popularity are associated with concurrent and longitudinal increases in drinking, yet lower levels of likeability are associated with these increases, it might be expected that the interaction between popularity and likeability would be associated with baseline levels of drinking and drinking trajectories. If a significant interaction had been found, this finding would have indicated that among adolescents particularly high or low in popularity or likeability, differences in the level of the other peer status variable would have an influence on those adolescents’ levels of drinking. However, no relationship was found between the
37
popularity and likeability observed in this sample at Time 1, combined with the finding of opposite patterns of association between the alcohol variables and the two respective peer status variables. The finding suggests that the risk factors of high popularity and low likeability may independently confer risk for drinking during adolescence, not necessarily co-occurring within the same individuals.
It is interesting to note that although the correlation between alcohol use and moderate episodic drinking was high at each time point, stronger patterns of results were found for the moderate episodic drinking variable. For moderate episodic drinking, higher levels of baseline popularity predicted increased baseline drinking and increased drinking trajectories for both boys and girls, and lower levels of baseline likeability predicted these increases. In contrast, for the alcohol use variable, for girls, the
relationship between 8th grade popularity and 8th grade alcohol use was in the expected direction but did not reach significance, and no relationship was found between 8th grade likeability and 8th grade alcohol use. It is interesting to consider possible explanations for why girls’ 8th grade popularity was significantly associated with concurrent moderate episodic drinking but not with alcohol use. One possible speculation involves differences in the contexts in which these types of drinking may occur: Whereas lower levels of drinking may occur in a wider variety of contexts (e.g., within the home; Komro, Maldonado-Molina, Tobler, Bonds, & Muller, 2007), heavier drinking is more likely to occur at social gatherings with peers (e.g., Ham & Hope, 2003), and as previously noted, popular adolescents may be exposed to these gatherings more frequently.
and developmental trajectories of highly popular youth, but also because popular youth likely serve as reference groups and models for other students’ behavior (Moffitt, 1993; Cohen & Prinstein, 2006; Mayeux et al., 2008). It is well established that peers’ alcohol use can influence adolescents’ perceptions of its acceptability and desirability (e.g., Cumsille et al., 2000). Additionally, in a study using social network analysis at 19 schools, Ennett and colleagues found that, after controlling for the effects of close friends’ problematic drinking, adolescents’ alcohol misuse was influenced by more “distant” peer relationships at their school (i.e., alcohol misuse was significantly
predicted by the mean level of misuse in the social network) (Ennett et al., 2008). Moffitt (1993) also observed that adolescents could be influenced toward delinquency simply by observing peers model deviant behaviors “from afar.” These peer influence effects may be stronger if the adolescents who engage in drinking are popular. Indeed, it is likely that popular students help define the social norms for substance use in their schools (Prinstein et al., 2003; Cohen & Prinstein, 2006), dictating what is “cool” (Pirkle & Richter, 2006) and modeling socially desirable substance use for other youth (Moffitt, 1993). Cohen and Prinstein’s (2006) work provides empirical support for the hypothesis that
adolescents will be more heavily influenced to engage in deviant behavior such as substance use if the behavior is endorsed by popular peers. In a “chat room” in which adolescent boys believed they were conversing with popular or unpopular peers from their school, the participants were more likely to conform to risky attitudes regarding drinking and other health risk or aggressive behaviors, when those attitudes were
39
norms campaigns could benefit from considering the potentially significant impact of popular adolescents’ attitudes towards substance use; perhaps interventions targeting popular high school students could indirectly influence the attitudes and behaviors of the wider student body.
Cohen and Prinstein (2006) have provided empirical evidence for a relationship between popularity and influence on risk behaviors, and future work with this chat room paradigm could help to “actively manipulate” social norms surrounding substance use and other health risk behaviors (Prinstein et al., 2003).
In summary, the current study addressed gaps in the literature by using latent growth curve modeling to examine the relationships between two forms of peer status (i.e., popularity and likeability) and longitudinal trajectories of drinking across the transition to high school. Higher popularity in 8th grade was associated with higher baseline drinking and increased drinking trajectories from 8th to 10th grade, while lower likeability in 8th grade predicted such increases. These findings underscore the
41
REFERENCES
Allen, J., Porter, M., McFarland, F., Marsh, P., & McElhaney, K. (2005). The Two Faces of Adolescents' Success With Peers: Adolescent Popularity, Social Adaptation, and Deviant Behavior. Child Development, 76(3), 747-760. doi:10.1111/j.1467-8624.2005.00875.x.
Balodis, I., Potenza, M., & Olmstead, M. (2009). Binge drinking in undergraduates Relationships with sex, drinking behaviors, impulsivity, and the perceived effects of alcohol. Behavioural Pharmacology, 20(5-6), 518-526.
doi:10.1097/FBP.0b013e328330c779.
Bandura, A. (1974). Behavior theory and the models of man. American Psychologist,
29(12), 859-869. doi:10.1037/h0037514.
Beal, A., Ausiello, J., & Perrin, J. (2001). Social influences on health-risk behaviors among minority middle school students. Journal of Adolescent Health, 28(6), 474-480. doi:10.1016/S1054-139X(01)00194-X.
Bollen, K. A., & Curran, P. J. (2006). Latent Curve Models: A Structural Equation
Perspective. Hoboken, NJ: John Wiley & Sons, Inc.
Borsari, B., & Carey, K. (2001). Peer influences on college drinking: A review of the research. Journal of Substance Abuse, 13(4), 391-424. doi:10.1016/S0899-3289(01)00098-0.
Borsari, B., & Carey, K. (2003). Descriptive and injunctive norms in college drinking: A meta-analytic integration. Journal of Studies on Alcohol, 64(3), 331-341.
Retrieved from PsycINFO database.
Centers for Disease Control (1998). Youth-risk behavior surveillance – United States, 1997. Morbidity and Mortality Weekly Report, 47, SS-3.
Chassin, L., Hussong, A., & Beltran, I. (2009). Adolescent substance use. In R. M. Lerner, & L. Steinberg (Eds.), Handbook of adolescent psychology, Vol 1:
Individual bases of adolescent development (3rd ed.) (pp. 723-763). Hoboken, NJ:
John Wiley & Sons, Inc.
Cillessen, A., & Mayeux, L. (2004). From Censure to Reinforcement: Developmental Changes in the Association Between Aggression and Social Status. Child
Development, 75(1), 147-163. doi:10.1111/j.1467-8624.2004.00660.x.
Cillessen, A., & Rose, A. (2005). Understanding Popularity in the Peer System. Current
Directions in Psychological Science, 14(2), 102-105.
Cohen, G. (2003). Party Over Policy: The Dominating Impact of Group Influence on Political Beliefs. Journal of Personality and Social Psychology, 85(5), 808-822. doi:10.1037/0022-3514.85.5.808.
Cohen, G., & Prinstein, M. (2006). Peer Contagion of Aggression and Health Risk Behavior Among Adolescent Males: An Experimental Investigation of Effects on Public Conduct and Private Attitudes. Child Development, 77(4), 967-983. doi:10.1111/j.1467-8624.2006.00913.x.
Cohen, J., Cohen, P., West, S. G., & Aiken, L. S. (2003). Applied multiple
regression/correlation analysis for the behavioral sciences (3rd ed.). Mahwah, NJ
US: Lawrence Erlbaum Associates Publishers.
Coie, J., & Dodge, K. (1983). Continuities and changes in children's social status: A five-year longitudinal study. Merrill-Palmer Quarterly: Journal of Developmental
Psychology, 29(3), 261-282. Retrieved from PsycINFO database.
Coie, J., Dodge, K., & Coppotelli, H. (1982). Dimensions and types of social status: A cross-age perspective. Developmental Psychology, 18(4), 557-570.
doi:10.1037/0012-1649.18.4.557.
Coleman, L., & Cater, S. (2005). Underage 'binge' drinking: A qualitative study into motivations and outcomes. Drugs: Education, Prevention & Policy, 12(2), 125-136. doi:10.1080/09687630512331323521.
Courtney, K., & Polich, J. (2009). Binge drinking in young adults: Data, definitions, and determinants. Psychological Bulletin, 135(1), 142-156. doi:10.1037/a0014414. Crews F.T., Braun C.J., Hoplight B., Switzer R.C. 3rd, Knapp D.J. (2000). Binge ethanol
consumption causes differential brain damage in young adolescent rats compared with adult rats. Alcoholism: Clinical and Experimental Research, 24, 1712–1723. doi: 10.1111/j.1530-0277.2000.tb01973.x.
Crews, F., He, J., & Hodge, C. (2007). Adolescent cortical development: A critical period of vulnerability for addiction. Pharmacology, Biochemistry and Behavior, 86(2), 189-199. doi:10.1016/j.pbb.2006.12.001.
Cumsille, P., Sayer, A., & Graham, J. (2000). Perceived exposure to peer and adult drinking as predictors of growth in positive alcohol expectancies during adolescence. Journal of Consulting and Clinical Psychology, 68(3), 531-536. doi:10.1037/0022-006X.68.3.531.
Curran, P., & Hussong, A. (2003). The use of latent trajectory models in
psychopathology research. Journal of Abnormal Psychology, 112(4), 526-544. doi:10.1037/0021-843X.112.4.526.
43
Consulting and Clinical Psychology, 65(1), 130-140.
doi:10.1037/0022-006X.65.1.130.
D'Amico, E., Metrik, J., McCarthy, D., Frissell, K., Applebaum, M., & Brown, S. (2001). Progression into and out of binge drinking among high school students.
Psychology of Addictive Behaviors, 15(4), 341-349.
doi:10.1037/0893-164X.15.4.341.
DeWit, D., Adlaf, E., Offord, D., & Ogborne, A. (2000). Age at first alcohol use: A risk factor for the development of alcohol disorders. The American Journal of
Psychiatry, 157(5), 745-750. doi:10.1176/appi.ajp.157.5.745.
Dishion, T., Capaldi, D., & Yoerger, K. (1999). Middle childhood antecedents to
progressions in male adolescent substance use: An ecological analysis of risk and protection. Journal of Adolescent Research, 14(2), 175-205.
doi:10.1177/0743558499142003.
Dolcini, M., & Adler, N. (1994). Perceived competencies, peer group affiliation, and risk behavior among early adolescents. Health Psychology, 13(6), 496-506.
doi:10.1037/0278-6133.13.6.496.
Eder, D. (1985). The cycle of popularity: Interpersonal relations among female adolescents. Sociology of Education, 58(3), 154-165. doi:10.2307/2112416. Ennett, S., Foshee, V., Bauman, K., Hussong, A., Cai, L., Luz, H, ... DuRant, R. (2008).
The social ecology of adolescent alcohol misuse. Child Development, 79(6), 1777-1791. doi:10.1111/j.1467-8624.2008.01225.x.
Faden, V. (2006). Trends in initiation of alcohol use in the United States 1975 to 2003.
Alcoholism: Clinical and Experimental Research, 30(6), 1011-1022.
doi:10.1111/j.1530-0277.2006.00115.x.
Gerrard, M., Gibbons, F., Reis-Bergan, M., Trudeau, L., Vande Lune, L., & Buunk, B. (2002). Inhibitory effects of drinker and nondrinker prototypes on adolescent alcohol consumption. Health Psychology, 21(6), 601-609. doi:10.1037/0278-6133.21.6.601.
Gibbons, F. X., & Gerrard, M. (1995). Predicting young adults’ health risk behavior.
Journal of Personality and Social Psychology, 69, 505-517. doi:
10.1037/0022-3514.69.3.505.
Gibbons, F. X., Gerrard, M., Blanton, H., & Russell, D. W. (1998). Reasoned action and social reaction: Willingness and intention as independent predictors of health risk.
Journal of Personality and Social Psychology, 74, 1164-1180. doi:
Ham, L., & Hope, D. (2003). College students and problematic drinking: A review of the literature. Clinical Psychology Review, 23(5), 719-759. doi:10.1016/S0272-7358(03)00071-0.
Harter, S., Stocker, C., & Robinson, N. (1996). The perceived directionality of the link between approval and self-worth: The liabilities of a looking glass self-orientation among young adolescents. Journal of Research on Adolescence, 6(3), 285-308. Retrieved from PsycINFO database.
Hersh, M. & Hussong, A. (2006). High school drinker typologies predict alcohol
involvement and psychosocial adjustment during acclimation to college. Journal
of Youth and Adolescence, 35(5), 741-754. doi:10.1007/s10964-006-9067-0.
Hussong, A. (2000). The settings of adolescent alcohol and drug use. Journal of Youth
and Adolescence, 29(1), 107-119. doi:10.1023/A:1005177306699.
Hussong, A. M. (2007). Predictors of drinking immediacy following daily sadness: An application of survival analysis to experience sampling data. Addictive Behaviors, 32(5), 1054-1065. doi:10.1016/j.addbeh.2006.07.011
Johnston, L. D., O'Malley, P. M., Bachman, J. G., & Schulenberg, J. E. (2009).
Monitoring the Future national survey results on drug use, 1975-2008. Volume I: Secondary school students (NIH Publication No. 09-7402). Bethesda, MD:
National Institute on Drug Abuse, 721 pp.
Juvonen, J., & Murdock, T. (1995). Grade-level differences in the social value of effort: Implications for self-presentation tactics of early adolescents. Child Development,
66(6), 1694-1705. doi:10.2307/1131904.
Kobus, K., & Henry, D. B. (2010). Interplay of network position and peer substance use in early adolescent cigarette, alcohol, and marijuana use. The Journal of Early
Adolescence, 30(2), 225-245. doi:10.1177/0272431609333300.
Komro, K., Maldonado-Molina, M., Tobler, A., Bonds, J., & Muller, K. (2007). Effects of home access and availability of alcohol on young adolescents' alcohol use.
Addiction, 102(10), 1597-1608. doi:10.1111/j.1360-0443.2007.01941.x.
LaFontana, K., & Cillessen, A. (2002). Children's perceptions of popular and unpopular peers: A multimethod assessment. Developmental Psychology, 38(5), 635-647. doi:10.1037/0012-1649.38.5.635.
Lansford, J., Killeya-Jones, L., Miller, S., & Costanzo, P. (2009). Early adolescents’ social standing in peer groups: Behavioral correlates of stability and change.
Journal of Youth and Adolescence, 38(8), 1084-1095.
45
Matthews, D. (2010). Adolescence and alcohol: Recent advances in understanding the impact of alcohol use during a critical developmental window. Alcohol, 44(1), 1-2. doi:10.1016/j.alcohol.2009.10.018.
Mayeux, L., Sandstrom, M., & Cillessen, A. (2008). Is being popular a risky proposition?. Journal of Research on Adolescence, 18(1), 49-74. doi:10.1111/j.1532-7795.2008.00550.x.
Moffitt, T. (1993). Adolescence-limited and life-course-persistent antisocial behavior: A developmental taxonomy. Psychological Review, 100(4), 674-701.
doi:10.1037/0033-295X.100.4.674.
Palmer, R., Young, S., Hopfer, C., Corley, R., Stallings, M., Crowley, T., & Hewitt, J. (2009). Developmental epidemiology of drug use and abuse in adolescence and young adulthood: Evidence of generalized risk. Drug and Alcohol Dependence,
102(1-3), 78-87. doi:10.1016/j.drugalcdep.2009.01.012.
Parker, J., & Asher, S. (1987). Peer relations and later personal adjustment: Are low-accepted children at risk?. Psychological Bulletin, 102(3), 357-389.
doi:10.1037/0033-2909.102.3.357.
Parkhurst, J., & Hopmeyer, A. (1998). Sociometric popularity and peer-perceived popularity: Two distinct dimensions of peer status. The Journal of Early
Adolescence, 18(2), 125-144. doi:10.1177/0272431698018002001.
Patrick, M., & Schulenberg, J. (2010). Alcohol use and heavy episodic drinking
prevalence and predictors among national samples of American eighth- and tenth-grade students. Journal of Studies on Alcohol and Drugs, 71(1), 41-45.
Prinstein, M., & Cillessen, A. (2003). Forms and functions of adolescent peer aggression associated with high levels of peer status. Merrill-Palmer Quarterly: Journal of
Developmental Psychology, 49(3), 310-342. doi:10.1353/mpq.2003.0015.
Prinstein, M., & La Greca, A. (2004). Childhood Peer Rejection and Aggression as Predictors of Adolescent Girls' Externalizing and Health Risk Behaviors: A 6-Year Longitudinal Study. Journal of Consulting and Clinical Psychology, 72(1), 103-112. doi:10.1037/0022-006X.72.1.103.
Prinstein, M. J., Meade, C. S., & Cohen, G. L. (2003). Adolescent oral sex, peer
popularity, and perceptions of best friend's sexual behavior. Journal of Pediatric
Psychology, 28, 243-249. doi: 10.1093/jpepsy/jsg012.
Shedler, J., & Block, J. (1990). Adolescent drug use and psychological health. American
Psychologust, 45, 612-630.
Simons-Morton, B., & Chen, R. (2006). Over time relationships between early adolescent and peer substance use. Addictive Behaviors, 31(7), 1211-1223.
Substance Abuse and Mental Health Services Administration. (2009). Results from the
2008 National Survey on Drug Use and Health: National Findings (Office of
Applied Studies, NSDUH Series H-36, HHS Publication No. SMA 09-4434). Rockville, MD.
Taffe, M., Kotzebue, R., Crean, R., Crawford, E., Edwards, S., & Mandyam, C. (2010). Long-lasting reduction in hippocampal neurogenesis by alcohol consumption in adolescent nonhuman primates. PNAS Proceedings of the National Academy of
Sciences of the United States of America, 107(24), 11104-11109.
doi:10.1073/pnas.0912810107.
Urberg, K. A., Degirmencioglu, S. M. & Pilgrim, C. (1997). Close friend and group influence on adolescent cigarette smoking and alcohol use. Developmental
Psychology, 33, 834-844. doi: 10.1037/0012-1649.33.5.834.
Wechsler, H., Dowdall, G., Davenport, A., & Castillo, S. (1995). Correlates of college student binge drinking. American Journal of Public Health, 85(7), 921-926. doi:10.2105/AJPH.85.7.921.
Xie, H., Li, Y., Boucher, S. M., Hutchins, B. C., & Cairns, B. D. (2006). What makes a girl (or a boy) popular (or unpopular)? African American children’s perceptions and developmental differences. Developmental Psychology, 42(4), 599-612. doi:10.1037/0012-1649.42.4.599.
47
Table 1. Means (and Standard Deviations) for Primary Variables at Time 1 - Time 3
Boys Girls t (df)
______________________________________________________________________________________
Time 1
Alcohol Use .09 (.20) .06 (.15) t (161) = 1.19
Moderate Episodic Drinking .08 (.17) .05 (.13) t (161) = 1.35
Popularity .08 (.98) .11 (.87) t (163) = -0.22
Likeability .04 (.86) .33 (.93) t (163) = -2.12*
Time 2
Alcohol Use .08 (.19) .15 (.22) t (159) = -1.92
Moderate Episodic Drinking .07 (.17) .12 (.19) t (158) = -1.83
Time 3
Alcohol Use .21 (.27) .28 (.29) t (157) = -1.62
Moderate Episodic Drinking .19 (.25) .24 (.26) t (157) = -1.09
_______________________________________________________________________________
Table 2. Bivariate Associations Among Primary Variables
1 2 3 4 5 6 7
Time 1
1. Alcohol Use -
2. Moderate Episodic Drinking .98** -
3. Popularity .26** .25** -
4. Likeability .07 -.02 .66** -
Time 2
5. Alcohol Use .53** .52** .27** .01 -
6. Moderate Episodic Drinking .48** .48** .30** .01 .97** -
Time 3
7. Alcohol Use .29** .28** .35** .08 .48** .46** -
8. Moderate Episodic Drinking .31** .31** .38** .08 .50** .48** .97**
_______________________________________________________________________________
49
Table 3. Longitudinal Prediction of Alcohol Use Trajectories by Popularity, Likeability, and the
Interaction between Popularity and Likeability (n = 165)
______________________________________________________
Intercept Slope
__________________________ ______________
Predictors b (se b) β b (se b) β
_________________________________________________________________________________
Boys’ Alcohol Use
Popularity .09 (.02) .57** .09 (.03) .38**
Likeability -.07 (.02) -.38* -.06 (.03) -.21*
Popularity x Likeability -.01 (.01) -.03 .01 (.02) .05
Girls’ Alcohol Use
Popularity .04 (.02) .22 .09 (.03) .39**
Likeability -.01 (.02) -.09 -.06 (.03) -.28*
Popularity x Likeability -.01 (.01) -.04 .01 (.09) .07
_________________________________________________________________________________
Table 4. Longitudinal Prediction of Moderate Episodic Drinking Trajectories by Popularity,
Likeability, and the Interaction between Popularity and Likeability (n = 165)
______________________________________________________
Intercept Slope
__________________________ ______________
Predictors b (se b) β b (se b) β
_________________________________________________________________________________
Boys’ Moderate Episodic Drinking
Popularity .07 (.02) .54** .09 (.02) .43**
Likeability -.04 (.01) -.27* -.05 (.03) -.22*
Popularity x Likeability -.01 (.01) -.04 .01 (.02) .05
Girls’ Moderate Episodic Drinking
Popularity .05 (.02) .38* .09 (.02) .51**
Likeability -.04 (.01) -.32* -.05 (.03) -.29*
Popularity x Likeability -.01 (.01) -.06 .01 (.02) .08
_________________________________________________________________________________