Use of Therapeutic Drug Monitoring, Electronic Health Record
Data, and Pharmacokinetic Modeling to Determine the
Therapeutic Index of Phenytoin and Lamotrigine
Lawrence C. Ku, MD1,2, Huali Wu, PhD1, Rachel G. Greenberg, MD1,2, Kevin D. Hill, MD,
MS1,2, Daniel Gonzalez, PharmD, PhD3, Christoph P. Hornik, MD, MPH1,2, Alysha Berezny1,
Jeffrey T. Guptill, MD, MA, MHS1,4, Wenlei Jiang, PhD5, Nan Zheng, PhD5, Michael Cohen-Wolkowiez, MD, PhD1,2, and Chiara Melloni, MD, MHS1
1Duke Clinical Research Institute, Duke University School of Medicine, Durham, North Carolina,
USA
2Department of Pediatrics, Duke University School of Medicine, Durham, North Carolina, USA
3Division of Pharmacotherapy and Experimental Therapeutics, UNC Eshelman School of
Pharmacy, University of North Carolina, Chapel Hill, North Carolina, USA
4Department of Neurology, Duke University School of Medicine, Durham, North Carolina, USA
5Office of Generic Drugs, US Food and Drug Administration, Silver Spring, MD, USA
Abstract
Background—Defining a drug's therapeutic index (TI) is important for patient safety and regulating the development of generic drugs. For many drugs, the TI is unknown. A systematic approach was developed to characterize the TI of a drug using therapeutic drug monitoring and electronic health record (EHR) data with pharmacokinetic (PK) modeling. This approach was first tested on phenytoin, which has a known TI, and then applied to lamotrigine, which lacks a defined TI.
Methods—Retrospective EHR data from patients in a tertiary hospital were used to develop phenytoin and lamotrigine population PK models and to identify adverse events (anemia, thrombocytopenia, and leukopenia) and efficacy outcomes (seizure-free). Phenytoin and lamotrigine concentrations were simulated for each day with an adverse event or seizure. Relationships between simulated concentrations and adverse events and efficacy outcomes were used to calculate the TI for phenytoin and lamotrigine.
Results—For phenytoin, 93 patients with 270 total and 174 free concentrations were identified. A de novo 1-compartment PK model with Michaelis-Menten kinetics described the data well. Simulated average total and free concentrations of 10-15 and 1.0-1.5 μg/mL were associated with both adverse events and efficacy in 50% of patients, resulting in a TI of 0.7–1.5. For lamotrigine, 45 patients with 53 concentrations were identified. A published 1-compartment model was adapted to characterize the PK data. No relationships between simulated lamotrigine
HHS Public Access
Author manuscript
Ther Drug Monit
. Author manuscript; available in PMC 2017 December 01.Published in final edited form as:
Ther Drug Monit. 2016 December ; 38(6): 728–737. doi:10.1097/FTD.0000000000000354.
A
uthor Man
uscr
ipt
A
uthor Man
uscr
ipt
A
uthor Man
uscr
ipt
A
uthor Man
uscr
concentrations and safety or efficacy endpoints were seen; therefore, the TI could not be calculated.
Conclusions—This approach correctly determined the TI of phenytoin but was unable to determine the TI of lamotrigine due to a limited sample size. The use of therapeutic drug monitoring and EHR data to aid in narrow TI drug classification is promising, but it requires an adequate sample size and accurate characterization of concentration–response relationships.
Keywords
phenytoin; lamotrigine; pharmacokinetics; therapeutic index
INTRODUCTION
The therapeutic index (TI) of a drug is often defined as the ratio of minimum toxic concentration to minimum therapeutic concentration1.(1) For narrow TI drugs, small differences in exposures can lead to serious toxicities or therapeutic failures. Appropriate classification of a drug as narrow TI is important in patient care and in drug development. Knowing that a drug has a narrow TI is important to patients and clinicians because narrow TI drugs require precise dose titration and close patient monitoring2.(2) In generic drug development, drugs classified as narrow therapeutic index (NTI) drugs are subject to stricter bioequivalence standards.
Since 2012, the US Food and Drug Administration (FDA) has set tighter bioequivalence standards for the approval of generic NTI drugs3.(3) The goals of these tighter standards are to improve patient safety, enhance physician confidence in generic products, and generate public health cost savings resulting from increased generic drug prescriptions4.(4) However, a broad implementation of these tighter standards has been hindered largely by difficulty in identifying the TI for many drugs, leading to difficulty in determining NTI drug
classification1.(1) For these drugs, the therapeutic ranges in humans have not been established, with no consensus regarding therapeutic or toxic concentrations.
Antiepileptic drugs (AEDs) are a class of drugs that would benefit from an efficient and systematic method of narrow TI classification. Both patients and physicians hesitate to use the generic formulation and have expressed concerns regarding an increase in breakthrough seizures resulting from the conversion to generic use5–9.(5-9) These concerns are endorsed by the American Academy of Neurology through the release of a position statement opposing generic substitution of AEDs for the treatment of epilepsy without physician and patient consent10.(10) In response to these concerns, the FDA funded studies to investigate brand and generic bioequivalence in epilepsy patients, and the study results demonstrated bioequivalence in the target patient population11,12.(11, 12) Furthermore, the FDA encourages research for NTI classification of AEDs, which will become subject to tighter quality and bioequivalence standards. Phenytoin and lamotrigine are two AEDs with generic formulations approved prior to the enforcement of stricter bioequivalence criteria for NTI drugs.
A
uthor Man
uscr
ipt
A
uthor Man
uscr
ipt
A
uthor Man
uscr
ipt
A
uthor Man
uscr
This study aimed to develop and apply a systematic approach for finding the TI of a drug by integrating therapeutic drug monitoring (TDM) and electronic health record (EHR) data with pharmacokinetic (PK) modeling and simulation. This approach was first evaluated using phenytoin, an AED with a well-accepted narrow TI13.(13) The methodology was then applied to lamotrigine, an AED lacking a defined TI14.(14)
MATERIALS AND METHODS
Study design and data collection
We included all patients ≥18 years of age treated with phenytoin or lamotrigine for seizures while admitted to the Duke University Health System between July 2013 and August 2014 for phenytoin or between January 2012 and December 2013 for lamotrigine. Eligible participants had an electroencephalogram and at least one phenytoin plasma concentration or lamotrigine serum concentration documented during hospitalization. Patients without dosing records available in the EHR were excluded. Data were accessed through an electronic data warehouse containing information from all operational systems serving the medical center's hospitals and clinics15.(15) The following data were extracted: demographic variables, drug concentration data including time of sample collection, concomitant medications of interest (carbamazepine, valproate, phenobarbital, diazepam, clonazepam, and fluconazole), and clinical laboratory results (hematocrit, platelet count, and white blood cell count). The concomitant medications of interest were selected based on their potential for influencing phenytoin or lamotrigine concentrations through induction or inhibition of various drug metabolizing enzymes. The following additional data were collected through direct review of electronic health records: dosing information including timing of drug administration and clinical outcomes that included directly observed seizures and electrographic seizures captured on electroencephalogram. The Duke University Institutional Review Board and the FDA's Research Involving Human Subjects Committee approved the study with a waiver of informed consent.
Standard procedures for analysis of phenytoin and lamotrigine samples
Phenytoin and lamotrigine samples were collected as part of routine medical care during the study period in whole blood EDTA containers. Total and free phenytoin concentrations were analyzed at the Duke University Health System Laboratories (Durham, NC). Total and free phenytoin concentrations were determined using a particle-enhanced turbidimetric inhibition immunoassay. The lower limit of quantification for the total phenytoin assay was 2.5 μg/mL and free phenytoin was 0.5 μg/mL, with an error of <10% throughout the analytical range for both assays (Duke University Health System Clinical Labs, personal communication). The assay was performed using the UniCel DxC 800 Synchron Clinical Systems (Beckman Coulter, Inc., Brea, CA) with a YMT membrane used to separate unbound from bound phenytoin. Approximately 350 μL of serum was used to prepare adequate filtrate per sample. The ultrafiltrate used to determine the free phenytoin concentration was generated by centrifuging the sample in a fixed-angle centrifuge at 3500 rpms for 15 to 20 minutes at 25 °C.
A
uthor Man
uscr
ipt
A
uthor Man
uscr
ipt
A
uthor Man
uscr
ipt
A
uthor Man
uscr
Lamotrigine concentrations were analyzed at the Mayo Clinic Laboratories (Rochester, NY) using a liquid chromatography-tandem mass spectrometry assay. The lower limit of
quantification for the lamotrigine assay was 0.2 μg/mL, and the error of the assay was <10% throughout the analytical range (Mayo Clinic Laboratories, personal communication). The assay was performed using the RapidFire 365/Agilent 6495 platform (Agilent Technologies, Santa Clara, CA). One quantifying and two qualifying ions were used for lamotrigine along with one quantifying and one qualifying ion for the 13C-labeled internal standard.
Population PK analysis
Phenytoin and lamotrigine PK data were analyzed with a nonlinear mixed effects modeling approach using NONMEM (version 7.2, Icon Solutions, Ellicott City, MD, USA). We used first-order conditional estimation method with interaction (FOCE-I) for all model runs and performed run management using Pirana (version 2.8.1)16.(16) To assess internal model validity, we used visual predictive checks and bootstrap methods in Perl-speaks-NONMEM (version 3.6.2)17.(17) We performed model output data manipulation and visualization using Stata 13.1 (College Station, TX), R (version 3.0.2, R Foundation for Statistical Computing, Vienna, Austria) and RStudio (version 0.97.551, RStudio, Boston, MA, USA) packages, including lattice, Xpose, and ggplot218–20.(18-20)
Published PK models for phenytoin and lamotrigine were identified to serve as the basis for our analyses. Published structural model parameters for each drug were collected and recorded in an information database. Parameters related to covariate effects and random effect parameters were used whenever published population models implementing a mixed effects modeling approach were available. If a published PK model could not be readily applied to the study data, de novo development of a population PK model using the study data was planned.
For both phenytoin and lamotrigine, interindividual variability was assessed for PK model parameters using an exponential relationship. Proportional, additive, and combined (proportional plus additive) residual error models were evaluated. Visual inspection of the potential effect of covariates on PK parameters was performed by creating scatter and box plots (continuous and categorical variables, respectively) of the differences between the individual and population values (ETAs) for the PK parameters against the following covariates: age, body weight, gender, race, and concomitant clonazepam use. Concomitant clonazepam use has been reported to reduce phenytoin concentrations in patients with epilepsy21.(21) Other concomitant medications were not evaluated as covariates because the number of patients exposed were too few, and therefore plots of ETAs for the PK parameters versus these covariates did not suggest any visible relationships. Continuous covariates were normalized to the population median. The power function was used for continuous
covariates to describe covariate relationships on PK parameters. A forward inclusion (p < 0.05, change in objective function value [ΔOFV] >3.8) and backward elimination (p < 0.001, ΔOFV >10.8) approach was used to evaluate statistical significance for covariates with ETA versus covariate plots that suggested potential relationships.
A
uthor Man
uscr
ipt
A
uthor Man
uscr
ipt
A
uthor Man
uscr
ipt
A
uthor Man
uscr
Phenytoin population PK model development
A phenytoin population PK model was generated de novo because the published phenytoin PK models could not address the complexities of the study data. The data from the
phenytoin cohort were complicated by use of multiple dosing routes (oral and intravenous), different formulations (extended release, fast release, and use of fosphenytoin) and different combinations of free and total phenytoin concentration measurements.
A sequential modeling approach was used during phenytoin model building by first developing a population PK model and generating parameter estimates for total phenytoin concentrations. These parameter estimates were then fixed and used during the modeling of free phenytoin concentrations. Based on a review of literature and given the sparse nature of total phenytoin data, a 1-compartment PK model with first-order absorption and nonlinear clearance was evaluated using the ADVAN13 subroutine22–28.(22-28) Based on a published population PK model23(23), two types of kinetics were tested to describe the nonlinear clearance of phenytoin: 1) Michaelis-Menten kinetics or 2) first-order kinetics in parallel with Michaelis-Menten kinetics. Bioavailability for oral phenytoin after immediate release and extended-release formulations were assumed to be identical, and the parameter was fixed using published data29.(29) The sparse sample availability precluded the ability to characterize the drug absorption phase. Consequently, the oral absorption parameter of the release formulation was estimated and fixed using data from a previous extended-release formulation bioequivalence study30.(30)
The PK model for free phenytoin concentrations was developed using the model structure and PK parameter estimates generated for total phenytoin concentrations. The PK
parameters for total phenytoin concentrations were fixed, and a parameter representing the unbound fraction was estimated to link total phenytoin and free phenytoin concentrations.
Lamotrigine population PK model development
Based on visual inspection of the PK data and review of the literature, a 1-compartment model with first-order absorption and elimination published by Rivas et al. was adapted to describe the lamotrigine PK data31.(31) Only five samples were obtained within 3 hours after the last dose, which were too few to characterize the absorption phase following drug administration. Therefore, the final model fixed the parameter estimate of the absorption rate to the constant from the Rivas model (1.3 h−1). Similarly, because of the limited number of patients who were exposed to concomitant medications during the study period, the parameter estimates for covariate effects of concomitant medications on clearance in the final model were fixed to the constants from the Rivas model.
Evaluation of PK models
Successful minimization, diagnostic plots, plausibility and precision of parameter estimates, as well as objective function and shrinkage values, were used to assess model
appropriateness. Except for the absorption rate constant, parameter precision for the final population PK model was evaluated via non-parametric bootstrapping using 1000 replicates to generate 95% confidence intervals for parameter estimates. Standardized visual predictive check was performed using the final model to generate 1000 Monte Carlo simulation
A
uthor Man
uscr
ipt
A
uthor Man
uscr
ipt
A
uthor Man
uscr
ipt
A
uthor Man
uscr
replicates per time point of lamotrigine or phenytoin concentrations. Subject-level simulated concentrations were then compared with observed values by calculating and plotting the percentile of each observed concentration in relation to its 1000 simulated concentrations32. (32) The dosing and covariate values used to generate the simulations in the visual predictive check were the same as those used in the study population.
Assessment of efficacy, safety, and concentration—response relationships
The following adverse events of interest were identified based on the drug label: anemia (male: hematocrit <0.39; female: hematocrit <0.35), thrombocytopenia (platelets <150 × 103/mL), and leukopenia (white blood cell count <3.2 × 10³/mL). Efficacy was assessed through any occurrence of seizure and the total number of seizures in 1 day during hospitalization. The final population PK models were used to simulate phenytoin and lamotrigine concentrations, including concentrations at the time of laboratory collections, and average concentrations for each day a laboratory collection occurred or seizure diagnosis was made during the hospitalization. The simulated daily average concentrations were calculated by dividing the area under the curve per hospital day by 24 hours. Daily average concentrations were used because average concentrations provide a better representation of drug exposure over a 24-hour period compared to trough concentrations, especially when trough concentrations are <5 mg/L33.(33) The relationships between drug concentrations and safety or efficacy outcomes were evaluated for simulated concentrations from hospitalized patients. Comparisons of drug concentrations among groups achieving and failing to achieve safety and efficacy endpoints were performed using the Mann-Whitney U test with statistical significance defined as p < 0.05.
Determination of the therapeutic index
Simulated daily average concentrations for each drug were divided into five subgroups of equal intervals. For each subgroup, the percentage of patients experiencing any adverse event and the percentage of patients remaining seizure-free at the time of simulated concentration were calculated by dividing the number of simulated average concentrations associated with at least one adverse event or (AE) without seizure by the total number of simulated average concentrations within the specific concentration range (Equations 1 and 2).
(1)
A
uthor Man
uscr
ipt
A
uthor Man
uscr
ipt
A
uthor Man
uscr
ipt
A
uthor Man
uscr
(2)
Only simulated concentrations from patients experiencing at least one seizure during the hospitalization were included in the calculation of percentage of patients without seizures. By including patients with at least one seizure, this allowed us to compare concentrations associated with seizure events versus concentrations associated with no seizure events to determine the minimum concentration needed for efficacy.
The lowest concentration interval with at least 50% of patients within the concentration range developing any adverse event and the lowest concentration interval with at least 50% of patients within the concentration range remaining seizure-free were defined as the median minimal toxic concentration (TD50) and median minimal effective concentration (ED50) intervals, respectively. Because intervals were used, this resulted in a range of TIs. The lower limit of this TI range was determined by dividing the upper limit of the TD50 interval by the lower limit of the ED50 interval whereas the upper limit of this TI range was determined by dividing the lower limit of the TD50 interval by the upper limit of the ED50 interval (Equation 3).
(3a)
(3b)
RESULTS
Phenytoin cohort characteristics and observed concentrations
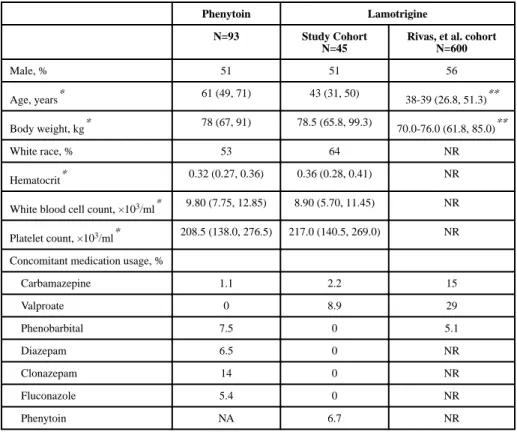
A total of 270 total phenytoin and 174 free phenytoin plasma concentrations were identified from 93 patients with epilepsy who were admitted to a Duke University Health System hospital during the study period. Patients had a median (interquartile range, IQR) age of 61 years (49–71) and median (range) of 2 (1–10) total phenytoin levels and 2 (1–8) free phenytoin levels per subject (Table 1). Among all subjects, the median (range) total phenytoin concentration was 14.3 (3.2–30.6) μg/mL and free phenytoin concentration was 1.8 (0.5–4.1) μg/mL. The median (range) of unbound fraction, estimated as a ratio of observed free phenytoin to total phenytoin concentrations, was 0.118 (0.050–0.303). Only 1 patient was taking carbamazepine, 7 patients were taking phenobarbital, 6 patients were
A
uthor Man
uscr
ipt
A
uthor Man
uscr
ipt
A
uthor Man
uscr
ipt
A
uthor Man
uscr
taking diazepam, 13 patients were taking clonazepam, and 5 patients were taking fluconazole concomitantly during the study period.
Phenytoin population PK model development
A 1-compartment model with Michaelis-Menten kinetics described the observed total and free phenytoin concentrations well. Plots of ETAs for the PK parameters Vmax and Km
versus study covariates did not suggest any visible relationships. Thus, none of the covariates (including concomitant medication data) were tested or included during model building.
Phenytoin population PK model evaluation
The PK parameter estimates using observed total and free phenytoin concentrations had good precision except for oral absorption (Ka) for the immediate-release formulation and
interindividual variability on Vmax, which had relative standard errors of 93% and 70%,
respectively (Table 2). The relative standard errors around the remaining parameter point estimates were 4% to 41%. The median bootstrap estimates were within 13% of the original population estimates for all parameters. The 2.5th and 97.5th percentiles were narrow for all the parameters. In the goodness of fit plots, there was a slight bias toward overprediction at low observed concentrations for total phenytoin levels, but no obvious trends or model misspecification for free phenytoin levels (Figure 1). Visual predictive check also revealed a good fit of the observed phenytoin concentrations with 12% of observed total phenytoin concentrations and 8.2% of observed free phenytoin concentrations falling outside the 90% prediction interval.
Assessment of phenytoin efficacy, safety, and concentration–response relationships
Among the 93 epilepsy patients exposed to phenytoin, 44 (47%) had at least one seizure and 62 (67%) had an adverse event. Multiple seizures were experienced by 7 (7.5%) patients during the study period. Simulated average daily phenytoin concentrations in patients on days without seizures did not differ from concentrations in patients on days with seizures (median [IQR] 16.8 μg/mL [11.0-22.9] vs. 14.1 μg/mL [6.2-22.4], p = 0.08).
The most common adverse event was anemia (65%), followed by thrombocytopenia (28%) and leukopenia (1%). The median (IQR) simulated average daily total phenytoin
concentration was 13.7 μg/mL (7.9–21.0) in patients who had anemia versus 11.3 μg/mL (4.6–19.0) in patients who had no anemia (p = 0.004). No relationships were seen between the development of thrombocytopenia or leukopenia and simulated phenytoin
concentrations.
Determination of the phenytoin therapeutic index
The lowest total and free phenytoin concentration intervals with at least 50% of patients developing any adverse event, representing the median TD50 interval, were 10–14.9 μg/mL and 1.0–1.49 μg/mL, respectively (Figure 2). The lowest total and free phenytoin
concentration intervals with at least 50% of patients remaining seizure-free, representing the median ED50 interval, were 10–14.9 μg/mL and 1.0–1.49 μg/mL, respectively. Based on these values, the TIs of total and free phenytoin were estimated to be 0.7–1.5.
A
uthor Man
uscr
ipt
A
uthor Man
uscr
ipt
A
uthor Man
uscr
ipt
A
uthor Man
uscr
Lamotrigine cohort characteristics and observed concentrations
A total of 53 lamotrigine serum concentrations were identified from 45 patients with epilepsy who were admitted to a Duke University Health System hospital during the study period. The study demographics were comparable with the patient population from the population PK model selected from the literature (Table 1)31.(31) Patients had a median (IQR) age of 43 years (31–50) and average of 1.2 lamotrigine concentrations per subject. Among all subjects, the median (range) lamotrigine concentration was 5.4 (0.2–67.1) μg/mL. Only one patient was taking carbamazepine, four patients were taking valproate, and three patients were taking phenytoin concomitantly during the study period.
Estimation of lamotrigine PK parameters and population PK model evaluation
Using the lamotrigine drug monitoring data and concomitant medication data, the published 1-compartment model produced PK parameter estimates that had good precision and were comparable to the estimates from the published model (Table 3)31.(31) The relative standard errors around the parameter point estimates were 11% to 23%. The median bootstrap estimates were within 15% of original population estimates for all parameters. The 2.5th and 97.5th percentiles were narrow for all the parameters. There were no obvious trends or model misspecification demonstrated in the goodness of fit plots (Figure 3). Visual predictive check also revealed a good fit of the observed lamotrigine concentrations, with only 11% of observed concentrations falling outside of the 90% prediction interval.
Assessment of lamotrigine efficacy, safety, and concentration–response relationships
Among the 45 epilepsy patients exposed to lamotrigine, 12 (27%) had at least one seizure and 9 (20%) had an adverse event. Multiple seizures were experienced by 7 (16%) patients during the study period. Simulated average daily lamotrigine concentrations in patients on days without seizures did not differ from concentrations in patients on days with seizures (median [IQR] 7.4 μg/mL [4.7-9.7] vs. 8.5 μg/mL [7.4-8.9], p = 0.16).
The most common adverse event was anemia (18%), followed by thrombocytopenia (11%) and leukopenia (4%). Among patients who had an adverse event, the median (IQR) simulated daily average lamotrigine concentration was 7.5 μg/mL (4.9–12.3) compared to 7.6 μg/mL (4.7–9.4) in patients who had no adverse events. No significant relationships between lamotrigine levels and hematocrit, platelet count, or white blood cell counts were observed.
Determination of lamotrigine therapeutic index
Of the five lamotrigine concentration intervals, none of the four lowest intervals
encompassing concentrations of 0–19.9 μg/mL had 50% or more patients developing any adverse event. There was only one patient with a simulated concentration in the highest interval of >20 μg/mL, and this patient also did not have an adverse event.
The lowest lamotrigine concentration interval with at least 50% of patients remaining seizure-free, representing the ED50 interval, was 0–4.9 μg/mL. However, the TD50 interval could not be determined because none of the concentration intervals had 50% or more
A
uthor Man
uscr
ipt
A
uthor Man
uscr
ipt
A
uthor Man
uscr
ipt
A
uthor Man
uscr
patients developing any adverse events. Therefore, the TI could not be estimated for lamotrigine.
DISCUSSION
This study demonstrates the successful use of TDM and other EHR data in the development of a population PK model in patients treated with phenytoin for epilepsy. The use of
population PK modeling allowed the simulation of phenytoin concentrations not captured by routine TDM and successfully identified concentration ranges associated with phenytoin safety and efficacy. These steps ultimately resulted in the successful determination of the TI of phenytoin.
The therapeutic ranges determined in this study for total phenytoin concentrations of 10–15 μg/mL and free phenytoin concentrations of 1.0–1.5 μg/mL were consistent with published therapeutic ranges of 10–20 μg/mL total phenytoin and 1–2 μg/mL free phenytoin
concentrations13,34,35.(13, 34, 35) Using these ranges, a TI of 0.7–1.5 was calculated, which is consistent with the well-accepted classification of phenytoin as a narrow TI drug35,36.(35, 36)
Successful demonstration of the study methods for determining the TI of a drug was possible by using phenytoin as an example. However, for other drugs, the therapeutic ranges in humans have not been established with no consensus regarding therapeutic or toxic concentrations. Because data for these drugs are lacking, determining narrow TI classification is challenging.
Regulatory agencies, experts, and industry advocates have proposed definitions of NTI drugs based on a variety of criteria, including drug dosing, drug concentrations, within-subject variability in PK response, therapeutic indication, frequency of serious drug adverse events, and other patient- or drug-specific criteria1,37–41.(1, 3, 37-41) Although concentration– response relationship evaluation is now a routine component in drug review, for drug products that have long been on the market, a quantitative evaluation is lacking on the effect of inter-individual variability in PK or the biochemical and physiological effects of the drug. Inter-individual variability in these parameters can have wide-ranging effects on the drug concentration–response relationship and would significantly affect a drug's therapeutic range and toxicity profile42.(42) Population PK modeling and simulation, as used in this study, allows the identification and incorporation of this inter-individual variability when determining a drug's TI. Population PK models are especially useful when there is sparse sample availability, which is seen with therapeutic drug monitoring43.(43)
Our simulations successfully identified associations between total and free phenytoin levels with development of anemia. Though rare, the association between phenytoin and
megaloblastic anemia secondary to folate-deficiency has been well described44–46.(44-46) Several mechanisms have been proposed for this observation, including inhibition of folate transport proteins and induction of hepatic metabolism by phenytoin47,48.(47, 48) The simulations were unable to detect associations between phenytoin concentrations and thrombocytopenia. Cases of phenytoin-induced thrombocytopenia are rare49,50.(49, 50)
A
uthor Man
uscr
ipt
A
uthor Man
uscr
ipt
A
uthor Man
uscr
ipt
A
uthor Man
uscr
Similar to other types of drug-induced thrombocytopenia, the mechanism is thought to be an idiosyncratic, immune-mediated destruction of platelets occurring at any time during drug exposure independent of dose49,50.(49, 50) Drug-induced agranulocytosis leading to leukopenia is extremely rare, with an incidence of 3.46:1 million and a case-fatality rate of 7% for all causes of acquired disease51.(51) To detect an association between phenytoin concentrations and agranulocytosis, much larger sample sizes are needed.
For lamotrigine, this study demonstrated a successful fit of existing TDM data to an existing population PK model from the literature31.(31) Simulations performed using this model allowed simulation of concentrations not captured by routine TDM and allowed for the evaluation of potential concentration–response relationships. Because the sample size was small, however, this study methodology was limited in the ability to estimate a therapeutic range and the TI for lamotrigine. Related to the small sample size, few of the patients in the study suffered AEs despite nonrestrictive study inclusion criteria that would include data from intoxicated patients if present. Only one patient had a simulated lamotrigine concentration >20 μg/mL, and none of the concentration intervals below this value had >50% patients develop at least one AE. Although the therapeutic range for lamotrigine is considered by experienced neurologists to be 3–14 μg/mL, correlation between lamotrigine levels and efficacy has been poorly demonstrated at concentrations <15 μg/mL52.(52) Overall toxicity with lamotrigine, however, increases gradually with increasing serum concentrations with a steep increase in the rate of adverse events observed with
concentrations above 13–14 μg/mL52,53.(52, 53) In a large-scale observational retrospective study (N = 811), lamotrigine concentrations associated with side effects leading to a decrease in dose or change to an alternative AED in approximately 50% of the population were 20 μg/mL52.(52) Lamotrigine concentrations associated with efficacy (seizure-free at six months) in approximately 50% of the population ranged from 1 to 15 μg/mL52.(52) Although we were unable to estimate the TI in our study, the estimated TI for lamotrigine based on the approximate values from this large-scale study is likely in the range of 1.3-2052.(52)
Examination of the concentration–response relationship did not find any association between lamotrigine levels and hematocrit, platelet count, or white blood cell count. The small sample size and potential confounding by concomitant medications and comorbidities in this study would have limited the ability to detect a relationship between these counts and lamotrigine levels. Although blood dyscrasias associated with lamotrigine use have been reported, these are rare events and would require large numbers of patients to detect associations with lamotrigine concentrations54,55.(54, 55)
For the calculation of the TI, how the concentration intervals are defined will affect the estimation of the TD50 and ED50, and therefore affect the estimation of the TI range. Using smaller intervals to determine the TD50 and ED50 will result in better precision in the estimation of the TI but will require larger sample sizes to adequately power the analyses. Larger intervals for TD50 and ED50 may be required for studies with smaller sample sizes; however, this will result in a large TI range.
A
uthor Man
uscr
ipt
A
uthor Man
uscr
ipt
A
uthor Man
uscr
ipt
A
uthor Man
uscr
This study has several strengths. Because the study capitalizes on TDM and clinical practice data recorded per standard of care, the study could be completed efficiently with less than minimal risk to study subjects. The retrospective cohort design also allows for a better analysis of multiple outcomes. The small sample size, particularly for the lamotrigine cohort, may have limited the ability to detect relationships between concentrations and adverse events, especially since many of the adverse events of interest are rare. However, the sample size was sufficient to successfully develop population PK models and perform simulations based on those models. Because of the retrospective study design, individual patient risk statuses could not be assessed. These include underlying cause of epilepsy, other comorbidities, and concomitant medications that could contribute to failure of therapy or development of adverse events. Despite these limitations, the use of TDM and clinical practice data to aid in classification of drugs with NTI is a promising and minimal-risk approach for determining a drug's TI.
CONCLUSIONS
An approach using TDM data and clinical practice data from electronic health records combined with population PK methodologies resulted in an estimation of phenytoin's TI consistent with its classification as a narrow TI drug. Although a population PK model for lamotrigine was successfully developed, the same approach was unable to determine the TI of lamotrigine. This highlights the importance of addressing sample size limitations and need for accurate characterization of the concentration–response relationship prior to implementation of this methodology. The use of TDM and clinical practice data in large cohorts to determine the TI of drugs and aid in classification of narrow TI status is a promising and minimal-risk approach.
Acknowledgments
Conflicts of Interest and Source of Funding
Funding for this manuscript was made possible, in part, by the US Food and Drug Administration through grant 1U01FD004858-01. Views expressed in written materials or publications and by speakers and moderators do not necessarily reflect the official policies of the Department of Health and Human Services nor does any mention of trade names, commercial practices, or organization imply endorsement by the United States Government.
LCK receives salary support for research from the National Institutes of Health training grants (T32GM086330-03, 5T32HD043029-13, and 4K12HD043494-14).
RGG receives salary support for research from the National Institutes of Health training grants (5T32HD043728-10 and 5T32HD043029-13).
KDH Receives research support from industry for drug development in children (www.dcri.duke.edu/research/ coi.jsp), from the nonprofit Mend-A-Heart Foundation (www.medaheart.org), and from the National Center for Advancing Translational Sciences of the NIH (UL1TR001117).
CPH receives salary support for research from the National Center for Advancing Translational Sciences of the National Institutes of Health (UL1TR001117).
MCW receives support for research from the NIH (1R01-HD076676-01A1), the National Center for Advancing Translational Sciences of the NIH (UL1TR001117), the National Institute of Allergy and Infectious Disease (HHSN272201500006I and HHSN272201300017I), the National Institute for Child Health and Human Development of the NIH (HHSN275201000003I), the Food and Drug Administration (1U01FD004858-01), the Biomedical Advanced Research and Development Authority (BARDA) (HHSO100201300009C), the nonprofit
A
uthor Man
uscr
ipt
A
uthor Man
uscr
ipt
A
uthor Man
uscr
ipt
A
uthor Man
uscr
organization Thrasher Research Fund (www.thrasherresearch.org), and industry for drug development in adults and
children (www.dcri.duke.edu/research/coi.jsp).
REFERENCES
1. Levy G. What are narrow therapeutic index drugs? Clin Pharmacol Ther. 1998; 63:501–505. [PubMed: 9630822]
2. Tamargo J, Le Heuzey JY, Mabo P. Narrow therapeutic index drugs: a clinical pharmacological consideration to flecainide. Eur J Clin Pharmacol. 2015; 71:549–567. [PubMed: 25870032] 3. Yu LX, Jiang W, Zhang X, et al. Novel bioequivalence approach for narrow therapeutic index drugs.
Clin Pharmacol Ther. 2015; 97:286–291. [PubMed: 25669762]
4. Hottinger M, Liang BA. Deficiencies of the FDA in evaluating generic formulations: addressing narrow therapeutic index drugs. Am J Law Med. 2012; 38:667–689. [PubMed: 23356099] 5. Shaw SJ, Hartman AL. The controversy over generic antiepileptic drugs. J Pediatr Pharmacol Ther.
2010; 15:81–93. [PubMed: 22477799]
6. Crawford P, Feely M, Guberman A, et al. Are there potential problems with generic substitution of antiepileptic drugs? A review of issues. Seizure. 2006; 15:165–176. [PubMed: 16504545] 7. Makus KG, McCormick J. Identification of adverse reactions that can occur on substitution of
generic for branded lamotrigine in patients with epilepsy. Clin Ther. 2007; 29:334–341. [PubMed: 17472825]
8. Andermann F, Duh MS, Gosselin A, et al. Compulsory generic switching of antiepileptic drugs: high switchback rates to branded compounds compared with other drug classes. Epilepsia. 2007; 48:464–469. [PubMed: 17346246]
9. Shin JW, Chu K, Jung KH, et al. Switching between phenytoin generics in patients with epilepsy may lead to increased risk of breakthrough seizure: chart analysis and practice recommendations. Int J Clin Pharmacol Ther. 2014; 52:1017–1022. [PubMed: 25295717]
10. Liow K, Barkley GL, Pollard JR, et al. American Academy of N. Position statement on the coverage of anticonvulsant drugs for the treatment of epilepsy. Neurology. 2007; 68:1249–1250. [PubMed: 17438213]
11. Privitera MD, Welty TE, Gidal BE, et al. Generic-to-generic lamotrigine switches in people with epilepsy: the randomised controlled EQUIGEN trial. Lancet Neurol. 2016; 15:365–372. [PubMed: 26875743]
12. Ting TY, Jiang W, Lionberger R, et al. Generic lamotrigine versus brand-name Lamictal bioequivalence in patients with epilepsy: a field test of the FDA bioequivalence standard. Epilepsia. 2015; 56:1415–1424. [PubMed: 26201987]
13. Patsalos PN, Berry DJ, Bourgeois BF, et al. Antiepileptic drugs—best practice guidelines for therapeutic drug monitoring: a position paper by the subcommission on therapeutic drug monitoring, ILAE Commission on Therapeutic Strategies. Epilepsia. 2008; 49:1239–1276. [PubMed: 18397299]
14. GlaxoSmithKline, LLC. LAMICTAL—Lamotrigine Tablet; LAMICTAL—Lamotrigine Tablet, Chewable; LAMICTAL ODT—Lamotrigine Tablet, Orally Disintegrating; LAMICTAL— Lamotrigine; LAMICTAL ODT—Lamotrigine.
15. Horvath MM, Winfield S, Evans S, et al. The DEDUCE Guided Query tool: providing simplified access to clinical data for research and quality improvement. J Biomed Inform. 2011; 44:266–276. [PubMed: 21130181]
16. Keizer RJ, van Benten M, Beijnen JH, et al. Pirana and PCluster: a modeling environment and cluster infrastructure for NONMEM. Comput Methods Programs Biomed. 2011; 101:72–79. [PubMed: 20627442]
17. Lindbom L, Ribbing J, Jonsson EN. Perl-speaks-NONMEM (PsN)—a Perl module for NONMEM related programming. Comput Methods Programs Biomed. 2004; 75:85–94. [PubMed: 15212851] 18. Jonsson EN, Karlsson MO. Xpose—an S-PLUS based population pharmacokinetic/
pharmacodynamic model building aid for NONMEM. Comput Methods Programs Biomed. 1999; 58:51–64. [PubMed: 10195646]
19. Wickham, H. ggplot2: Elegant Graphics for Data Analysis. Springer; New York, NY: 2009.
A
uthor Man
uscr
ipt
A
uthor Man
uscr
ipt
A
uthor Man
uscr
ipt
A
uthor Man
uscr
20. Sarkar, D. Lattice: Multivariate Data Visualization with R. 1st ed.. Springer; New York, NY: 2008. 21. Saavedra IN, Aguilera LI, Faure E, et al. Phenytoin/clonazepam interaction. Ther Drug Monit.
1985; 7:481–484. [PubMed: 4082246]
22. Hung CC, Lin CJ, Chen CC, et al. Dosage recommendation of phenytoin for patients with epilepsy with different CYP2C9/CYP2C19 polymorphisms. Ther Drug Monit. 2004; 26:534–540.
[PubMed: 15385837]
23. Valodia PN, Seymour MA, McFadyen ML, et al. Validation of population pharmacokinetic parameters of phenytoin using the parallel Michaelis-Menten and first-order elimination model. Ther Drug Monit. 2000; 22:313–319. [PubMed: 10850399]
24. Valodia P, Seymour MA, Miller R, et al. Factors influencing the population pharmacokinetic parameters of phenytoin in adult epileptic patients in South Africa. Ther Drug Monit. 1999; 21:57– 62. [PubMed: 10051055]
25. Chan E. Single-point phenytoin dosage predictions in Singapore Chinese. J Clin Pharm Ther. 1997; 22:47–52. [PubMed: 9292403]
26. Deleu D, Aarons L, Ahmed IA. Estimation of population pharmacokinetic parameters of free-phenytoin in adult epileptic patients. Arch Med Res. 2005; 36:49–53. [PubMed: 15777995] 27. Grasela TH, Sheiner LB, Rambeck B, et al. Steady-state pharmacokinetics of phenytoin from
routinely collected patient data. Clin Pharmacokinet. 1983; 8:355–364. [PubMed: 6617043] 28. Ratanakorn D, Kaojarern S, Phuapradit P, et al. Single oral loading dose of phenytoin: a
pharmacokinetics study. J Neurol Sci. 1997; 147:89–92. [PubMed: 9094065]
29. Gugler R, Manion CV, Azarnoff DL. Phenytoin: pharmacokinetics and bioavailability. Clin Pharmacol Ther. 1976; 19:135–142. [PubMed: 1261151]
30. U.S. Food and Drug Administration, Office of Generic Drugs, Division of Bioequivalence. Phenytoin Sodium ANDA 40-298 Bioequivalence Review(s). Aug 17.1998
31. Rivas N, Buelga DS, Elger CE, et al. Population pharmacokinetics of lamotrigine with data from therapeutic drug monitoring in German and Spanish patients with epilepsy. Ther Drug Monit. 2008; 30:483–489. [PubMed: 18641550]
32. Wang DD, Zhang S. Standardized visual predictive check versus visual predictive check for model evaluation. J Clin Pharmacol. 2012; 52:39–54. [PubMed: 21257797]
33. Winter, ME.; Tozer, TN. Phenytoin.. In: Burton, ME.; Shaw, LM.; Schentag, JJ., et al., editors. Applied Pharmacokinetics & Pharmacodynamics: Principles of Therapeutic Drug Monitoring. 4th ed.. Lippincott Williams & Wilkins; Baltimore: 2006. p. 463-490.
34. Krasowski MD, Penrod LE. Clinical decision support of therapeutic drug monitoring of phenytoin: measured versus adjusted phenytoin plasma concentrations. BMC Med Inform Decis Mak. 2012; 12:7. [PubMed: 22333264]
35. von Winckelmann SL, Spriet I, Willems L. Therapeutic drug monitoring of phenytoin in critically ill patients. Pharmacotherapy. 2008; 28:1391–1400. [PubMed: 18956999]
36. Nation RL, Evans AM, Milne RW. Pharmacokinetic drug interactions with phenytoin (Part I). Clin Pharmacokinet. 1990; 18:37–60. [PubMed: 2178849]
37. Benet LZ, Goyan JE. Bioequivalence and narrow therapeutic index drugs. Pharmacotherapy. 1995; 15:433–440. [PubMed: 7479195]
38. Patnaik RN, Lesko LJ, Chen ML, et al. Individual bioequivalence. New concepts in the statistical assessment of bioequivalence metrics. FDA Individual Bioequivalence Working Group. Clin Pharmacokinet. 1997; 33:1–6.
39. Benet LZ. Relevance of pharmacokinetics in narrow therapeutic index drugs. Transplant Proc. 1999; 31:1642–1644. discussion 75-84. [PubMed: 10331032]
40. Levy G, Tsuchiya T. Salicylate accumulation kinetics in man. N Engl J Med. 1972; 287:430–432. [PubMed: 5044917]
41. The Danish Medicines Agency's “Prevention of Medication Errors” Network. Report on
“Medicines most frequently involved in serious adverse drug events”: Prepared by the “High-alert medicines” working group 2008-10. 1999
42. Food and Drug Administration. Guidance for Industry: Population Pharmacokinetics. 1999
A
uthor Man
uscr
ipt
A
uthor Man
uscr
ipt
A
uthor Man
uscr
ipt
A
uthor Man
uscr
43. Dartois C, Brendel K, Comets E, et al. Overview of model-building strategies in population PK/PD analyses: 2002-2004 literature survey. Br J Clin Pharmacol. 2007; 64:603–612. [PubMed: 17711538]
44. Verrotti A, Scaparrotta A, Grosso S, et al. Anticonvulsant drugs and hematological disease. Neurol Sci. 2014; 35:983–993. [PubMed: 24619070]
45. Lustberg A, Goldman D, Dreskin OH. Megaloblastic anemia due to dilantin therapy. Ann Intern Med. 1961; 54:153–158. [PubMed: 13764445]
46. Morrell MJ. Folic acid and epilepsy. Epilepsy Curr. 2002; 2:31–34. [PubMed: 15309159] 47. Steinweg DL, Bentley ML. Seizures following reduction in phenytoin level after orally
administered folic acid. Neurology. 2005; 64:1982. [PubMed: 15955964]
48. Hesdorffer CS, Longo DL. Drug-induced megaloblastic anemia. N Engl J Med. 2015; 373:1649– 1658. [PubMed: 26488695]
49. Moss RA. Drug-induced immune thrombocytopenia. Am J Hematol. 1980; 9:439–446. [PubMed: 6452056]
50. Wong YY, Lichtor T, Brown FD. Severe thrombocytopenia associated with phenytoin and cimetidine therapy. Surg Neurol. 1985; 23:169–172. [PubMed: 3966212]
51. Ibanez L, Vidal X, Ballarin E, et al. Population-based drug-induced agranulocytosis. Arch Intern Med. 2005; 165:869–874. [PubMed: 15851637]
52. Hirsch LJ, Weintraub D, Du Y, et al. Correlating lamotrigine serum concentrations with tolerability in patients with epilepsy. Neurology. 2004; 63:1022–1026. [PubMed: 15452293]
53. Froscher W, Keller F, Vogt H, et al. Prospective study on efficacy and concentration-toxicity: correlations with lamotrigine serum levels. Epileptic Disord. 2002; 4:49–56. [PubMed: 11967180]
54. Chiu A, Lamoure J, Naidu KR. Lamotrigine-induced blood dyscrasias in association with rash. Can J Hosp Pharm. 2007:60.
55. Mackay FJ, Wilton LV, Pearce GL, et al. Safety of long-term lamotrigine in epilepsy. Epilepsia. 1997; 38:881–886. [PubMed: 9579888]
56. Boucher BA. Fosphenytoin: a novel phenytoin prodrug. Pharmacother. 1996; 16:777–791. 57. Peterson GM, McLean S, Aldous S, et al. Plasma protein binding of phenytoin in 100 epileptic
patients. Br J Clin Pharmacol. 1982; 4:298–300.
A
uthor Man
uscr
ipt
A
uthor Man
uscr
ipt
A
uthor Man
uscr
ipt
A
uthor Man
uscr
Figure 1.
Phenytoin population PK model diagnostic plots. A) Total phenytoin; B) Free phenytoin
A
uthor Man
uscr
ipt
A
uthor Man
uscr
ipt
A
uthor Man
uscr
ipt
A
uthor Man
uscr
Figure 2.
Percentage of patients developing ≥1 adverse event or remaining seizure-free within daily average phenytoin concentration intervals. A) Total phenytoin; B) Free phenytoin.
A
uthor Man
uscr
ipt
A
uthor Man
uscr
ipt
A
uthor Man
uscr
ipt
A
uthor Man
uscr
Figure 3.
Lamotrigine population PK model diagnostic plots.
A
uthor Man
uscr
ipt
A
uthor Man
uscr
ipt
A
uthor Man
uscr
ipt
A
uthor Man
uscr
A
uthor Man
uscr
ipt
A
uthor Man
uscr
ipt
A
uthor Man
uscr
ipt
A
uthor Man
uscr
ipt
Table 1
Cohort Demographics and Baseline Characteristics
Phenytoin Lamotrigine
N=93 Study Cohort N=45
Rivas, et al. cohort N=600
Male, % 51 51 56
Age, years* 61 (49, 71) 43 (31, 50) 38-39 (26.8, 51.3)**
Body weight, kg* 78 (67, 91) 78.5 (65.8, 99.3) 70.0-76.0 (61.8, 85.0)**
White race, % 53 64 NR
Hematocrit* 0.32 (0.27, 0.36) 0.36 (0.28, 0.41) NR
White blood cell count, ×103/ml* 9.80 (7.75, 12.85) 8.90 (5.70, 11.45) NR
Platelet count, ×103/ml* 208.5 (138.0, 276.5) 217.0 (140.5, 269.0) NR
Concomitant medication usage, %
Carbamazepine 1.1 2.2 15
Valproate 0 8.9 29
Phenobarbital 7.5 0 5.1
Diazepam 6.5 0 NR
Clonazepam 14 0 NR
Fluconazole 5.4 0 NR
Phenytoin NA 6.7 NR
NA, not applicable; NR, not reported
*
Data presented as median (25th, 75th percentile)
**
A
uthor Man
uscr
ipt
A
uthor Man
uscr
ipt
A
uthor Man
uscr
ipt
A
uthor Man
uscr
ipt
T ab le 2 Phenytoin Estimation of PK P
arameters Final Model Bootstrap (n=1000) Published V alues P arameter P
oint Estimate (RSE)
IIV
, CV% (RSE)
Shrinkage (%)
2.5
th P
er
centile
Median
97.5
th P
er
centile
P
oint Estimate (Refer
ences)
Structural Model
Ka1 (1/h), fosphen
ytoin 1.99 (19%) NE N A 1.62 2.07 5.65 2.772 (56)
Ka2 (1/h), oral PHT for f
ast release 0.459 (93%) NE N A 0.24 0.44 0.53 0.513 (28)
Ka3 (1/h), oral PHT for e
xtended release 1.7 FIX NE N A N A N A N A -Vmax (mg/h) * 19.3 (7%) 37.8 (70%) 52 18.2 20.4 23.4
7.47 – 32.8 (22-26, 28)
Km (mg/L) 5 FIX 170 (41%) 39 N A N A N A
2.18 – 8.15 (22-26)
V (L) * 78.6 (5%) 33.9 (26%) 20 67.3 76.5 87.6
35 – 109.2 (28)
F
, oral PHT
0.859 FIX NE N A N A N A N A 0.859 (29)
Duration of zero order release (h)
1.1 FIX NE N A N A N A N A
-Fu, unbound fraction of PHT
0.112 (4%) 25.8 (26%) 21 0.10 0.11 0.12 0.12 (57) Residual V ariability
Proportional error for total and free PHT
17.1 (4%) N A 22 14.8 16.9 19.0 8.6-12 (27) F , bioa v
ailability; Fu, fraction unbound; Ka1, rate constant for fosphen
ytoin con
v
erting to phen
ytoin; Ka2, absorption constant for oral phen
ytoin f
ast release formulation; Ka3, absorption constant for oral
phen
ytoin e
xtended release formulation; K
m
, Michaelis constant; N
A, not applicable; NE, not estimated; PHT
, phen
ytoin; V
, v
olume of distrib
ution; V
max
, maximal v
elocity
.
* Published v
alues of PK parameters were con
v
erted to parameter v
A
uthor Man
uscr
ipt
A
uthor Man
uscr
ipt
A
uthor Man
uscr
ipt
A
uthor Man
uscr
ipt
T ab le 3Lamotrigine De No
v
o Estimation of PK P
arameters
Study Cohort Estimates
Bootstrap (n=1000)
Ri
v
as, et al. Study Estimates
P
arameters
P
oint Estimate (RSE)
IIV
, CV% (RSE)
2.5
th P
er
centile
Median
97.5
th P
er
centile
P
oint Estimate (RSE)
IIV
, CV% (RSE)
θ
1 (CL), L/h/kg
* 0.0234 (11%) 62.4% (15%) 0.0164 0.0231 0.0295 0.028 (2.1%) 27.5% (9.4%) V , L/kg 1.19 (23%) 154.9% (15%) 0.40 1.15 2.45 1.5 Fix ed NE Ka, 1/h 1.3 Fix ed NE N A N A N A 1.3 Fix ed NE θ 2 (VP A) −0.713 Fix ed N A N A N A N A −0.713 (7.7%) N A θ 3 (PHT) 0.663 Fix ed N A N A N A N A 0.663 (10%) N A θ
4 (PB or PRM)
0.588 Fix ed N A N A N A N A 0.588 (8.7%) N A θ 5 (CBZ) 0.467 Fix ed N A N A N A N A 0.467 (30%) N A θ 6 (IND) 0.864 Fix ed N A N A N A N A 0.864 (12%) N A Additi v
e residual error
1.46 (39%) N A 0.31 1.25 4.14 1.25 (8.2%) N A
CBZ, carbamazepine; CL, clearance; CV
, coef
ficient of v
ariation; IND, 2 or more concomitant medications (inducers); Ka, absorption constant for lamotrigine; N
A, not applicable; NE, not estimated; PB,
phenobarbital; PRM, primidone; PHT
, phen
ytoin; RSE, relati
v
e standard error; V
, v
olume of distrib
ution; VP
A, v
alproic acid.
* CL (L/h) =
θ
1 * BW * e
− θ 2*VP A*e θ 3*PHT *e θ
4*(PB or PRM)