Low-frequency radio study of MACS clusters at 610 and
235 MHz using the GMRT
Surajit Paul
1
,
2
?
, Sameer Salunkhe
1
, Abhirup Datta
3
and Huib T. Intema
4
,
5
1Department of Physics, Savitribai Phule Pune University, Pune 411007, India
2Inter University Centre for Astronomy and Astrophysics, Pune 411007, India
3Centre of Astronomy, Indian Institute of Technology Indore, Simrol, Khandwa Road, Indore 453552, India
4Leiden Observatory, Leiden University, Niels Bohrweg 2, 2333 CA, Leiden, The Netherlands
5International Centre for Radio Astronomy Research – Curtin University, GPO Box U1987, Perth, WA 6845, Australia
Accepted XXX. Received YYY; in original form ZZZ
ABSTRACT
Studies have shown that mergers of massive galaxy clusters produce shocks and turbulence in the intra-cluster medium, the possible event responsible for creating observed radio relics, as well as the halo structures. Here we present GMRT dual-band (235 and 610 MHz) radio observations of four such merging cluster candidates from the MAssive Cluster Survey (MACS) catalogue. Clusters are chosen from their disturbed morphology in X-ray and elongated mass distribution in weak lensing study to ensure their merging state. Among the proposed four clusters, three of them are detected with diffuse radio emission. We report a flat spectrum (α∼ −1.15), giant (∼1.6 Mpc each) rare halo-relic system at low frequency radio waves from a previously known radio loud cluster MACSJ0014.3-3022 (commonly known as Abell 2744). Our observations have also revealed an ongoing second merger along with a close-by high-speed (1769±148 359 km s−1) merger-shock (M=2.02±17
41), thus providing a possible clue to the halo-relic co-existence. We also report the detection of very faint, diffuse radio relic like sources with size of about 0.4-0.5 Mpc in MACSJ0025.4-1222 (previously reported at 325 MHz) and MACSJ0152.5-2852 clusters. In both these clusters, proposed relics are found well inside the virial radius instead of their usual peripheral location, but, having no halos associated. These high-redshift objects (z=0.584 and 0.413) are possibly among the few known early and young merging galaxy clusters. We also report the non-detection of diffuse radio emission from the MACSJ1931-2635 cluster at the reported rms levels in our study.
Key words: (cosmology:) large-scale structure of Universe; observations – galaxies:
clusters: general – radiation mechanisms: non-thermal; shock waves – radio continuum: general
1 INTRODUCTION
Clusters of galaxies are the largest (∼ Megaparsec scale),
gravitationally bound structures in the Universe. They are in general in thermal equilibrium and are prominent X-ray sources (Sarazin 1986). But, some of them are also
detected at radio wavelengths (for review: Feretti et al.
2012; Giovannini et al., 1999), confirming the presence of cosmic-ray electrons and magnetic fields in the Intra-Cluster Medium (ICM). Radio sources connected to the ICM are mostly diffuse in nature, and have relatively steep spectra
? E-mail: (SP) [email protected]
(α .−0.5; van Weeren et al. 2009), suggesting ageing of the emitting particles (Feretti et al. 2012). This, in general, connects the emission to the Compton-synchrotron process where the highest energy electrons lose their energy more quickly during gyrations in magnetic fields present in the
ICM (Bonafede et al. 2012; Nuza et al., 2012), known as
ageing effect, that makes energy spectrum steeper. Steepen-ing of the spectrum may also be related to the nature of the injection spectra due to the frequency dependence of particle acceleration mechanisms (Stroe, et al. 2014).
Diffuse radio sources are observed in a number of galaxy
clusters (cf. review by Feretti et al. (2012)). These radio
sources are not directly associated with the individual
ies inside the cluster. Among them, the large-scale (l&500 kpc) diffuse radio sources are commonly divided into two broad classes, ‘radio halos’ and ‘radio relics’ (Kale et al. 2016; Feretti et al. 2012; Giovannini et al., 1999; Ensslin et al. 1998). Radio halos have smooth morphology, are ex-tended with sizes&1 Mpc, steep spectrum, un-polarized and having low surface brightness (∼0.1 - 1µJy arcsec−2 at 1.4 GHz; Giovannini et al. 2009; Feretti & Giovannini 2008), and are permeating the central volume of clusters almost co-spatial with the thermal X-ray emitting gas of the ICM (e.g. Abell 2219, Abell 2163 etc.Orr´u et al. 2007;Feretti et al. 2001). Giant radio relics on the other hand, are mostly found at the periphery of the clusters, with sizes up to sev-eral Mpc, comparatively flatter spectrum and are highly
po-larized (p∼10−50%at 1.4 GHz;van Weeren et al. 2009).
Though, the origin of thermal energy and X-rays in clus-ter of galaxies is quite explainable (Borgani & Guzzo 2001; Sarazin 1986), the exact origin of spectacular Mpc scale ra-dio structures such as cluster peripheral relics, bow shock relics or giant radio halos etc. posses a tough challenge to the scientists.
Since, radio synchrotron emission from galaxy clusters
is a transient phenomena (∼0.5 Gyr) on cosmological time
scales (Cassano et al. 2016), it is definitely connected to the dynamical states of the systems (Donnert et al. 2013; Paul 2012;Cassano et al. 2011;Rephaeli et al. 2008). The-oretically, in the large-scale structure formation framework, before attaining virialization, galaxy clusters pass through phases of continuous accretion and series of events of merg-ers of bigger and bigger galaxy groups (Sarazin 2002). Merg-ers are extremely energetic process and the energy released during mergers (ranging 1063−65erg s−1, depending on merg-ing masses and impact angle) is dissipated in the ICM by thermalizing it through strong collision-less shocks (Sarazin 1986). These strong shocks with an efficient Fermi acceler-ation (of energetic charged particles), could generate strong MHD waves in the upstream and downstream regions of shocks and can strongly amplify the upstream magnetic field present in the ICM (Iapichino & Br¨uggen 2012;Bykov et al. 2008). This also transforms kinetic energy to turbulent en-ergy by injecting volume-filling turbulence (Subramanian et al. 2006). Particle acceleration due to Diffusive Shock Accel-eration (DSA) and magnetic field amplification due to shock compression is found to be highest at the shock fronts of
high Mach number (Iapichino & Br¨uggen 2012;van Weeren
et al. 2010). Therefore, shock fronts are expected to be de-tected well at radio frequencies, mainly in the peripheral
regions (Brown et al. 2011;Paul et al. 2011). Turbulent
re-acceleration supposed to dominate at the central part of the clusters, where the level of merger induced turbulent energy, availability of charged particles as well as fossil cosmic rays is very high, therefore produce the radio halo emission (Paul et al. 2018;Pinzke et al. 2017;Brunetti et al. 2001). The ori-gin of both halos and relics would therefore be attributed to
the mergers of galaxy clusters (Paul et al. 2018A;Nuza et
al. 2017;Skillman et al. 2011;Paul et al. 2011;Cassano et al. 2010;Hoeft et al., 2007).
As, these structures are considered to be the direct con-sequence of major galaxy cluster mergers, they are mainly related to massive systems. In this study, we thus chose
clus-ters from the MAssive Clusclus-ters Survey (MACS;Ebeling et
al. 2010;Horesh et al. 2010;Ebeling et al. 2001) catalogue.
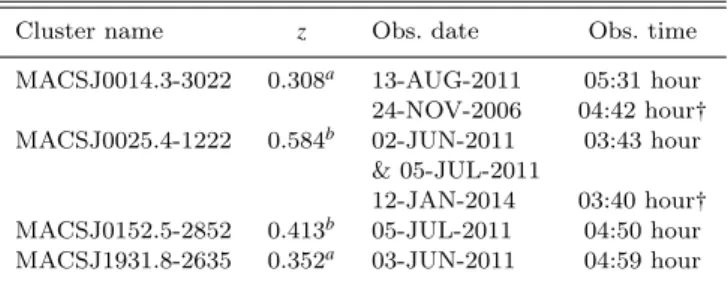
Table 1.Observation details
Cluster name z Obs. date Obs. time
MACSJ0014.3-3022 0.308a 13-AUG-2011 05:31 hour 24-NOV-2006 04:42 hour†
MACSJ0025.4-1222 0.584b 02-JUN-2011 03:43 hour & 05-JUL-2011
12-JAN-2014 03:40 hour†
MACSJ0152.5-2852 0.413b 05-JUL-2011 04:50 hour MACSJ1931.8-2635 0.352a 03-JUN-2011 04:59 hour Col. 1: cluster name
Col. 2: redshift (a:Ebeling et al.(2010),b:Horesh et al.(2010), Col. 3: GMRT Observation date and Col. 4: On-source observation time
†This is an archival GMRT data at 325 MHz
The clusters are chosen here depending on their disturbed X-ray morphology and clumpy and elongated matter distri-bution as estimated from weak and strong lensing studies to ensure its merging phase. At the time of these observa-tions, only one source i.e. MACSJ0014.3-3022, commonly known as Abell 2744, was known in radio waves. A large halo and a relic was first reported at VLA 1.4 GHz (Govoni et al. 2001a,b) Later, in MACSJ0025.4-1222 a double relic
has also been discovered at GMRT 325 MHz byRiseley et
al.(2017). We decide to perform a low-frequency radio
spec-tral and morphological study at GMRT 235 and 610 MHz as, in general, diffuse radio emission from clusters are steep
spectrum (α≤ −1.0) and expected to be better detected at
low-frequencies.
We introduce our work in Section1. Selection of
clus-ters of galaxies, observation details and data analysis are
described in Section 2. In the result Section 3, we report
our findings from each observed objects. Thereafter, we
dis-cus our findings in Section4and finally, conclude the paper
in Section 5. Cosmology used in this study is as follows:
H0=70.2km s−1M pc−1,Ωm=0.274andΩΛ=0.726.
2 OBJECT SELECTION, GMRT
OBSERVATIONS AND DATA ANALYSIS
2.1 Selected objects
The principal goal of this work is to obtain the dynamical features of a few chosen galaxy clusters through their radio morphology and spectral properties. As discussed in Sec-tion1, several studies attribute the origin of radio sources to the mergers of massive systems. Thus, we obtain deep GMRT radio maps of diffuse emissions from four massive
galaxy clusters (see Table 1) chosen from the MACS
cat-alogue. This cluster survey was designed to find the pop-ulation of strongly evolving clusters, with the most X-ray luminous systems using a specific X-ray selection function described in (Ebeling et al. 2001). From the MACS
cata-logues (up to 2010;Ebeling et al. 2007,2010) we have
se-lected clusters that are showing clear merging activity in X-ray/temperature maps and also from mass distributions
obtained from weak lensing studies (SeeZitrin et al. 2011
and Table1).
In radio waves, cluster Abell 2744 had previously been studied at high frequency with wideband VLA 1-4 GHz and
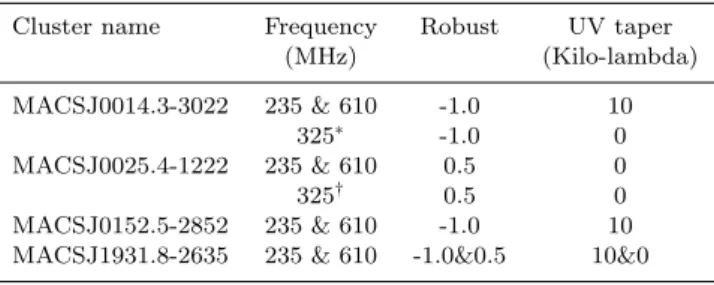
Table 2.Data analysis details
Cluster name Frequency Robust UV taper
(MHz) (Kilo-lambda)
MACSJ0014.3-3022 235 & 610 -1.0 10
325∗ -1.0 0
MACSJ0025.4-1222 235 & 610 0.5 0
325† 0.5 0
MACSJ0152.5-2852 235 & 610 -1.0 10 MACSJ1931.8-2635 235 & 610 -1.0&0.5 10&0 Col. 1: cluster name
Col. 2: Observation central frequencies Col. 3: Robust parameter used for imaging Col. 4: UV taper used in Kilo-lambda.
∗Re-analysed 325 MHz data reported inVenturi et al.(2013)
†Re-analysed 325 MHz data reported inRiseley et al.(2017)
low frequency, except 325 MHz at VLA & GMRT (Orr´u et
al. 2007;Venturi et al. 2013), no deeper radio study has been
reported yet (except our partly reported proceedingsPaul et
al. 2014). ThoughGeorge et al.(2017) has reported 88-200 MHz (GLEAM) and 150 MHz (TGSS) images both are from survey data having very poor resolution and sensitivity to study the substructures and spectral properties very accu-rately. MACSJ0025.4-1222 has also been studied previously but only at GMRT 325 MHz (Riseley et al. 2017).
2.2 GMRT observations
Observations were done with Giant Metre-wave Radio Tele-scope (GMRT) array using 235 & 610 MHz dual-band dur-ing June - August 2011 (Project Code : 20 062). Observation
details are provided in Table1. In this mode of observation
at GMRT, each frequency is observed simultaneously with only one of the polarizations. Although, the observations were recorded over 32 MHz band for both the frequencies, for 235 MHz observation, only a part of that bandwidth is available due to use of a bandpass filter. The dual-frequency observations were chosen to compute the spectral proper-ties of these sources. The GMRT is very much suitable for observing these objects, as it has both adequate short base-lines (14 antenna’s within 1 square km with shortest at 100 m) and long baselines (with the longest baseline of 26 km). Good coverage of short spacings enabled us to map the dif-fuse emission and long spacings give the high resolution to resolve the important substructures present in these objects. Each of the proposed sources was observed with almost 4-5 hours of on-source time. Special care was taken to preserve maximum possible short baselines during the observations to we properly image most of the diffuse radio emissions from these sources. Along with our dual frequency GMRT data, we have also analysed GMRT archival data of Abell 2744 and MACSJ0025.4-1222, both at 325 MHz for this study.
2.3 Data analysis
We split the LL and RR correlations to obtain two data sets at two different frequencies i.e., 235 MHz and 610 MHz from our GMRT dual frequency mode observations. For 325 MHz, combined RR-LL data was taken. Further, data anal-ysis and imaging were done with the code ’SPAM’ (for
de-tails see Intema et al. 2017) using the parameters given in
Table2. Here we mention those parameters with which we
have obtained the best images in terms of our requirements for this study. ’SPAM’ is a powerful data analysis and imag-ing pipeline that takes care of direction dependent variations (i.e. due to antenna beam pattern and due to ionosphere) in visibility amplitude and phase, across the field of view. The initial flux and bandpass calibrations were done using the source 3C48 for the target sources Abell 2744, MACSJ0152-2852 and MACSJ0025-1222 and the source 3C286 for target source MACSJ1931-2635.
High resolution images were first made with robust−1.0 to map the point and bright sources and to check for any indication of diffuse radio emission in the imaged fields. Fur-ther, to catch the diffuse emission better, UV taper at 10 Kilo lambda was used for both the frequencies. For some
images, different robust parameters (see Table2) were used
to obtain better diffuse emission or rms values as per the requirements of our study. As the observation of the ob-ject MACSJ0025-1222 was spread over two days, two data sets were combined to make a single data set for imaging.
325 MHz image of Abell 2744 was made with robust −1,
and beam was convoluted to 3500×3500 size to match the
resolution of Venturi et al. (2013). Other archival data of
MACSJ0025.4-1222 at GMRT 325 MHz was analysed with
robust0.5, same as the parameters used for 235 and 610 MHz
data for the same object. Data from only one session from Riseley et al. (2017) was taken to keep the total
observa-tion time similar to ours (see Table1). All the post-pipeline
analysis were done and measurements were taken using the Common Astronomy Software Applications (CASA) pack-age (McMullin et al. 2007).
2.4 Estimation of upper limits for the radio halos
We estimate the radio halo upper limits for the clusters in which no radio halo is detected, but found other diffuse radio emissions. In recent years, various researchers have formulated different strategies for computing upper limits for radio halos in galaxy clusters (Venturi et al. 2008; Bonafede et al. 2017; Johnston-Hollitt & Pratley 2017). Usually, as a first step, a fake radio halo is injected either as an optically thin sphere (Venturi et al. 2008), elliptical (Johnston-Hollitt & Pratley 2017) or an exponentially decreasing radio profile (Bonafede et al. 2017) with the help of specific tasks in AIPS, MIRIAD or CASA. Each of the tasks modifies the UV data set depending on the injected artificial source parameters. An image is then made from this modified UV data, and an upper limit is estimated with a criteria of bare detection of this injected halo in the final image.
In this paper, we grossly follow the method used in Bonafede et al.(2017) with slight modification. Since aver-age brightness profile for observed, nearly ideal radio halos found to fit well with the exponential curve (Murgia et al. 2009), we have injected the exponential fake radio halo
pro-files as suggested by Bonafede et al.(2017) and thereafter
computed the upper limit. The basic algorithm used by us to estimate the halo upper limit is described below.
inject-ing the mock radio halo from the correlation ofP1.4GHz and
M500given inCassano et al. 2013i.e.,
log P1.4
1024.5Watt Hz−1
=Blog M500
1014.9M
+A (1)
where A=0.125±0.076 and B=3.77±0.57 are BCES-bisector fitting parameters for ‘Radio Halo’ only data.
(ii) This radio power is used to calculate the expected size of the radio halo from direct scaling relation of 1.4 GHz radio powerP1.4GHzandRHi.e. radii of radio halos (Cassano
et al. 2007) and is given by
log P1.4
5×1024h−2 70W Hz−1
=4.18±0.68 log RH
500h−1 70k pc
−0.26±0.07 (2) The flux density corresponding to the expected power is SmockR ,in j
H i.e. injected flux.
(iii) After calibrating our 610 MHz UV data using SPAM, we take the data into AIPS. Thereafter, an expo-nential halo is injected into the uv-plane with expected radio power within the expected radius using the task UVMOD. Though we calculate the expected radio power at 1.4 GHz, corresponding value at 610 MHz has been
calculated taking the spectral index of α =−1.3 between
1.4 GHz and 610 MHz and the size of the halo is kept same, assuming no significant variation due to change in frequency. Further, we take back this modified UV data with this mock halo to SPAM and image it. This is done to keep the method of imaging consistent throughout the study.
(iv) In this final image with mock halo, a halo is said to be detected if Dmock2σ ,meas≥RH; where Dmock2σ ,meas is the size
the halo measured above 2σ and the corresponding flux is
said to beSmock2σ ,meas.
(v) Now, ifDmock2σ ,meas>RH andS2σmock,meas30%SmockRH ,in j,
then the value of flux to inject radio halo is decreased, and ifDmock2σ ,meas<RHthen the value of flux to inject radio halo
is increased.
(vi) We repeat steps 2 to 5, until we get the halo for which recovered flux is at least 30% of the injected and the total size of the halo is around the expected radius of the halo i.e. Dmock2σ ,meas&RH.
2.5 Estimation of flux error and spectral index
We compute the flux densities (S) of observed radio sources
within 3σ (σ is noise rms of the image) and flux density
errors (σS) using the usual relation i.e.,
σS= p
0.1S2+Nσ2 (3)
Where N is the number of beams covered by the total diffuse emission and0.1S(i.e. 10% ofS) is assumed to be the possible error due to calibration uncertainties.
The spectral index map has been created after re-gridding the two images of different frequencies using the
IMREGRID task of CASA. The images used for making spectral index maps are made with uniform weights. Since beam sizes are not usually the same, we convolute the beam of 610 MHz image with the beam of 235 MHz
us-ing IMSMOOTH task. The images were then masked at3σ
contour of 235 MHz image. Finally, we compute the spectral index using IMMATH with the relation
α=logSν2Sν1 logν2ν1
(4)
WhereSν# andν# (withν1>ν2 ) are the values of flux density and the frequency of observation respectively.
Further, we calculate the spectral index error with IM-MATH task using the relation given below (Kim & Trippe 2014)
αerrαν2,ν1= 1 logν2ν1
×
"
σν21
Iν21 + σν22
Iν22
#12
(5)
WithI as the total intensity at respective frequencies
at each of the pixels.
3 RESULTS
In Table3, we summarise our findings. We mention the
de-tected radio structures in the chosen clusters at different frequencies and respective rms values with the beam sizes. We also report the angular sizes of the observed diffuse ra-dio structures, corresponding flux densities and luminosities. For halos, the sizes are reported as North-South (NS) and East-West (EW) but relic sizes are taken as Largest Linear
Size (LLS) and the average width as given in the Table 3.
We also include here the values of various parameters mea-sured from the re-analysed GMRT 325 MHz archival data of two clusters, namely Abell 2744 and MACSJ0025.4-1222. The results from the individual clusters are presented below.
3.1 MACSJ0014.3-3022 or Abell 2744
The Cluster Abell 2744 is a moderately distant cluster at redshift z=0.308. This is a very hot and massive cluster with
average temperature of 8.53±0.37 keV (Mantz et al. 2010).
Radius and mass are estimated to ber500= 1.65±0.07 Mpc
and 17.6±2.31014Mrespectively (Ebeling et al. 2010).
Im-portantly, the authors found no cooling flow in the cluster but, presence of substructures in X-rays indicate an ongo-ing mergongo-ing process. Interestongo-ingly, it is also one of the HST frontier fields (Mahler et al. 2018).
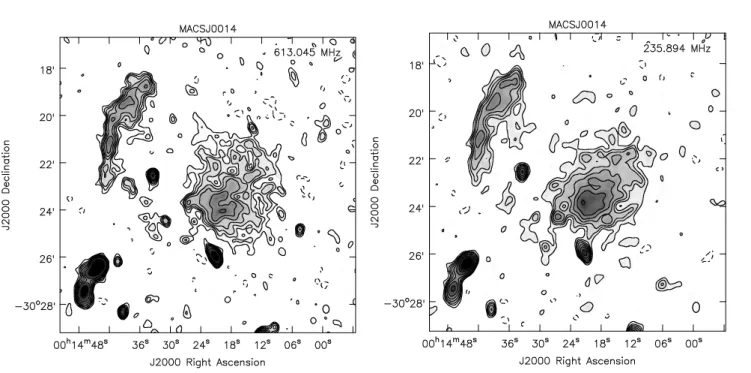
This object is known for hosting a radio halo, as well as relics, as reported in various studies (George et al. 2017; Pearce et al. 2017;Venturi et al. 2013;Orr´u et al. 2007; Gov-oni et al. 2001b). We detect both the relics and an extremely
large halo (Both Panels in Fig1) at GMRT low-frequency
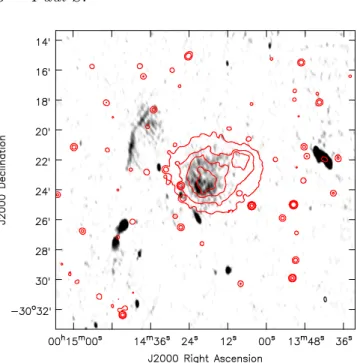
dual band observation (610 and 235 MHz). A high
resolu-tion 235 MHz map with Chandra X-ray contours (Fig. 2)
Table 3.Radio properties of the sources
Cluster name Source/ Frequency Beam size rms Size S Luminosity
Emission (MHz) (µJy beam−1) (mJy) (1024W Hz−1)
Abell 2744 Halo 610 20.6200×15.8300PA 4.27◦ 100 30000×27500 103.25±10.40 31.84±3.21
Relic A 32500×10500 46.78±4.74 14.43±1.46
Relic B 19000×3500 4.28±0.54 1.32±0.17
†
Halo 325 35.000×35.000PA 0.0◦ 450 37000×35000 307.72±30.98 89.97±9.03
Relic A 40000×15500 118.69±12.11 35.59±3.60
Relic B 16200×3900 8.62±1.33 2.15±0.30
Halo 235 25.5500×17.4200PA -2.15◦ 360 27500×27000 302.26±30.49 93.22±9.40
Relic A 32500×10000 123.05±12.61 37.94±3.89
Relic B 21500×4500 12.63±1.78 3.90±0.55
MACSJ0025 Relic 610 6.3400×5.8400PA 34.66◦ 90 5300×900 1.98±0.30 2.81±0.42 Relic 325 13.5200×10.9100PA -65.41◦ 200 6800×2600 5.08±0.75 7.20±1.06
? 235 15.5300×12.1700PA 0.01◦ 700 – – –
MACSJ0152 Relic ? 610 18.8900×15.9100PA -2.43◦ 70 – – –
Relic ? 235 22.2800×16.3900PA -5.96◦ 500 6500×3000 9.24±1.30 5.68±0.80
MACSJ1931 Galaxy 610 7.5500×5.2200PA -1.06◦ 80 – – –
Galaxy 235 17.3700×11.9300PA 4.09◦ 1200 – – –
Col. 1:cluster nameCol. 2:Possible type of source or emission structuresCol. 3:Frequency of observationCol. 4:Image beam size in arc second.
Col. 5:Image rms (σ) inµJy beam−1Col. 6:Size of the structuresCol. 7:Flux density in mJyCol. 7:Luminosity of the sources in1024W Hz−1. †Size, flux density and Luminosities are calculated within 1 mJy contour to compare withVenturi et al.(2013) values.
(? means-proposed or doubtful.)
Figure 1. Panel 1: 610 MHz GMRT radio continuum map of MACSJ0014.3-3022 or Abell 2744 plotted as grey colour and black contours are at the level of3σ(where rms i.e.σ=100µJy beam−1) and rest of the 6 contours are in multiplication of√2of first contour.
A negative contour at−3σ has been plotted as dashed line.Panel 2:Similar image and contours of the same cluster at GMRT 235 MHz. Only this time theσ=360µJy beam−1.
clearly shows two substructures, both are reported to be as-sociated with bow shocks placed in the SE direction from
each of these sub-clumpsKempner & David(2004). In this
high resolution radio map (Fig.2), only brightest and sharp
relic edge has been observed. Plenty of point sources that can be seen in X-rays are mostly found to be not associated
Figure 2.GMRT 235 MHz high resolution radio map of Abell 2744 in gray colour. Rms of the image is 280 µJy beam−1 with
a beam of19.9400×9.5600 PA=4.8◦. Chandra X-ray (0.5-7.0 keV, Gaussian smoothed) contrours are over-plotted in red colour with contours at 4,8,16 and 32 times10−8 photons s−1cm−2 pixel−1.
3.1.1 Radio halo
Radio halo in this cluster is a copybook halo, truly
represent-ing its class havrepresent-ing almost circular shape (see Fig. 3, blue
dashed circle), possibly spherical in 3D. But, the peak emis-sion is located towards the SE corner of the halo, indicating movement of this bigger merging sub-clump to this direction. The halo is almost similar in shape and morphology in both the frequencies, as it can be noticed in the overlapped map
in Figure3. But, the sub-structures at different frequencies
are appearing at different positions. At 610 MHz, a split in
the halo centre can also be found (see Fig.1, Panel 1). The
halo is also observed to be inflated a bit towards the relic.
At 610 MHz, the image has1σi.e. rms value of 100µJy
beam−1with a beam of20.6200×15.8300and PA 4.27◦.
Simi-larly at 235 MHz, the rms is 360µJy beam−1 with a beam
of25.5500×17.4200and PA -2.15◦. The lowest contour is
plot-ted with3σand further 6 contours are at intervals of square
root of 2 of the first contour (see Fig.1). A negative contour
has also been shown at−3σ. This radio halo roughly has a
regular morphology with a projected angular size (LLS i.e.
Largest Linear Size) of about 60 (∼ 1.6 Mpc) as found at
about 3σ detection limit at both frequencies (See Table 3
for detailed observed parameters). Our re-analysed GMRT 325 MHz map measures a larger LLS of 1.85 Mpc (image
not shown), comparable to the reported∼1.9MpcVenturi
et al. (2013), both measured within the contour level of 1 mJy/beam. The flux densities at 235 and 610 MHz respec-tively are given by 302.26±30.49 and 103.25±10.40 mJy,
where error has been computed using the Eq.3. We detect
more structures and larger extension of the halo at GMRT 325 MHz. The reported flux density of the halo is also higher
at323±26mJy (Venturi et al. 2013). Whereas, our measured
value is308±31mJy (Detail in Table3).
Figure 3.Contours at 610 (black) and 235 MHz (red) are plotted together for cluster Abell 2744. Contours are same as in Figure1. Blue dashed circle encloses the radio halo, black dashed region shows the relic B and almost concentric circular arc with dashed black line indicates the outer edge of the relic A i.e. shock front.
3.1.2 Radio relic
The most prominent radio relic (Relic A as shown in Fig.3)
in this cluster is a peripheral single, bow-shaped relic with concave side facing towards the cluster centre. It follows well
the curvature of the radio halo structure, as shown in Fig.3
with almost concentric circles (dashed Black and Blue). As, we have discussed above, the motion of the merging clumps is towards the SE corner. But, the relic is towards North-East (NE) corner i.e., perpendicular to the possible merging axis. The relic A has several sub-structure emissions and is not sharp edged like the CIZA J2242.8+5301 cluster (Stroe et al. 2013). Interestingly, the peripheral curved relic in this
cluster has almost the same length as the halo 5.50 (∼ 1.5
Mpc) at 235 and 610 MHz and 1.82 Mpc in 325 MHz and a large average width of about 500 kpc in all the reported
frequencies (see Table 3). The relic is placed at about 1.7
Mpc (36500) away from the cluster centre i.e., at aboutr
500 radius of the said cluster.
A second relic, Relic B, as shown in the image (Fig.1,
both panel) can be seen just in front of the bigger merging group that has crossed the centre and moving towards the SE corner. This relic is faint and broken into parts (as seen
above3σ level). Broken parts in different frequencies do not
totally co-inside, rather complement each other to make a full shock front. The full shock thus can be recovered by over-plotting emission from these two different frequencies,
as shown in Figure3, indicated as Relic B within the black
dashed area.Pearce et al.(2017) has also reported this relic
at high frequency, wide band VLA 1-4 GHz map andVenturi
et al. (2013) has mentioned it as a radio bridge between halo and the Relic A as found in their GMRT 325 MHz low resolution map.
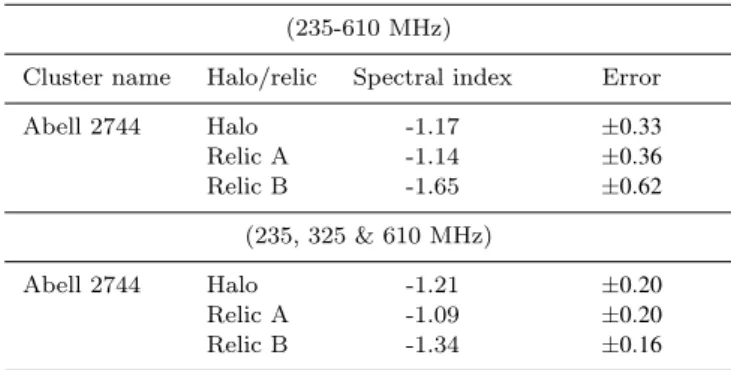
Table 4.Total spectral index of the detected structures (235-610 MHz)
Cluster name Halo/relic Spectral index Error
Abell 2744 Halo -1.17 ±0.33
Relic A -1.14 ±0.36
Relic B -1.65 ±0.62
(235, 325 & 610 MHz)
Abell 2744 Halo -1.21 ±0.20
Relic A -1.09 ±0.20
Relic B -1.34 ±0.16
Col. 1:Cluster nameCol. 2:Type of radio structuresCol. 3:Average spectral index of the total structuresCol. 4:Error in spectral index.
46.78±4.74,118.69±12.11 and 123.05±12.61 mJy and in-tegrated power of 1.44±0.15×1025, 3.56±0.36×1025 and 3.79±0.39×1025 W Hz−1 at 610, 325 and 235 MHz
respec-tively. For the same relic,Venturi et al.(2013) has reported
a total flux density of122±10mJy within 1 mJy contour at
325 MHz. Since, the Relic B is in discrete parts at3σ level
in each frequency, we have measured the flux from a polyg-onal common area at these frequencies. The respective flux densities are 5.83±0.98,12.08±2.09 and 24.84±3.66 mJy and corresponding total radio power is 1.80±0.30×1024, 3.72±0.64×1024 and7.65±1.13×1024 W Hz−1 i.e., having values almost an order lower in magnitude compared to the Relic A.
3.1.3 Spectral index
Spectral index map of 610 and 235 MHz emission has been
produced using the method described in Section 2.5 and
shown in Figure4, Panel 1. It can be noticed that the
ra-dio halo has a flat spectrum with average value of about αhalo610235=−1.17±0.33. Except few small patches of extreme flat spectral index (<<−1.0), mostly the spectrum is
uni-form (∼1.1) throughout the halo. The corresponding error
map computed using Eq. 5 has been shown in Figure 4,
Panel 2. Further, combined spectral index has been com-puted using 235, 325 and 610 MHz fluxes considering a common area of the halo and relic. Only a slight change in the spectral index of αhalo235,325,610=−1.21±0.20 is
observed. Computed spectral index and error for various components of the Abell 2744 cluster have been tabulated
in Table 4. Average or integrated spectral index of the
relic A is αrelAint
610
235=−1.14±0.36. On the outer age of the relic is shown to have a very flat spectrum ofαrelA−E610235=
−0.69±0.21. This steepens gradually towards the inner side of the relic to about αrelA−O610235=−1.29. Therefore, it seems, it follows the usual injection model reasonably i.e., αin j610235=αint610235−0.5=0.64∼αrelA−E610235. Injection spectrum of relic A i.e., αrelA−E610235=−0.69±0.21 corresponds to the
highest Mach number of about M=3.40 to the lowest of
M=2.45 at the injection. Where Mach number has been
computed as
M2=2α+3
2α−1 (6)
considering DSA mechanism (Blandford et al. 1987;
Co-lafrancesco et al. 2017). The average Mach number of this shock isM=2.03(as averageαrelAint
610
235=−1.14), which cor-roborates to the study of (Pearce et al. 2017). However, X-ray detected thermal shock strength is given byM=1.7±0.5 0.3 (Eckert, et al. 2016).
Relic B is on the other hand a very steep spectrum relic with average spectral index ofαrelB610235=−1.65±0.62. Error
in spectral index is also much higher and 3σ radio
emis-sion regions of two frequencies are sometimes non co-spatial (see Fig.3). Injection spectral indexαin j610235=αrelB610235−0.5 at the front of the relic B corresponds to a Mach number of aboutM=2.02±0.17
0.41. Where corresponding value reported
by (Pearce et al. 2017) isM=1.86±0.29 0.17.
3.2 MACSJ0025.4-1222
The Cluster MACSJ0025.4-1222 is a distant cluster with redshift of z=0.584. This is a very hot and massive object
with average temperature of7.10±0.70 keV. Temperature
is computed from the Chandra X-ray data (Ebeling et al. 2007). It has been reported from weak and strong lens-ing studies that two dark matter sub-groups with similar
masses (about 2.5×10¹⁴M) are separated from baryonic
over-density regions indicate a merger (Bradaˇc et al. 2008) or most probably a core oscillation phase (Ma et al. 2010). High X-ray brightness of8.8×1044 erg s−1 with presence of substructures also indicate dynamical activity in this clus-ter.
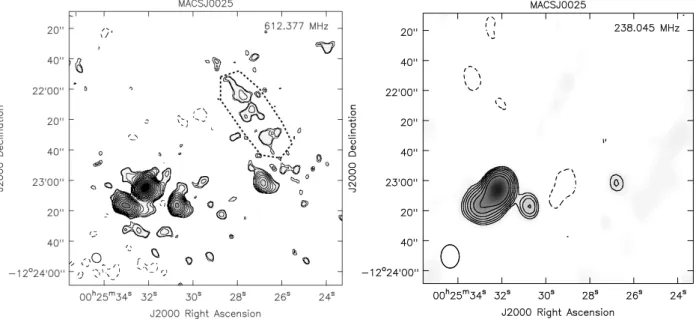
Evidence of diffuse radio emission, in particular relics in this cluster, was first reported byRiseley et al.(2017) at 325 MHz using the GMRT. Our GMRT observation at 610 MHz has also revealed a very faint, relic like structure to-wards North-West (NW) of the cluster (in RA-DEC plane)
as shown in the Figure5, Panel 1, marked with dashed line.
The same structure cannot be seen in our 235 MHz map which has much higher rms caused by the data loss due to bandpass filter and presence of few bright sources in the cen-tral field. The final rms achieved is just 700µJy beam−1at
235 MHz, as compared to a much lower i.e., 90µJy beam−1
at 610 MHz using the data analysis parameters mentioned in
Table2. The relic source is an extremely faint object at 610
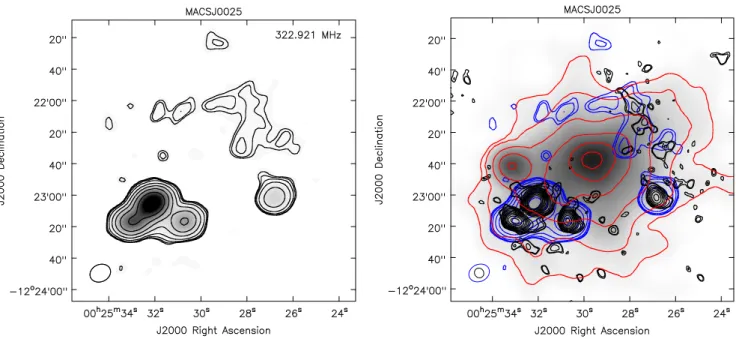
MHz with flux density of1.98±0.30 mJy. Our re-analysed
image at 325 MHz has also shown a relic like structure in the same region as in 610 MHz map, but larger in size. The observed flux density is5.08±0.75mJy. Average spec-tral index measured within a common region of the relic emission from 610 and 325 MHz shows a flat spectrum of α325610=−1.03±0.41. Taking the same spectrum for 610 and
325 MHz to 1.4 GHz, the P1.4 radio power would measure
to1.19±0.18×1024WHz−1and1.60±0.24×1024WHz−1 re-spectively. But, assuming the well-known average spectral indexα1400610 =−1.3(Feretti et al. 2012),Riseley et al.(2017) has reported(i.e.P1.4=1.29±0.14×1024WHz−1. Apart from this relic, only 4 bright galaxies associated with some diffuse emission can be found in both the frequencies, no radio halo or any other prominent relic or diffuse emission has been detected in our maps.
We have drawn the radio contours on the Chandra
archival X-ray map in Figure6. It can be noticed that the
Figure 4. Panel 1:Spectral index (see Eq.4) map of Abell 2744 in colour scale.Panel 2:Spectral index error (see Eq.5) map with colour scale. Radio flux contours in both panel are same as Fig.1.
Figure 5. Panel 1:&Panel 2:610 and 235 MHz map for the cluster MACSJ0025.4-1222 with first contour at 2.5σ, rest of the contours
and colour scale are same as Figure1. The rms values at 610 MHz isσ=90µJy beam−1 and at 235 MHz it is
σ=700µJy beam−1 with
beam sizes as given in Table3.
study falls at the outskirts of the X-ray core but well inside the actual extent of the cluster (r500=1.15 Mpc). The dis-tance between the relic and the cluster centre is measured to be 4500 i.e., 300 kpc only. The detected relic is just 5300 in angular size which at this high redshift of z=0.584 would translate to a linear size of 350 kpc. In the re-analysed 325
MHz map, the relic measures as6800. While, Riseley et al.
(2017) have reported a size of10000for the same.
3.2.1 Estimated radio halo upper-limit
The expected radio power (P1exptd.4GHz) for this high mass
clus-ter, calculated using equation 1 is 5.3×1024W Hz and
ra-dio halo size, calculated using equation2 is 1170 kpc. We
have used the average slope and intercept from the Eq.1
and Eq.2 for the above estimations. Following the
proce-dure given in section 2.4, using these estimated
Figure 6. Panel 1: 235 MHz map for the cluster MACSJ0025.4-1222 with colour scale and controus at 3, 3.5, 4, 6, 12, 24, 48, 96 times the 1σ rms. The rms values at 325 MHz isσ=200µJy beam−1.Panel 2:Chandra X-ray photon count (0.5-7.0 keV, Gaussian
smoothed) map has been plotted in gray scale and red contours are over-plotted in red colour with contours at 1.3, 2, 4, 6, 8 and 9.5 times2.87×10−8photons s−1cm−2pixel−1. Radio contours are in blue and black and are same as the Panel 1 of Figure6&5respectively.
to avoid the side-lobe interference due to the presence of central bright radio sources. The calculations were done for an image at 610 MHz, and values are then converted back to 1.4 GHz scales for reporting here. The final estimated upper limit of radio halo power (P1in j.4GHz) corresponding to injected mock halo is 4.8×1024W Hz. Image with the same
resolution as in Figure5is made using the same imaging
pa-rameters. The corresponding measured power for flux above 2σis3.57×1024W Hzand size of the recovered halo above2σ
is 582kpc, both of which meets the criteria for halo upper
limit as mentioned in Section2.4.
3.3 MACSJ0152.5-2852
MACSJ0152.5-2852 is another high redshift cluster at
z=0.413 and moderate temperature of 4.7±0.5 keV. Its
ra-dius, r500 is 1.21±0.11 Mpc and mass at r500 is 7.9±2.2
1014M. The cluster shows non-concentric X-ray contours
towards the NW direction with the signature of substruc-tures or disturbed morphology indicating a probable merger (Ebeling et al. 2010).
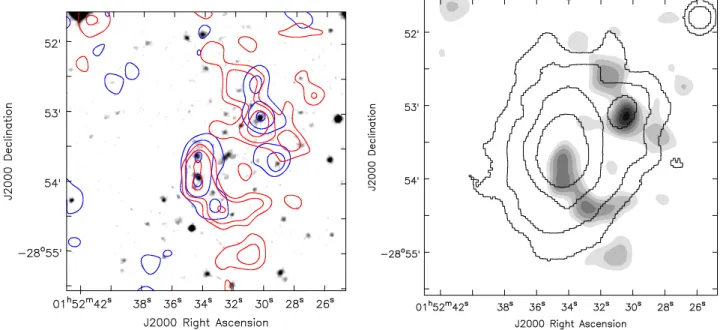
Our GMRT observation at 235 MHz has revealed a dif-fuse emission of about 0.5 Mpc size in this cluster. A one-sided arc-shaped radio emission is placed on the southern side of the cluster starting near to the centre to the half-way
to the virial radius, marked as dashed area A in Figure 7,
Panel 1. The source could not be recovered fully in 610 MHz. Except few unrelated small regions of radio emission at 235 MHz, no other prominent peripheral or arc/bow shaped relic or halo emission has been observed at both the frequencies. Among many of the radio sources, only two radio bright
spots marked as S1 and S2 in Figure7Panel 2 are of point
source origin. One is connecting to the left arc-like radio structure, marked as S1 and other on the right side marked
as S2. These two sources can be correlated with the optical
and bright X-ray counterparts (See Fig.8, both panels), and
they are the radio and X-ray bright galaxies. Coincidentally, these two bright sources are placed at the centre of the two
galaxy groups (X-ray sources:Ebeling et al. 2010) that are
supposed to be colliding with each other. Rest part of the left radio structure i.e., other than S1, has no optical and X-ray counterparts of compact point source origin and are purely
diffuse in nature (see Fig. 8, both panels). The total flux
density of this arc-like structure at 235 MHz is9.24±1.30 mJy (radio power of5.68±0.80×1024W Hz−1) and spectral index of the part of the source that has been observed in both 610 and 235 MHz is extremely steepαrel=−2.3±0.58.
Size of this diffuse radio structure is about 1.50, though at high red-shift that translate to about 0.5 Mpc.
3.3.1 Estimated radio halo upper-limit
Adopting average slopes and intercept given in Eq.1 and
Eq. 2, the computed possible radio halo power (P1exptd.4GHz)
for cluster MACSJ0152.5-2852 is 4.13×1024W Hz and
ex-pected radio halo size is 1108 kpc. Radio halo upper limit is thereafter evaluated performing the steps mentioned in
Section 2.4. Calculations were done for an image at 610
MHz and scaled 1.4 GHz values are reported here. The final estimated value of upper limits of halo power (P1in j.4GHz) is 3.29×1024W Hz. Image with the same resolution as in
Fig-ure 7is made using the same procedure. The radio power
corresponding to measured flux above2σ is1.53×1024W Hz
and size of recovered halo measured above 2σ is 588 kpc
Figure 7. Panel 1:&Panel 2:Same as Figure 1for the cluster MACSJ0152.5-2852. Only the rms values at 610 MHz isσ=70µJy beam−1 and at 235 MHz it isσ=500µJy beam−1. S1 and S2 are the two point sources having optical and X-ray counter part. Dashed
line encloses the extended diffuse relic (?).
Figure 8. Panel 1:GMRT 610 (blue) and 235 MHz (red) contours (only 3 at 3,6,12σ=70&500µJy beam−1) are over plotted on SDSS
optical image.Panel 2:Chandra X-ray photon count map (0.5-7.0 keV, Gaussian smoothed) with black contrours at 4,8,16 and 32 times
10−8 photons s−1cm−2 pixel−1 and are over plotted on the gray colour radio map of MACSJ0152.5-2852 at GMRT 235 MHz.
3.4 MACSJ1931-2635
The clusters MACSJ1931-2635 did not show any clear
dif-fuse radio emission at both the frequencies (See Fig.9, both
panels). This cluster only shows an interesting radio galaxy with extremely bent jets with jet separation angle of about
30◦ as seen at 610 MHz. But, jets could not be resolved in
235 MHz map. Our low resolution maps in Figure 9 have
rms of 1200 and80µJy beam−1respectively at 235 and 610
MHz for beam sizes of17.3700×11.9300and7.5500×5.2200.
Figure 9. Panel 1:GMRT 235 MHz map of the cluster MACSJ1931-2635 plotted in gray. Black contours are radio fluxes at the level of3σ (where rms i.e.σ=1200µJy beam−1) and rest of the conours are at 9,27,81,243σ. We have also plotted a−3σ contour with black
dashed line.Panel 2:Same contours as Panel 1 at 610 MHz with rmsσ=80µJy beam−1. Red controus are the Chandra X-ray photon
count map of 0.5-7.0 keV (Gaussian smoothed).
4 DISCUSSIONS
4.1 Cluster with a unique radio halo-relic structure
We report the low frequency radio spectral and morpholog-ical signatures of Abell 2744, a rare radio halo-relic system through high resolution and deep radio images from GMRT dual band (610 & 235 MHz) observations. Systems with the prominent peripheral bow shaped relic/s are usually devoid of central halos and only a few of the clusters are known to host both halo and relic (Giovannini & Feretti 2004). This makes Abell 2744 cluster a very rare one. The dimension (LLS) of the relic and the halo in this cluster is observed to be one of the largest, as both of them are about 1.6 Mpc
in size at 235 and 610 MHz as seen in this study (at 3σ
level respectively; see Section 3.1.1 and 3.1.2). Orr´u et al.
(2007) has reported a similar size (both∼1.6 Mpc) as ours
at 325 MHz VLA. At GMRT 325 MHz the sizes measured from our re-analysed image are further bigger, 1.85 and 1.82 Mpc respectively. The sizes reported so far at various ob-serving frequencies (200 MHz - 4 GHz) vary from 1.0-2.34 Mpc for the halo and 1.1 - 2.0 Mpc for the relic A as shown
in the Table5. So far, the known halos bigger than this are
3.1 Mpc in CIZAJ2242.8+5301, 2.9 Mpc in Abell 2163 (van Weeren et al. 2010;Hoang, et al., 2017;Feretti et al. 2001)
and bigger relic is 2.5 Mpc in Abell 115Govoni et al. 2001b).
Additionally, this cluster hosts a second relic (i.e. Relic B)
that was first reported by Pearce et al.(2017) at high
fre-quency, and we confirm it at low frequencies. Relic B has a size of over a Mpc at 1-4 GHz which we report as 0.9-1
Mpc at 235, 610 MHz and at 325 MHz the size is∼0.7 Mpc
as found in our study as well as reported in Venturi et al.
(2013) as a radio bridge.
Average spectral index of both relic A and the halo in
Table 5.Multi-frequency radio structures of Abell 2744
Frequencies LLS (Mpc)
(MHz) (Halo: Relic A: Relic B:)
200 (GLEAM)a 1.01 1.10 –
235 (GMRT)b 1.55 1.49 0.98
325 (VLA)c 1.6 1.6 –
325 (GMRT)d 1.9 1.3 –
325 (GMRT)b 1.85 1.82 0.74
610 (GMRT)b 1.59 1.49 0.86
1400 (VLA)e 2.34 2.0 –
1500 (VLA)f ∼2.1 ∼1.5 ∼1.15
3000 (VLA)f ∼2.1 ∼1.5 ∼1.15
(a)George et al.(2017)(b)Current study(c)Orr´u et al.(2007)
(d)Venturi et al.(2013)(e)Govoni et al.(2001b)
(f )Pearce et al.(2017)
this cluster is strikingly similar i.e., (αrelA235610=−1.14±0.36 andαhalo235610=−1.17±0.33; see Section3.1.3). Average spec-tral index in wide, low-frequency range i.e., between 235, 325 and 610 MHz has also been computed and found to beαrelA235,325&610=−1.09±0.20andαhalo235,325&610= −1.21±0.20.Venturi et al.(2013) have reported spectral in-dex between 325 and 1400 MHz asαrelA3251400=−1.24±0.10, andαhalo3251400=−1.19±0.08and for the high frequency range i.e., 1.5 to 3 GHz it isαrelA15003000=−1.32±0.09andαhalo15003000=
Table 6.Multi-band radio spectrum of Abell 2744
Frequencies Spectral Index
(MHz) (Halo: Relic-A: Relic-B:)
118,154,200,a
−1.09±0.05 −1.01±0.07 – 325 & 1400
325 & 1400b −1.0±0.1 −1.1±0.1 – 325 & 1400c −1.19+0.08
−0.11 −1.24±0.10 –
235 & 610e −1.17±0.33 −1.14±0.36 −1.65±0.62 235,325 & 610e −1.21±0.20 −1.09±0.20 −1.34±0.16 235 & 1400e −1.20±0.12 −1.25±0.15 – 1500 & 3000d −1.43±0.11 −1.32±0.09 −1.81±0.26 (a)George et al.(2017); (GLEAM-TGSS-VLA)
(b)Orr´u et al.(2007); (VLA-VLA) (c)Venturi et al.(2013); (GMRT-VLA) (d)Pearce et al.(2017) ; (VLA-VLA) (e)Current study; (GMRT-GMRT)
4.2 Understanding halo-relic co-existence
Observations show that relic A in this cluster is a one-sided (with no counterpart), peripheral, curved-relic with its concave side facing the central halo and matching the
halo curvature as observed in Fig.3. This indicates that the
shocks must be spheroidally evolving after cluster mergers
as noticed inPaul et al.(2011). Unlike the usual peripheral
relics, which form almost along the merging axis (Bagchi et al. 2006), relic A has formed towards the perpendicular di-rection to the observed axis of current substructure merger
(see Section 3.1.2). Apart from this, the other significant
finding from this study is a proposed high Mach number (M=2.02+−00..1741) internal shock (see Section3.1.3) which we have reported above as relic B.
Figure1shows that the prominent relic A in this cluster
is about 1.7 Mpc away from the centre, an average speed of 1,000 km/s for the shock (Sarazin 2002) would mean that the merger had taken place at about 1.7 Gyr ago. But, electrons lose energy very fast through synchrotron emission (Boozer 2015). Unless, a continuous and in situ particle acceleration engine is present in cluster, synchrotron emission remains visible only about a few hundred Mega years (i.e.,
equiva-lent to Synchrotron and IC cooling time;Kang et al. 2017;
Kang 2016). Usually, relics are always attached to the shocks that are acting as in situ particle accelerators, and
eventu-ally survive for long (∼ 2 Gyr), till the shock is powerful
enough to energise ambient electrons to relativistic energy. But, turbulence in the cluster centre is found to be effective enough to produce radio emission for only about one Gyr
after each merger (Cassano et al. 2016;Cassano & Brunetti
2004). Therefore, if the turbulent re-acceleration (TRA ) is considered to be the only mechanism responsible for radio halo emission, a cluster that has merged more than a Gyr ago may not keep its radio halo alive. Even if, it remains alive it cannot be observed in high frequencies, as spectrum would be extremely steep (Brunetti et al. 2001). Which is not the case for cluster Abell 2744, having a flat spectrum, bright halo even at 4 GHz (Pearce et al. 2017). This indicates either a different particle acceleration scenario or a recent activity that would re-accelerate the ambient electrons to reproduce the halo. If, the first merger is not an immediate event, a flat spectrum halo would indicate a second possible
event that has recently re-accelerated the ambient electrons (Markevitch et al. 2005). So, presence of the second closer relic (Relic B) may help to resolve this issue.
The second relic in Abell 2744 i.e., Relic B has been found well within one Mpc from the centre and possibly connected to the merging sub-cluster (the brightest point inside the observed halo) that is seen to move towards SE direction. Its distance is only about<0.7Mpc from this
sub-clump. This shock has Mach number of aboutM=2.02±17
41 as computed from its injection spectral index ofαin j=1.15
(see Sec.3.1.3). This gives a shock speed of about1769±148 359
km/s in a medium with temperature of about3.5×107 K
(as seen inPearce et al. 2017). The shock velocity (Vsh) has
been computed from the relationVsh=M1480Tg108K12km s−1
(Sarazin 1988) whereTgis the temperature of the ICM gas.
Further, this would mean that the shock has passed through the cluster halo within last387±98
30 Myrs, indicating a very
recent second merger. In fact, a similar two merger scenario
has been proposed byMedezinski, et al.(2016), as concluded
from their weak lensing study. They propose that, the first i.e., the major merger event had taken place along the East-West direction and a newer merger along the North-South direction. Eventually, this may provide a possible explana-tion for the observed, long-lasting, flat spectrum radio halo in connection to turbulent re-acceleration process, though does not rule out the possibility of any other scenario.
4.3 Possible evidence of early stage mergers?
4.3.1 MACSJ0025.4-1222
Here, we report the detection of a very faint (Flux density of1.98±0.30mJy) radio relic like structure in the NW side of the cluster MACSJ0025.4-1222 at GMRT 610 MHz. Also,
it has been confirmed at 325 MHz map (see Fig.6, Panel 1).
Detection of cluster diffuse radio sources become difficult at so high redshift (z=0.584). Only a deeper observation may reveal the full structures. Therefore, observed diffuse radio emission from such a high redshift cluster itself a significant event. This also informs us about a galaxy cluster merger that has taken place at such an early stages (at high redshift) of structure formation in the Universe.
Fig. 6 shows that the relic in MACSJ0025.4-1222 is
placed at just outside the X-ray core of the cluster (Bradaˇc et al. 2008) i.e., about 300 kpc or4500from the centre. If, the relic has originated due to a merger, it should be a recent merger, since the shock has merely travelled a 300 kpc dis-tance. An average speed of 1000 km/s for the shock would account for a time of 300 Myr only. In such a situation, we would also expect to detect a radio halo as well. But, we have not detected any other diffuse radio emission, or found no information regard to this in literature. Non detection of a halo may be attributed to the limit of sensitivity of the particular observation, less turbulence in the medium or to a different particle acceleration mechanism. A detection or non-detection of halo with deeper observation would thus be interesting in connection to constraining possible particle ac-celeration mechanism and dynamical condition of the ICM. This distant cluster is thus an important object, one of the
few earliest (next only to El Gordo cluster; z=0.87;
4.3.2 MACSJ0152.5-2852
We have discovered a faint (total flux density 9.24±1.30 mJy) and extended, relic-like diffuse radio structure of size of about 0.5 Mpc in MACSJ0152.5-2852 cluster at 235 MHz. Unlike most of the arc-shaped radio relics that are ob-served almost at the virial radius of the host clusters, lo-cation of this source is well inside the virial radius (see Fig. 8, Panel 2). The only bright, point like source (S1) is co-incidentally falling at the X-ray centre of the bigger galaxy group and co-positioned with a radio X-ray bright galaxy residing at the centre of the cluster. As discussed in
Section 3.3, the other part of the arc like radio structure
is purely of diffuse in nature and is extended to about 0.5 Mpc towards the outskirts of the cluster. Presence of a small group of galaxies in NW of the cluster, most probably falling in to the bigger group towards SE (found in X-ray map),
in-dicates an ongoing activity i.e., a merger (Fig. 8). So, the
diffuse structure detected in this cluster may be a relic that has been originated from this merger and considering its po-sition closer to the cluster centre, must be originated within last half a Gyr. But, the spectral index of the common part of the diffuse radio structure that has been observed with both 610 and 235 MHz, is extremely steepαrel=−2.3±0.58. Such
steep spectrum is also a characteristic of a radio phoenix. Therefore, further deeper map at these frequencies, as well as at lower frequency (i.e., GMRT 150 MHz), are a must to get a complete and clear picture of this cluster.
4.4 Fitting observed halos and relics into existing correlations
Radio halo power (at 1.4 GHz) of massive clusters is known to follow a steep slope correlation (BCES bisector slope 3.70±0.56 and 2.11±0.20) with cluster mass (M500) and
X-ray luminosity (L500) respectively (Cassano et al. 2013).
A possible correlation between the relic power (at 1.4 GHz)
and its size (LLS), has also been reported byFeretti et al.
(2012). So, it is useful to check, where our studied halos and relics stand with respect to these well-known correlations.
As reported in this study, only one (i.e. Abell 2744) among the four observed clusters has been detected with a radio halo. In total, three of them show relics (except MACSJ1931-2635). Since, our study was done at low fre-quencies, we have projected our observed radio powers to 1.4 GHz using the reported spectral indexα2351400=−1.20,−1.25
(see Table 6) for Abell 2744, α=−1.03 (see Section 3.2)
for cluster MACSJ0025.4-1222, and assumedα6102351400 =−1.3 for the rest of the sources. Our estimated radio powers are reasonably closer to the values reported in (Pearce et al. 2017) and are given as P1.4=1.16±0.12×1025 W Hz−1, 4.89±0.5×1024 W Hz−1and4.5±0.6×10²³W Hz−1 respec-tively for the same structures. For the cluster MACSJ0025.4-1222, the projected relic radio power isP1.4=1.19±0.18×
1024WHz−1 in our study which is comparable to P1.4=
1.29±0.14×1024WHz−1 reported in Riseley et al. (2017). We found the relic power in MACSJ0152.5-2852 to be 5.58±0.78×10²³WHz−1. Our estimated radio halo upper limits at 1.4 GHz for the above two clusters are given by 4.8×1024W Hz−1 and3.29×1024W Hz−1 (see Section3.2.1 and3.3.1).
Figure 10, Panel 1, shows the correlation M500 vsP1.4
Table 7. Correlation slopes
Correlations Old slope New slope Radio Halo
M500vsP1.4 3.04±0.33 2.96±0.29
L500vsP1.4 1.57±0.28 1.58±0.28
Radio Relic
LSSvsP1.4 1.90±0.26 1.88±0.24
i.e., between the mass of clusters (within radius r500 i.e.,
M500) and the radio power of the halos at 1.4 GHz (i.e.,
P1.4). Figure10, Panel 2 shows the correlation between
X-ray luminosity (L500) and 1.4 GHz radio power (P1.4). Data plotted from the literature are GMRT Radio Halo Surveys (GRHS) and, some individual studies with various telescopes (Cassano et al. 2013;Bernardi et al. 2016;Giacintucci, et al. 2014). The upper limits are estimated for the undetected
Extended-GRHS sources byVenturi et al.(2013). Our only
detected halo has been plotted as a red point and, two upper
limits are plotted as red down arrows. Figure11shows the
plot of radio power versus size (LLS) of the relics. Here we have plotted our observed relics on the results reported in Feretti et al.(2012). We have computed the BCES bisector fitting slopes and confidence levels for already available data as well as combining with data from current study. The old and the new slopes and their corresponding errors are
re-ported in Table7. No considerable change of slopes can be
noticed after adding new data from the current study.
5 CONCLUSIONS
We have observed four galaxy clusters selected from MACS list at GMRT low frequency (235 and 610 MHz) radio waves to study the morphology and spectral properties to under-stand their dynamical features as well as their candidature to the existing pool of cluster radio structures. Among the four observed clusters, three of them namely, MACSJ0014.3-3022 or Abell 2744, MACSJ0025.4-1222 and MACSJ0152.5-2852 are detected with diffuse radio emission. But, cluster MACSJ1931.8-2635 did not show any diffuse emission at the rms noise level (local) of80and1200µJy beam−1at 610 and 235 MHz respectively in our observations.
• The deep low-frequency radio maps show both a giant
halo and multiple relics in the cluster MACSJ0014.3-3022 i.e., Abell 2744, possibly the largest halo relic combination at both low and high frequency radio waves (1.6 Mpc each in this study and at maximum 2.4 and 2 Mpc respectively from literature). The almost spherical, text book type, halo observed in Abell 2744 indicated to have a different origin than the merging event responsible for producing relic A, which is estimated to have originated more than 1.5 Gyr ago. Here, we also confirm the detection of a second relic i.e., relic B (at low frequencies i.e., 235 and 610 MHz), very near (<0.7 Mpc) to the cluster core. The relic has
possi-bly originated from a high Mach number (M=2.02) shock
with a computed shock speed of 1769±148
359 km/s due to a
1015
M500(M)
1023 1023
1024 1024
1025 1025
1026 1026
P
total 1.4
GH
z
(W
/
Hz)
BCES bisector Cassano et. al. 2013 Giacintucci et. al. 2014 Bernardi et. al. 2016 Upper limit EGRHS Upper limit(This study) Radio halo(This study)
1043 1044 1045
L0.1−2.4keV X (erg/s)
1023 1023
1024 1024
1025 1025
1026 1026
P
total 1.4
GH
z
(W
/
Hz)
BCES bisector
Cassano et. al. 2013 Feretti et. al. 2012 Kale et. al. 2013 EGRHS upper limit Upper limit(This study) Radio halo(This study)
Figure 10.Plotted radio power (P1.4GHz) against virial mass (M500, Panel 1) and X-ray luminosity (L500, Panel 2). Data points are taken
from various studies as mentioned in legends. Data and upper limits from current study is plotted in red colour. BCES Bisector fitting slope (black line) and confidence levels are drawn at 95% (orange) i.e. about 2σ (see Table7).
0.1 1
LLS (Mpc)
1021 1021
1022 1022
1023 1023
1024 1024
1025 1025
P
total 1.4
GH
z
(W
/
Hz)
BCES bisector Feretti et. al. 2012 This study
Figure 11.Plotted radio power (P1.4GHz) against Largest Linear Size (LLS) of the relics. Colour code is as mentioned in the legend. Fitting details are same as Fig.10.
understood from the current study and earlier weak lensing study. Lastly, a marginal but same amount of ageing effect reported in this study for both halo and the relic needs to be investigated further.
• We report here the detection of radio relic-like diffuse
emission in two of our galaxy clusters MACSJ0152.5-2852 and MACSJ0025.4-1222. These 2200 Mpc and 3500 Mpc (luminosity distance andz=0.413&0.584respectively) away
clusters observed to host diffuse radio structures of sizes.
0.5Mpc well inside their virial radius. Both these clusters being at high redshift are possible evidence of early universe and early stage merging systems.
• All detected halo and relic reported in this study shown
to fit well with the prevailing radio power vs mass, X-ray luminosity as well as LLS correlations and therefore they are a good addition to the existing data set of radio halos and relics.
• We also report the non-detection of diffuse radio
emis-sion from galaxy cluster MACSJ1931-2635.
ACKNOWLEDGEMENTS
We would like to thank the staff of the GMRT that made these observations possible. GMRT is run by the National Centre for Radio Astrophysics of the Tata Institute of
Fundamental Research.SPacknowledges DST-SERB Fast
Track scheme for young scientists, Grant No. SR/FTP/PS-118/2011 for supporting this research. He also wants to thank DST INSPIRE Faculty Scheme (IF12/PH-44) for funding his research group. Part of this work was done when
AD was a NASA post-doc at CASA, Univ. of Colorado,
Boulder USA.
REFERENCES
Blandford, R., & Eichler, D. 1987,Physics Report, 154, 1 Bernardi, G., Venturi, T., Cassano, R., et al. 2016, MNRAS, 456,
1259
Bonafede, A., Br¨uggen, M., van Weeren, R., et al. 2012,MNRAS, 426, 40
Bonafede, A., Cassano, R., Br¨uggen, M., et al. 2017, MNRAS, 470, 3465
Boozer, A. H. 2015, Physics of Plasmas, 22, 032504 Borgani, S., & Guzzo, L. 2001, Nature, 409, 39
Bradaˇc, M., Allen, S. W., Treu, T., et al. 2008, ApJ, 687, 959 Brown, S., Duesterhoeft, J., & Rudnick, L. 2011, ApJ, 727, L25 Brunetti, G., Setti, G., Feretti, L., & Giovannini, G. 2001,
MN-RAS, 320, 365
Bykov, A. M., Dolag, K. and Durret, F., 2008,SSRv., 134, 119 Cassano, R., & Brunetti, G. 2004, Journal of Korean
Astronom-ical Society, 37, 583
Cassano, R., Brunetti, G., Setti, G., Govoni, F., & Dolag, K. 2007, MNRAS, 378, 1565
Cassano, R., Ettori, S., Giacintucci, S., et al. 2010, ApJ, 721, L82 Cassano, R., Brunetti, G., & Venturi, T. 2011,Journal of
Astro-physics and Astronomy, 32, 519
Cassano, R., Ettori, S., Brunetti, G., et al. 2013, ApJ, 777, 141 Cassano, R., Brunetti, G., Giocoli, C., & Ettori, S. 2016, A&A,
593, A81
Colafrancesco, S., Marchegiani, P., & Paulo, C. M. 2017, MNRAS, 471, 4747
Donnert, J., Dolag, K., Brunetti, G., & Cassano, R. 2013, MN-RAS, 429, 3564
Ebeling H., Edge A. C. and Henry J. P., 2001,ApJ, 553, 668 Ebeling, H., Barrett, E., Donovan, D., et al. 2007, ApJ, 661, L33 Ebeling, H., Edge, A. C., Mantz, A., et al. 2010,MNRAS, 407,
83
Eckert, D., Jauzac, M., Vazza, F., et al. 2016, MNRAS, 461, 1302. Ensslin, T. A., Biermann, P. L., Klein, U., & Kohle, S. 1998,
A&A, 332, 395
Feretti, L., Fusco-Femiano, R., Giovannini, G., & Govoni, F. 2001, A&A, 373, 106
Feretti, L., & Giovannini, G. 2008, A Pan-Chromatic View of Clusters of Galaxies and the Large-Scale Structure, 740, 24 Feretti, L., Giovannini, G., Govoni, F., & Murgia, M. 2012,
A&ARv, 20, 54
George, L. T., Dwarakanath, K. S., Johnston-Hollitt, M., et al. 2017, MNRAS, 467, 936
Giacintucci, S., Markevitch, M., Venturi, T., et al. 2014, ApJ, 781, 9.
Giovannini, G., Tordi, M., & Feretti, L. 1999,New Astronomy, 4, 141
Giovannini G., & Feretti, L. 2004,JKAS, 37, 323
Giovannini, G., Bonafede, A., Feretti, L., et al. 2009, A&A, 507, 1257
Govoni, F., Enßlin, T. A., Feretti, L., & Giovannini, G. 2001, A&A, 369, 441
Govoni, F., Feretti, L., Giovannini, G., et al. 2001, A&A, 376, 803 Hoang D. N., et al., 2017,MNRAS, 471, 1107
Hoeft, M., Br¨uggen, M., 2007,MNRAS, 375, 77
Horesh A., Maoz D., Ebeling H., Seidel G., and Bartelmann M., 2010,MNRAS, 406, 1318
Iapichino L., & Br¨uggen M. 2012,MNRAS, 423, 2781
Intema, H. T., Jagannathan, P., Mooley, K. P., & Frail, D. A. 2017, A&A, 598, A78
Johnston-Hollitt, M., & Pratley, L. 2017, arXiv:1706.04930 Kale, R., Dwarakanath, K. S., Vir Lal, D., et al. 2016, Journal of
Astrophysics and Astronomy, 37, 31
Kang, H. 2016, Journal of Korean Astronomical Society, 49, 83 Kang, H., Ryu, D., & Jones, T. W. 2017, ApJ, 840, 42 Kempner, J. C., & David, L. P. 2004, MNRAS, 349, 385 Kim, J.-Y., & Trippe, S. 2014, Journal of Korean Astronomical
Society, 47, 195
Lindner, R. R., Baker, A. J., Hughes, J. P., et al. 2014, ApJ, 786, 49
Ma, C.-J., Ebeling, H., Marshall, P., & Schrabback, T. 2010, MN-RAS, 406, 121
Mahler, G., Richard, J., Cl´ement, B., et al. 2018, MNRAS, 473, 663
Mantz, A., Allen, S. W., Ebeling, H., Rapetti, D., & Drlica-Wagner, A. 2010, MNRAS, 406, 1773
Markevitch M., Govoni F., Brunetti G., & Jerius D. 2005,ApJ, 627, 733
McMullin, J. P., Waters, B., Schiebel, D., Young, W., & Golap, K. 2007, Astronomical Data Analysis Software and Systems XVI, 376, 127
Murgia, M., Govoni, F., Markevitch, M., et al. 2009, A&A, 499, 679
Medezinski, E., Umetsu, K., Okabe, N., et al. 2016, ApJ, 817, 24. Nuza, S. E. and Hoeft, M. and van Weeren, R. J. and Gottl¨ober,
S. and Yepes, G., 2012,MNRAS, 420, 2006
Nuza, S. E., Gelszinnis, J., Hoeft, M., & Yepes, G. 2017, MNRAS, 470, 240
Orr´u, E., Murgia, M., Feretti, L., et al. 2007, A&A, 467, 943 Rephaeli, Y., Nevalainen, J., Ohashi, T., & Bykov, A. M. 2008,
SSRv, 134, 71
Riseley, C. J., Scaife, A. M. M., Wise, M. W., & Clarke, A. O. 2017, A&A, 597, A96
Rottgering, Wieringa, H. J. A., Hunstead, M. H., R. W., & Ekers, R. D. 1997,MNRAS, 290, 577
Paul, S., Datta, A., & Intema, H. T. 2014, Astronomical Society of India Conference Series, 13, 187
Paul, S., Datta, A., Malu, S., et al. 2018A, arXiv:1804.02588 Paul, S., Gupta, P., John, R. S., & Pubjabi, V. 2018,
arXiv:1803.10764
Pearce, C. J. J., van Weeren, R. J., Andrade-Santos, F., et al. 2017, ApJ, 845, 81
Pinzke, A., Oh, S. P., & Pfrommer, C. 2017, MNRAS, 465, 4800 Sarazin, Craig L., 1986,Rev. Mod. Phys., 58, 1
Sarazin, C. L. 1988, Cambridge Astrophysics Series, Cambridge: Cambridge University Press, 1988,
Sarazin, C. L. 2002, Merging Processes in Galaxy Clusters, 272, 1
Skillman, S. W., Hallman, E. J., O’Shea, B. W., et al. 2011,ApJ, 735, 96
S. Paul, L. Iapichino, F. Miniati, J. Bagchi & K. Mannheim 2011, ApJ, 726, 17
S. Paul, 2012,Journal of Physics: Conference Series, 405, 012026 Stroe, A., van Weeren, R. J., Intema, H. T., et al. 2013, A&A,
555, A110
Stroe, A., Rumsey, C., Harwood, J. J., et al. 2014, MNRAS, 441, L41.
Subramanian, K., Shukurov, A., & Haugen, N. E. L. 2006, MN-RAS, 366, 1437
van Weeren, R. J., R¨ottgering, H. J. A., Bagchi, J., et al. 2009, A&A, 506, 1083
van Weeren, R. J., R¨ottgering, H. J. A., Br¨uggen, M., & Hoeft, M. 2010, Science, 330, 347
van Weeren, R. J., R¨ottgering, H. J. A., Intema, H. T., et al. 2012, A&A, 546, A124
Venturi, T., Giacintucci, S., Dallacasa, D., et al. 2008, A&A, 484, 327
Venturi T., Giacintucci S., Dallacasa D., et al. 2013, A&A, 551, A24