n
Breast Imag
Ing
1 From the Department of Radiology, Massachusetts General Hospital, Harvard Medical School, 55 Fruit St, WAC 240, Boston, MA 02114 (C.D.L.); Group Health Research Institute, Group Health Cooperative, Seattle, Wash (R.F.A., D.S.M.B.); Department of Surgery, University of Vermont College of Medicine, Burlington, Vt (B.L.S.); Department of Radiology, University of Washington School of Medicine, Seattle, Wash (J.M.L.); Department of Medicine, Epidemi-ology and Biostatistics, University of California–San Fran-cisco, San FranFran-cisco, Calif (K.K.); Department of Radiology, University of North Carolina School of Medicine, Chapel Hill, NC (L.M.H.); Norris Cotton Cancer Center and Geisel School of Medicine, Dartmouth-Hitchcock Medical Center, Lebanon, NH (T.O., A.N.A.T.); Institute for Health Research and Policy, University of Illinois at Chicago, Chicago, Ill (G.H.R.); and Department of Public Health Sciences, School of Medicine, University of California–Davis, Davis, Calif (D.L.M.). Received May 20, 2016; revision requested July 25; revision received August 19; final version accepted August 29. Address correspondence to C.D.L. (e-mail:
Supported by a National Cancer Institute–funded Program Project (P01CA154292). Breast Cancer Surveillance Consortium data collection was also supported by HHSN261201100031C. Vermont Breast Cancer Sur-veillance System data collection was also supported by U54CA163303. Collection of cancer and vital status data used in this study was supported in part by several state public health departments and cancer registries throughout the United States. For a full description of these sources, please see http://breastscreening.cancer.gov/work/ acknowledgement.html. The content is solely the respon-sibility of the authors and does not necessarily represent the official views of the National Cancer Institute or the National Institutes of Health.
q RSNA, 2016
Purpose: To establish performance benchmarks for modern screen-ing digital mammography and assess performance trends over time in U.S. community practice.
Materials and
Methods: This HIPAA-compliant, institutional review board–approved study measured the performance of digital screening mam-mography interpreted by 359 radiologists across 95 facilities in six Breast Cancer Surveillance Consortium (BCSC) regis-tries. The study included 1 682 504 digital screening mam-mograms performed between 2007 and 2013 in 792 808 women. Performance measures were calculated according to the American College of Radiology Breast Imaging Reporting and Data System, 5th edition, and were compared with pub-lished benchmarks by the BCSC, the National Mammogra-phy Database, and performance recommendations by expert opinion. Benchmarks were derived from the distribution of performance metrics across radiologists and were presented as 50th (median), 10th, 25th, 75th, and 90th percentiles, with graphic presentations using smoothed curves.
Results: Mean screening performance measures were as follows: abnormal interpretation rate (AIR), 11.6 (95% confidence interval [CI]: 11.5, 11.6); cancers detected per 1000 screens, or cancer detection rate (CDR), 5.1 (95% CI: 5.0, 5.2); sensitivity, 86.9% (95% CI: 86.3%, 87.6%); specificity, 88.9% (95% CI: 88.8%, 88.9%); false-negative rate per 1000 screens, 0.8 (95% CI: 0.7, 0.8); positive predictive value (PPV) 1, 4.4% (95% CI: 4.3%, 4.5%); PPV2, 25.6% (95% CI: 25.1%, 26.1%); PPV3, 28.6% (95% CI: 28.0%, 29.3%); cancers stage 0 or 1, 76.9%; minimal cancers, 57.7%; and node-negative invasive cancers, 79.4%. Recommended CDRs were achieved by 92.1% of radiologists in community practice, and 97.1% achieved recommended ranges for sensitivity. Only 59.0% of radiologists achieved recommended AIRs, and only 63.0% achieved recommended levels of specificity.
Conclusion: The majority of radiologists in the BCSC surpass cancer detection recommendations for screening mammography; however, AIRs continue to be higher than the recom-mended rate for almost half of radiologists interpreting screening mammograms.
q RSNA, 2016
Online supplemental material is available for this article. Constance D. Lehman, MD, PhD
Robert F. Arao, MPH Brian L. Sprague, PhD Janie M. Lee, MD, MSc Diana S. M. Buist, PhD, MPH Karla Kerlikowske, MD
Louise M. Henderson, PhD, MSPH Tracy Onega, PhD, MS, MA Anna N. A. Tosteson, ScD Garth H. Rauscher, PhD Diana L. Miglioretti, PhD
Benchmarks for Modern
screening Digital Mammography:
Update from the Breast Cancer
The purpose of our study was to estab-lish performance benchmarks for mod-ern screening digital mammography and to assess performance trends over time in U.S. community practice.
Materials and Methods
Data Source
This study included six BCSC mammog-raphy registries (Carolina Mammogra-phy Registry, Group Health Coopera-tive, New Hampshire Mammography Network, Vermont Breast Cancer Sur-veillance System, San Francisco Mam-mography Registry, and Metropolitan Chicago Breast Cancer Registry) that have previously been described in detail (14,15). In brief, each registry links its cancer mortality and the only screening
test for breast cancer supported by the United States Preventive Services Task Force and the American Cancer Society (10,11). To improve the quality of mam-mography, in the 1980s, the American College of Radiology (ACR) developed the Breast Imaging Reporting and Data System (BI-RADS) (12) and established a voluntary accreditation program that supported passage of the Mammogra-phy Quality Standards Act by Congress in 1992.
Although randomized trials per-formed in the 1960s and 1970s with now-outdated mammography technol-ogy have confirmed that mammographic screening reduces breast cancer mor-tality, randomized trials with mortality as an end point are not feasible to con-tinue to assess either the effectiveness of new technology or factors associated with improved interpretive skills of ra-diologists reading screening mammo-grams. The Breast Cancer Surveillance Consortium (BCSC) is uniquely posi-tioned to assess trends over the past 2 decades in screening mammography performance in U.S. community prac-tice. A decade ago, the BCSC published performance benchmarks for screen-ing mammography in U.S. community practice (13). These metrics informed the ACR BI-RADS to establish perfor-mance benchmarks for U.S. practice and also identified opportunities for im-provements in future practice.
Two key changes have occurred to improve screening mammography per-formance in community practice. The first is transition from screen-film mam-mography to full-field digital mammog-raphy, and the second is expansion of training programs to enhance the in-terpretive skills of radiologists engaged in screening mammography programs.
Published online before print
10.1148/radiol.2016161174 Content codes:
Radiology 2017; 283:49–58
Abbreviations:
ACR = American College of Radiology AIR = abnormal interpretation rate
BCSC = Breast Cancer Surveillance Consortium BI-RADS = Breast Imaging Reporting and Data System CDR = cancer detection rate
CI = confidence interval DCIS = ductal carcinoma in situ FN = false-negative FNR = FN rate FP = false-positive
NMD = National Mammography Database PPV = positive predictive value
SEER = Surveillance, Epidemiology, and End Results TN = true-negative
TP = true-positive
Author contributions:
Guarantors of integrity of entire study, C.D.L., R.F.A., D.S.M.B., K.K.; study concepts/study design or data acquisition or data analysis/interpretation, all authors; manuscript drafting or manuscript revision for important intellectual content, manuscript final version approval, all authors; approval of final version of submitted manuscript, all authors; agrees to ensure any questions related to the work are appropriately resolved, all authors; literature research, C.D.L., J.M.L., K.K., L.M.H., T.O.; clinical studies, C.D.L., K.K., L.M.H., T.O., D.L.M.; statistical analysis, C.D.L., R.F.A., G.H.R., D.L.M.; and manuscript editing, C.D.L., R.F.A., J.M.L., D.S.M.B., K.K., L.M.H., T.O., A.N.A.T., G.H.R., D.L.M.
Conflicts of interest are listed at the end of this article.
See also the article by Sprague et al and the editorial by D’Orsi and Sickles in this issue.
Advances in Knowledge
n Mean performance measures for
modern digital screening mam-mography in the Breast Cancer Surveillance Consortium (BCSC) were as follows: abnormal inter-pretation rate (AIR), 11.6 (95% confidence interval [CI]: 11.5, 11.6); cancers detected per 1000 screens, 5.1 (95% CI: 5.0, 5.2); sensitivity, 86.9% (95% CI: 86.3%, 87.6%); specificity, 88.9% (95% CI: 88.8%, 88.9%); false-negative rate per 1000 screens, 0.8 (95% CI: 0.7, 0.8); positive predictive value (PPV) 1, 4.4% (95% CI: 4.3%, 4.5%); PPV2, 25.6% (95% CI: 25.1%, 26.1%); PPV3, 28.6% (95% CI: 28.0%, 29.3%).
n Compared with prior perfor-mance reports of screening mammography in the BCSC (1996–2008), the sensitivity of screening mammography has increased from 78.7% to 86.9%. n More than 92% of radiologists in
community practice achieve rec-ommended rates of cancers detected per 1000 women screened, and more than 97% achieve recommended ranges for sensitivity.
n More than 40% of radiologists have AIRs outside the recom-mended ranges, and more than 37% fall below recommended ranges for specificity.
Implication for Patient Care
n Efforts to develop and implement advanced technology and effec-tive educational programs to reduce false-positive rates with-out sacrificing improved detec-tion of invasive node-negative cancers are encouraged.
M
ore than 50 years ago, Wolfe(1) reported results in 3891 women undergoing screening mammography and emphasized the im-portance of identifying small, clinically occult, node-negative breast cancers to afford women both the best options for treatment and the best chance for cure. Subsequent randomized clinical trials confirmed that screening mammogra-phy significantly reduces breast cancer mortality (2–9).
mammography data to a state tumor or Surveillance, Epidemiology, and End Results (SEER) registry, and data are pooled at a central Statistical Coordinat-ing Center. Prior reports of BCSC reg-istries and the Statistical Coordinating Center are available at http://www.bcsc-research.org/publications/index.html.
Study Population
Our study included women 18 years of age or older who underwent at least one digital screening mammography exami-nation (hereafter called “mammogram”) between 2007 and 2013. To measure performance trends over time, we also included previously reported data from the BCSC between the years 1996 and 2008 (16). Examinations occurring within 9 months of a prior mammogram or breast ultrasonographic (US) exami-nation were excluded to remove poten-tial diagnostic mammograms. We also excluded women with breast augmenta-tion, because we were unable to distin-guish implant displacement views from diagnostic views obtained the same day.
Mammographic Data Collection Procedures and Definitions
Across all BCSC registries, women complete a questionnaire at each visit that includes questions about their per-sonal history of breast cancer, family history of breast cancer, date of last mammogram, menopausal status, and self-reported symptoms. We calculated the BCSC version 1 5-year risk score, which estimates the probability of in-vasive breast cancer within the next 5 years on the basis of age, race, ethnic-ity, family history, history of breast bi-opsy, and breast density (17).
All BCSC registries capture BI-RADS assessment and recommendation cate-gories assigned by the interpreting ra-diologist for each mammogram. For the purposes of this study, we created an initial overall assessment for the screen-ing examination, usscreen-ing the most serious BI-RADS assessment according to the following hierarchy: negative, 1; benign, 2; probably benign, 3; needs additional evaluation, 0; suspicious, 4; and highly suggestive of malignancy, 5. We followed ACR BI-RADS 5th edition definitions for
all metrics (12). For all measures except positive predictive value (PPV) 2 and PPV3, a positive mammogram was de-fined as one with initial assessment cate-gories 0, 3, 4, or 5. For PPV2 and PPV3, a positive mammogram was defined as one with final assessment categories 4 or 5. As per BI-RADS audit rules, any mammogram with a BI-RADS 6 assess-ment (known breast cancer) was ex-cluded from analyses.
Women were considered to have breast cancer if a state tumor or SEER registry or pathology database indi-cated the diagnosis of invasive breast carcinoma or ductal carcinoma in situ (DCIS) within 12 months after a screening mammogram and before the next screening mammogram.
Outcome Measurements and Statistical Analysis
Following ACR BI-RADS 5th edition definitions, a true-positive (TP) mam-mogram was a positive mammam-mogram followed by the diagnosis of breast cancer within 12 months. A true-nega-tive (TN) mammogram was a negatrue-nega-tive mammogram followed by no diagnosis of breast cancer within 12 months. A false-positive (FP) mammogram was a mammogram interpreted as positive with no breast cancer diagnosed within 12 months. A false-negative (FN) mam-mogram was a negative mammam-mogram followed by a diagnosis of breast can-cer within 12 months. Cancan-cer detection rate (CDR) was defined as the number of TP examinations divided by the total number of screening mammograms. FN rate (FNR) was defined as the number of FN examinations divided by the to-tal number of screening mammograms. Sensitivity was calculated by dividing the number of TP examinations by the total number of examinations associated with cancer (TP + FN), and specificity was calculated by dividing the number of TN examinations by the total number of ex-aminations without cancer (TN + FP).
The following three PPV calculations were made by using BI-RADS meth-odology: PPV1 (probability of cancer following initial assessment of 0, 3, 4, or 5), PPV2 (probability of cancer following a final assessment of 4 or 5), and PPV3
(probability of cancer among patients with biopsy performed after final assess-ment of 4 or 5). For screens with an ini-tial BI-RADS assessment of 0, the final assessment was determined from addi-tional imaging records up to 180 days after the screening examination.
Statistical Analysis
Descriptive statistics (frequencies, per-centiles, means, and medians) were chosen to provide clinically relevant screening performance benchmarks. We illustrate the variability across ra-diologists using percentile values to in-dicate ranges that describe the middle 50% and 80%. For example, the spec-trum from 25th to 75th percentile values defines the range within which the middle 50% of performance was found, and the spectrum from 10th to 90th percentile values defines the range within which the middle 80% of perfor-mance was found.
To reduce the amount of random statistical variation in these data, we reported outcomes from radiologists who contributed a minimum number of events for each outcome, as follows: 1000 examinations for abnormal inter-pretation (recall) rate and CDR, 3000 examinations for FNR, 100 abnormal interpretations for PPV1, 30 biopsies recommended for PPV2, 30 biopsies performed for PPV3, 30 cancer cases for sensitivity, 1000 noncancers for specificity, and 15 cancers with com-plete information on the outcome cri-teria for cancer measurements. We used graphic presentations (frequency distributions overlaid with percentile values) to display these data in an eas-ily understandable format. All analyses were performed by using SAS software, version 9.3 (SAS Institute, Chicago, Ill), and all figures were produced by using STATA, version 12.1 (Stata, College Sta-tion, Tex).
Results
are comparable to those of the U.S. population (Table E1 [online]), al-though the study population includes slightly more rural and more educated women, more Asian women, and fewer Latina women. There were no impor-tant differences in African American representation or in economic status.
The mean age of women undergo-ing screenundergo-ing mammography was 56.5 years. The majority (80.4%) of screen-ing mammograms were performed in women aged 40–69 years; 29.3% of all screening mammograms were per-formed in women younger than 50 years of age, and 60.9% were performed in women aged 50–74 years. In women given a diagnosis of breast cancer, the majority (76.0%) had no family history
of breast cancer, 85.0% had no personal history of breast cancer, and 84.9% had a BCSC 5-year risk of less than 2.5%. Breast density distributions did not dif-fer in women with a breast cancer diag-nosis versus in women without a breast cancer diagnosis (Table 1).
Mammographic Performance Measures The mean abnormal interpretation rate (AIR) was 11.6% (95% confidence in-terval [CI]: 11.5, 11.6). Of 1 682 504 ex-aminations, 8529 breast cancers were diagnosed after a positive mammogram, for a total CDR of 5.1 (95% CI: 5.0, 5.2) per 1000 screening examinations. The
invasive CDR was 3.5 cancers per 1000 examinations, and the DCIS detection rate was 1.6 cancers per 1000 examina-tions. The sensitivity of screening mam-mography was 86.9% (95% CI: 86.3%, 87.6%), and the specificity was 88.9% (95% CI: 88.8%, 88.9%). There were 1283 FN examinations out of 1 682 504 examinations, for an FNR of 0.8 exami-nations per 1000 (95% CI: 0.7, 0.8). Out of 194 668 examinations with an initial BI-RADS category of 0, 3, 4, or 5, 8529 cancers were diagnosed, for a PPV1 of 4.4 (95% CI: 4.3, 4.5). Out of 28 785 ex-aminations with a final BI-RADS category of 4 or 5, 7376 cancers were diagnosed, Table 1
Clinical Demographics for 1 682 504 Screening Mammographic Examinations
Characteristic
Total No. of Examinations
Total No. of Examinations with Cancer
Age group (y)
29 957 (0.1) 7 (0.1)
30–39 40 522 (2.4) 114 (1.2)
40–49 448 587 (26.7) 1679 (17.1)
50–59 505 816 (30.1) 2494 (25.4)
60–69 396 943 (23.6) 2930 (29.9)
70–79 209 747 (12.5) 1817 (18.5)
80 79 932 (4.8) 771 (7.9)
Race
White, non-Hispanic 1 125 330 (71.5) 6919 (75.3)
Black, non-Hispanic 141 197 (9.0) 802 (8.7)
Asian/Pacific Islander 175 281 (11.1) 973 (10.6)
Native American 4266 (0.3) 14 (0.2)
Latina 56 296 (3.6) 251 (2.7)
Mixed/other 71 575 (4.5) 230 (2.5)
Unknown 108 559 623
Family history of breast cancer
No 1 163 946 (83.1) 6230 (76.0)
Yes 235 882 (16.9) 1968 (24.0)
Unknown 282 676 1614
Personal history of breast cancer
No 1 156 765 (94.9) 5793 (85.0)
Yes 61 628 (5.1) 1022 (15.0)
Unknown 464 111 2997
History of prior breast biopsy
No 1 349 949 (80.7) 6818 (69.7)
Yes 323 567 (19.3) 2963 (30.3)
Unknown 8988 31
Table 1 (continues)
Table 1 (continued)
Clinical Demographics for 1 682 504 Screening Mammographic Examinations
Characteristic
Total No. of Examinations
Total No. of Examinations with Cancer
Time since last mammogram
No previous mammogram 59 766 (3.7) 300 (3.2)
Within a year (0–11 months) 19 015 (1.2) 155 (1.7)
1–2 Years (12–35 months) 1 388 776 (86.6) 7532 (81.6)
+3 Years (36 months) 135 255 (8.4) 1247 (13.5)
Unknown 79 692 578
Menopausal status
Premenopausal 372 059 (25.7) 1602 (17.8)
Postmenopausal 1 019 146 (70.3) 7143 (79.5)
Surgical/other amenorrhea 57 642 (4.0) 237 (2.6)
Unknown 233 657 830
Breast density
Almost entirely fat 168 015 (11.1) 707 (8.4)
Scattered fibroglandular densities 632 529 (41.9) 3605 (42.7)
Heterogeneously dense 587 049 (38.9) 3484 (41.3)
Extremely dense 122 496 (8.1) 641 (7.6)
Unknown 172 415 1375
Self-reported symptoms*
No 1 292 619 (98.3) 7413 (94.2)
Yes 22 890 (1.7) 453 (5.8)
Unknown 366 995 1946
5-Year risk (%)
,1.00 459 436 (34.5) 1361 (20.9)
1.00–1.66 488 329 (36.6) 2434 (37.3)
1.67–2.49 270 977 (20.3) 1746 (26.8)
2.50–3.99 101 449 (7.6) 841 (12.9)
4.00 12 376 (0.9) 143 (2.2)
Unknown 349 937 3287
Note.—Data in parentheses are percentages.
Table 2
Performance Measures for 1 682 504 Screening Digital Mammography Examinations
Measure Value*
AIR (recall rate) (%) 11.6 (11.5,11.6)
No. of abnormal interpretations 194 668
Total no. of examinations 1 682 504
CDR (per 1000 examinations) 5.1 (5.0, 5.2)
No. of cancers detected 8529
Total no. of examinations 1 682 504
Sensitivity (%) 86.9 (86.3, 87.6)
No. of TP examinations 8529
No. of cancers 9812
Specificity (%) 88.9 (88.8, 88.9)
No. of TN examinations 1 486 553
No. of noncancers 1 672 692
FNR (per 1000 examinations) 0.8 (0.7, 0.8)
No. of FN examinations 1283
Total no. of examinations 1 682 504
PPV1, abnormal interpretations (%) 4.4 (4.3, 4.5)
No. of cancers 8529
Initial BI-RADS category of 0,3,4, or 5 194 668
PPV2, biopsy recommended (%) 25.6 (25.1, 26.1)
No. of cancers 7376
Final BI-RADS category of 4 or 5 28 785
PPV3, biopsy performed (%)† 28.6 (28.0, 29.3)
No. of cancers 5945
Final BI-RADS category 4 or 5 with biopsy 20 763
* Data in parentheses are 95% CIs, which were based on Wald asymptotic confidence limits.
† Excludes Chicago.
for a PPV2 of 25.6 (95% CI: 25.1, 26.1). The PPV3 calculated (5945 cancers out of 20 763 examinations with final BI-RADS category 4 or 5 with biopsy) was 28.6 (95% CI: 28.0, 29.3) (Tables 2, 3).
Cancers Detected with Digital Screening Mammography
Of the 8529 cancers detected with mammography, 2644 (31%) were DCIS and 5885 (69%) were invasive. Of the
invasive cancers, 38.3% were 10 mm or smaller, 40.2% were between 11 and 20 mm, and 21.5% were larger than 20 mm at time of diagnosis. The majority (76.9%) of all cancers were diagnosed at stage 0 or 1, and 4816 (57.7%) were minimal cancers (defined as DCIS or
invasive cancers 10 mm). Of 5789
cancers with known nodal status, 4599 (79.4%) were node negative. Fifty-two (0.6%) of 8354 cancers were metastatic at the time of diagnosis (Tables 3, 4).
Radiologists Performing within Acceptable Ranges
Overall, radiologists performed better for measures of cancer detection and Table 3
Performance Measures for 1 682 504 Screening Digital Mammography Examinations from 2007 to 2013
Performance Measure 1996–2005 2004–2008 2007–2013* NMD 2008–2012†
AIR (recall rate) (%) 10.9 10.0 11.6 (11.5, 11.6) 10.0
CDR (per 1000 examinations) 4.8 4.3 5.1 (5.0, 5.2) 3.43
Sensitivity (%) 78.7 84.9 86.9 (86.3, 87.6) NA
Specificity (%) 89.5 90.3 88.9 (88.8, 88.9) NA
FNR (per 1000 examinations) 0.8 (0.7, 0.8) NA
PPV1, abnormal interpretations (%) 4.4 4.2 4.4 (4.3, 4.5) NA
PPV2, biopsy recommended (%) 25.1 23.9 25.6 (25.1, 26.1) 18.5
PPV3, biopsy performed (%) 31.8 27.9 28.6 (28.0, 29.3) 29.2
* Data in parentheses are 95% CIs, which were based on Wald asymptotic confidence limits.
† NMD = National Mammography Database, NA = not applicable.
Table 4
Characteristics of Cancers Detected with Digital Screening Mammographic Examinations
Characteristic Value
Total no. of detected cancers 8529
Cancer histologic type
DCIS 2644 (31.0)
Invasive 5885 (69.0)
Invasive cancer size (mm)*
1–5 727 (12.7)
6–10 1461 (25.6)
11–15 1459 (25.5)
16–20 840 (14.7)
.20 1228 (21.5)
Unknown 170
Minimal cancer†
No 3527 (42.3)
Yes 4816 (57.7)
Unknown 186
Axillary lymph node status‡
Negative 4599 (79.4)
Positive 1190 (20.6)
Unknown 96
Cancer stage
0 2644 (31.6)
I 3784 (45.3)
II 1585 (19.0)
III 289 (3.5)
IV 52 (0.6)
Unknown 175
Note.—Data in parentheses are percentages. * Mean = 15.9 mm and median = 13.0 mm among known invasive cancer sizes.
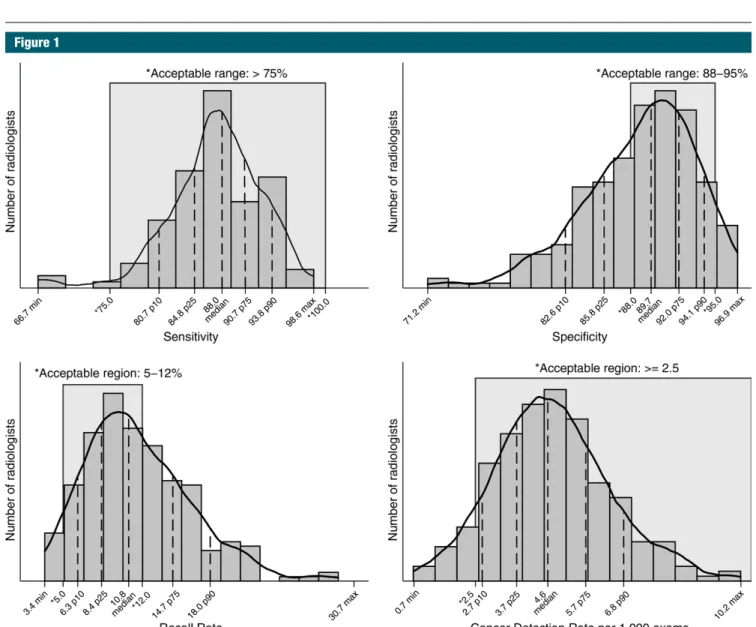
sensitivity and worse for measures of recall rates and specificity (Fig 1). The range of sensitivities of the middle 50% of all radiologists was 84.8%–90.7%, with 97.1% of radiologists perform-ing in the acceptable range of greater than 75% sensitivity. More than 92% of radiologists achieved the recom-mended acceptable range of greater than 2.5 cancers detected per 1000 examinations, with 50% of radiologists performing within the range of 3.7–5.7 cancers detected per 1000 examina-tions. The range of recall, or abnormal
interpretation, rates of the middle 50% of all radiologists was 8.4–14.7, with only 59.0% of radiologists performing within the recommended acceptable range of 5%–12%. For specificity, 50% of radiologists performed within the range of 85.8%–92.0% and only 63.0% met the acceptable range of 88%–95% specificity.
For 194 radiologists contributing 3000 or more examinations, 50% had FNRs between 0.5 and 1.0 per 1000 examinations (Fig 2). A large percent-age (62%) of radiologists did not meet
the recommended range of 20%–40% PPV2 (cancers diagnosed in all exami-nations assessed as BI-RADS category 4 or 5). Roughly one in four radiologists had a PPV2 of less than 20% (Fig 3). The range of PPV3 values for half of all radiologists was 23.0–39.0. Twenty-five percent of radiologists performed below this range and 25% performed higher than this range.
For radiologists who detected 15 or more cancers, 50% identified between 73% and 84% of cancers at stage 0 or 1. In addition, 50% of radiologists Figure 1
Figure 2
Figure 3
Figure 3: Graph shows PPVs. PPV1 was restricted to final readers with 100 or more abnormal examinations (n = 255). PPV2 was restricted to final readers with 30 or more recommended biopsies (n = 172). PPV3 was restricted to final readers with 30 or more biopsies performed (n = 125). Max = maximum, min = minimum, p10 = 10th percentile, p25 = 25th percentile, p75 = 75th percentile,
p90 = 90th percentile.
Figure 2: Graph shows FNR, which was restricted to final readers with 3000 or more examinations (n = 194). Max = max-imum, min = minimum,
p10 = 10th percentile,
p25 = 25th percentile,
p75 = 75th percentile,
Figure 4
diagnosed between 75% and 87% of cancers while they were node negative (Fig 4). For the 111 radiologists who diagnosed at least 15 invasive cancers in the study period, 50% identified in-vasive cancers in the range of 13.6– 16.8 mm (Fig 5).
Discussion
National performance benchmarks for screening mammography were pub-lished previously by the BCSC in 2006 and were subsequently updated in 2008, on the basis of examinations performed from 1996 to 2005 and from 2004 to 2008, respectively (17). Our study pro-vides more recent estimates of modern digital screening mammography per-formance in the United States on the
basis of examinations performed from 2007 to 2013. We restricted our study to digital mammography to provide performance measures most relevant for current clinical practice. Among the overall statistics and variation across radiologists provided in our study, a few key findings stand out.
First, the sensitivity for modern digital screening mammography in the BCSC is higher than prior BCSC re-ports from the pre-digital era (86.9% vs 78.7%). This likely reflects the im-proved performance of digital mam-mography compared with screen-film mammography in women with dense breast tissue (18,19), which includes almost half of women undergoing screening mammography. In particu-lar, more cases of DCIS are diagnosed
with modern screening mammogra-phy than in the prior BCSC reports (21% of cancers diagnosed in 2004– 2008 BCSC examinations were DCIS, compared with 31% of cancers di-agnosed in our current study) (13). The rate of invasive cancers per 1000 examinations in our study was 3.5 invasive cancers detected per 1000 women screened, compared with the prior 1996–2005 BCSC report of 3.7 invasive cancers detected per 1000 women screened. Details of cancers detected are not available from the NMD, precluding comparison.
Second, the CDR of 5.1 cancers per 1000 examinations in our study is significantly higher than that re-ported by the NMD (3.43 per 1000 [95% CI: 3.2, 3.7]). This may in part be explained by the improved ability of the BCSC to collect pathology data from multiple sources, including state tumor registries, compared with the NMD, which relies on data collected by radiology facilities alone. The total rate of all cancers (those detected and those not detected with mammogra-phy) was 5.9 per 1000 (95% CI: 5.7, 6.0). The total rate of cancers is not Figure 4: Graphs show cancer characteristics. Percentage minimal cancer was restricted to final readers with 15 or more detected cancers (n = 140) of known size. Percentage of cancers that were node negative was restricted to fi-nal readers with 15 or more detected invasive cancers (n = 111) of known size. Percentage of cancers that were stage 0 or 1 was restricted to final readers with 15 or more detected cancers (n = 143) of known stage. Max = maximum,
available from the NMD, precluding comparison.
Last, the mean AIR in our study of 11.6% was higher than those in the 2005 and 2008 BCSC reports (10.9% and 10.0%, respectively) and higher than the 10.0% rate reported by the NMD (14,20). This is particularly con-cerning, given that recall rates have continually failed to meet the recom-mendations of the ACR and other ex-pert panels going back to the initial BCSC report in 2005, despite calls for attention to this matter (13). Increas-ing access to tomosynthesis imagIncreas-ing for screening could yield improve-ments in recall rates, with current data suggesting that tomosynthesis can reduce recalls by 15%–20% (21– 24)—down from initial estimates of 30%–40% (25,26). However, extreme variation across facilities and individ-uals threatens this gain. For instance, four of the 13 sites in the largest U.S. multicenter report had recall rates for mammograms performed with tomosynthesis that were well above the recommended rates for digital
mammography alone (23). Adequate education and training of new users must be matched with ongoing quality assurance efforts if tomosynthesis is to achieve its full benefits in community clinical practice.
A notable limitation of our study was that, despite the large sample size, not all radiologists contributed suffi-cient interpretations to be included in all performance measures. Given the low rates of cancers in average-risk screening populations combined with the relatively low numbers of mam-mograms required for credentialing in the United States, accurate estimates of sensitivity necessarily exclude many radiologists in practice. Hence, radi-ologists with lower numbers of mam-mograms may not achieve the same high sensitivities we found in the 104 of 359 radiologists who contributed at least 1000 screening mammogram interpretations during the study pe-riod. Individual radiologists and breast imaging facilities can nonetheless use our results to gauge their performance against this national cohort.
In summary, we found that the majority of radiologists in U.S. com-munity practice surpass most perfor-mance recommendations of the ACR; however, AIRs continue to be higher than the recommended rate for al-most half of radiologists interpreting screening mammograms. Programs to support second reviews of mammo-grams recalled by radiologists known to “overcall” mammograms could be implemented. The second reviews of the recalls could be performed by radi-ologists with documented high perfor-mance for both recall and CDRs. The resource investment would be man-ageable for most practices, as it would require second reads of roughly only 11%–20% of mammograms read by the radiologists with poor specificity, rather than second reads of all mammograms. The latter approach (second reads of all mammograms) would be required for radiologists who performed below benchmarks for CDRs. In our study, we found this was a relatively uncommon scenario.
Mammography screening programs stand out as unique in imaging because they are required by law to perform practice audits. However, currently there are no requirements for additional training or practice restrictions for ra-diologists performing below minimal performance standards. Carney et al (27) have shown the potential positive impacts on our patients and health care expenditures if all radiologists were to meet minimally acceptable standards of performance. Yet achieving this end will likely require remedial or restrictive action to be taken regarding subpar per-formers. Whether we are ready to take this next step in quality assurance and cost containment in screening mammog-raphy warrants careful consideration.
Acknowledgments: We thank the BCSC
inves-tigators, participating women, mammography facilities, and radiologists for the data they have provided for this study. A list of the BCSC in-vestigators and procedures for requesting BCSC data for research purposes is provided at http:// breastscreening.cancer.gov/.
Disclosures of Conflicts of Interest: C.D.L.
dis-closed no relevant relationships. R.F.A. disclosed no relevant relationships. B.L.S. disclosed no rele-Figure 5
Figure 5: Graph shows results for mean invasive cancer size. Mean size was restricted to final readers with 15 or more detected invasive cancers (n = 111) of known size. Max = maximum, min = minimum, p10 = 10th percentile, p25
vant relationships. J.M.L. Activities related to the present article: none to disclose. Activities not re-lated to the present article: institution has received grants from GE for the STAR Study. Other rela-tionships: none to disclose. D.S.M.B. disclosed no relevant relationships. K.K. disclosed no relevant relationships. L.M.H. disclosed no relevant rela-tionships. T.O. disclosed no relevant relationships.
A.N.A.T. disclosed no relevant relationships.
G.H.R. disclosed no relevant relationships. D.L.M.
disclosed no relevant relationships.
References
1. Wolfe JN. Mammography as a screening exam-ination in breast cancer. Radiology 1965;84: 703–708.
2. Independent UK Panel on Breast Cancer Screening. The benefits and harms of breast cancer screening: an independent review. Lancet 2012;380(9855):1778–1786.
3. Shapiro S, Venet W, Strax P, Venet L, Roes-er R. Ten- to fourteen-year effect of screen-ing on breast cancer mortality. J Natl Can-cer Inst 1982;69(2):349–355.
4. Andersson I, Janzon L, Sigfússon BF. Mam-mographic breast cancer screening: a ran-domized trial in Malmö, Sweden. Maturitas 1985;7(1):21–29.
5. Tabár L, Fagerberg CJ, Gad A, et al. Re-duction in mortality from breast cancer after mass screening with mammography: randomised trial from the Breast Cancer Screening Working Group of the Swedish National Board of Health and Welfare. Lan-cet 1985;1(8433):829–832.
6. Roberts MM, Alexander FE, Anderson TJ, et al. The Edinburgh randomised trial of screening for breast cancer: description of method. Br J Cancer 1984;50(1):1–6.
7. Frisell J, Glas U, Hellström L, Somell A. Randomized mammographic screening for breast cancer in Stockholm: design, first round results and comparisons. Breast Can-cer Res Treat 1986;8(1):45–54.
8. Miller AB, Howe GR, Wall C. The National Study of Breast Cancer Screening Protocol for a Canadian randomized controlled trial
of screening for breast cancer in women. Clin Invest Med 1981;4(3-4):227–258.
9. Bjurstam N, Björneld L, Duffy SW, et al. The Gothenburg breast screening trial: first results on mortality, incidence, and mode of detection for women ages 39-49 years at ran-domization. Cancer 1997;80(11):2091–2099.
10. Oeffinger KC, Fontham ET, Etzioni R, et al. Breast cancer screening for women at average risk: 2015 guideline update from the Ameri-can Cancer Society. JAMA 2015;314(15): 1599–1614.
11. DeAngelis CD, Fontanarosa PB. US Preven-tive Services Task Force and breast cancer screening. JAMA 2010;303(2):172–173.
12. American College of Radiology. American College of Radiology Breast Imaging Report-ing and Data System Atlas (BI-RADS Atlas). Reston, Va: American College of Radiology, 2013.
13. Rosenberg RD, Yankaskas BC, Abraham LA, et al. Performance benchmarks for screen-ing mammography. Radiology 2006;241(1): 55–66.
14. National Cancer Institute DoCCPS, Health-care Delivery Research Program. Breast Cancer Surveillance Consortium. Updated July 6, 2015. Accessed March 4, 2016.
15. Ballard-Barbash R, Taplin SH, Yankaskas BC, et al. Breast Cancer Surveillance Con-sortium: a national mammography screen-ing and outcomes database. AJR Am J Roentgenol 1997;169(4):1001–1008.
16. National Cancer Institute Breast Cancer Surveillance Consortium. Performance Benchmarks for Screening Mammography (HHSN261201100031C). http://breast- screening.cancer.gov/statistics/bench-marks/screening/. Updated May 20, 2015. Accessed May 8, 2016.
17. Tice JA, Cummings SR, Smith-Bindman R, Ichikawa L, Barlow WE, Kerlikowske K. Using clinical factors and mammographic breast density to estimate breast cancer risk: development and validation of a new predic-tive model. Ann Intern Med 2008;148(5): 337–347.
18. Kerlikowske K, Hubbard RA, Miglioretti DL, et al. Comparative effectiveness of digital versus film-screen mammography in community practice in the United States: a cohort study. Ann Intern Med 2011;155(8): 493–502.
19. Pisano ED, Gatsonis C, Hendrick E, et al. Diagnostic performance of digital versus film mammography for breast-cancer screening. N Engl J Med 2005;353(17):1773–1783. 20. Lee CS, Bhargavan-Chatfield M, Burnside
ES, Nagy P, Sickles EA. The National Mam-mography Database: preliminary data. AJR Am J Roentgenol 2016;206(4):883–890. 21. Skaane P, Bandos AI, Gullien R, et al.
Com-parison of digital mammography alone and digital mammography plus tomosynthesis in a population-based screening program. Ra-diology 2013;267(1):47–56.
22. Ciatto S, Houssami N, Bernardi D, et al. In-tegration of 3D digital mammography with tomosynthesis for population breast-cancer screening (STORM): a prospective compari-son study. Lancet Oncol 2013;14(7):583–589. 23. Friedewald SM, Rafferty EA, Rose SL, et al. Breast cancer screening using tomosynthe-sis in combination with digital mammogra-phy. JAMA 2014;311(24):2499–2507. 24. McCarthy AM, Kontos D, Synnestvedt M,
et al. Screening outcomes following imple-mentation of digital breast tomosynthesis in a general-population screening program. J Natl Cancer Inst 2014;106(11):dju316. 25. Rafferty EA, Park JM, Philpotts LE, et al.
Assessing radiologist performance using combined digital mammography and breast tomosynthesis compared with digital mam-mography alone: results of a multicenter, multireader trial. Radiology 2013;266(1): 104–113.
26. Gur D, Abrams GS, Chough DM, et al. Dig-ital breast tomosynthesis: observer perfor-mance study. AJR Am J Roentgenol 2009; 193(2):586–591.