Pieter M. Kroonenberg
Leiden University & The Three-Mode Company
Abstract
This paper is a mixture of my personal experiences of Jan de Leeuw as a supervisor of my master’s and Ph.D. theses, as well as a sketch of how three-way analysis, the subject Jan chose for me, developed over time. The emphasis is on where it is and was applied, and to what extent it stole the hearts of applied researchers in different disciplines. Furthermore, the paper contains some musings about how we should go about promoting the use of the techniques, especially in the social and behavioural sciences. Finally, an overview is provided of available software and attention is paid to how (three-way) software may be designed to encourage its use by the scientific community, as it befits a paper in theJournal of Statistical Software.
Keywords: Jan de Leeuw, three-way analysis, three-mode component analysis, applications, software, Fortran,Delphi.
1. The Lion and I
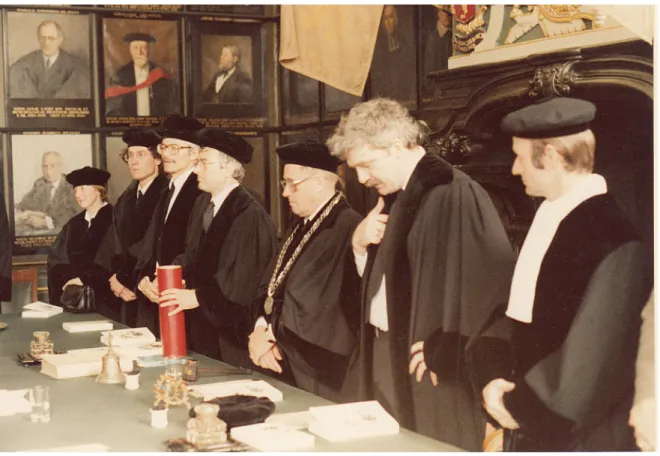
Figure 1: Committee for the Ph.D. defense of Pieter Kroonenberg.
Jan was and is a charismatic figure who in ancient times would have been the stuff of legends. A probably apocryphal story goes that one evening after a prolific drinking session he was handed the 460-page book by Warren Torgerson on Theory and Methods of Scaling ( Torg-erson 1958) with the message that this would probably be something worthwhile for him to read. And sure enough, the next morning after apparently having finished the book (when exactly is still a mystery) he summarised the author’s achievements and indicated places where interesting extensions of the procedures described in the book could be added.
Jan is a somewhat unconventional person who does not like formalities much (“undisciplined and wild” as he says in his own CVDe Leeuw 2016b). As a full professor in Leiden he seemed to have appeared once at a Ph.D. defense with a red sweater under his gown, while a dark suit with a white shirt and black tie are compulsory; see Figure1for an appropriately dressed Jan de Leeuw during my Ph.D. ceremony.
algorithm and 3000 IBM punch cards later the computer program was ready. I wrote the thesis on an electric typewriter with four “golf balls” that you could swap to get different fonts. Mistakes were covered up with correction tape; see also Jan’s similar experiences on the CV page of his website (De Leeuw 2016b).
The research bulletin based on my master’s thesis (Kroonenberg and De Leeuw 1977) was transformed into my first paper (Kroonenberg and De Leeuw 1978), which however was in Dutch. However, a couple of years later Jan wanted to know when the ‘real’ article for an English-language journal was forthcoming. He had even heard that there was some competition. And had he mentioned that I should really expand the three-way model from my master’s thesis with a second, more well-known variant (now known as the Tucker3 model)? ‘Otherwise it will not do’. So I did some more programming, this time on a real Teletype typewriter linked to an IBM mainframe, so there was no longer a need for punched cards and trips up and down to the Computer Centre. In 1979 I wrote the article that went with it, typed it up in IBM’s DisplayWrite3on a word processor the size of a bookcase, showed it to Jan as the obvious co-author, photocopied it six times, and sent it by post toPsychometrika.
A few months later I received to my surprise a letter from the journal (no email yet at the time) containing two articles about multivariate analysis of three-way data that had been submitted to the journal. The editor wanted to know what I thought about those articles in relation to my own. I went to see Jan, somewhat shell-shocked: “What am I supposed to do with this?”; “Well, answer the questions of course,” he said, “and tell them what you think”. This is what they call “reviewing an article”, but it was the first I’d heard of it. No matter, I rolled up my sleeves and got the job done.
A little after that I received a message to say our article had been accepted, conditional on certain additions and revisions. I set to work once more, but took my time. Until one day, now 35 years ago, an actual telegram arrived from the journal: “Where is your final version? We want to include your article in our March issue together with one of the others that you reviewed”. I quickly finished my paper and sent it off. I am proud to say that now, early in 2016, this article (Kroonenberg and De Leeuw 1980) is number four on Jan’s list of most cited papers.
for the chapter. Apparently Jan had sufficient faith in me, so that we managed go through the 400-page thesis in only a few sessions. The thesis itself was published by the now-defunct DSWO Press (Kroonenberg 1983).
My next academic encounter with Jan was later in 1983 when he received a request to con-tribute a paper to the first multi-mode data analysis book (Law, Snyder Jr., Hattie, and McDonald 1984). He put this request on my desk and said that this was typically something for me to do (Kroonenberg 1984). In 2005 he also asked me to contribute to theEncyclopedia of Statistics in Behavioral Science(Kroonenberg 2005).
2. The multiway world
Jan set me on the path of my life-long fascination with three-way, and later multiway data analysis. In this section I will present a brief introduction into three-way and multiway data analysis and provide a condensed overview what happened in that field over the years1.
2.1. A brief introduction to multiway component analysis
Even though multiway is more than way, in this paper I will consider the terms three-way and multithree-way component analysis as largely synonymous, because the fundamental step is actually from two-way to three-way analysis. The generalisation from three-way to multiway does not introduce any new mathematical or statistical intricacies, but primarily increases the notational and interpretational complexity. Thus, in this section I will concentrate on: “What is three-way component analysis?”
Before going into this, a word about the termsway andmode, both employed in this context. The first term, way, indicates the number of dimensions of a data box: one-way refers to a vector, two-way to a matrix, and three-way to an array: data that fit in a box. The second term, mode, refers to the content of a way. Within the social and behavioural sciences a standard two-way data matrix has rows (subjects) and columns (variables), and many three-way data boxes have rows (subjects), columns (variables), and tubes (conditions or time points). Hence, such data are three-way three-mode data. However, a set of correlation matrices is three-way but only two-mode, as the rows and columns both consist of the same entities, mostly variables. Thus, the word ’way’ is more general than the word ’mode’ and in what follows I will mainly use that.
Two-way principal component analysis is based on the singular value decomposition: a subject space spanned by the subject components, and a variable space spanned by the variable components plus the singular values (the square roots of the eigenvalues). Each subject component is uniquely linked to a variable component, so that they can occupy the same space and the size of the singular values indicates the strengths of the links between the two types of components.
Generalising this idea to the analysis of three-way data, we have to add a condition space spanned by the condition components. Again we can define links, but now for three sets of components; such links are referred to asthree-way singular values or as elements of the core
1This and some of the next sections are partly based on material from a paper published in Blasius and
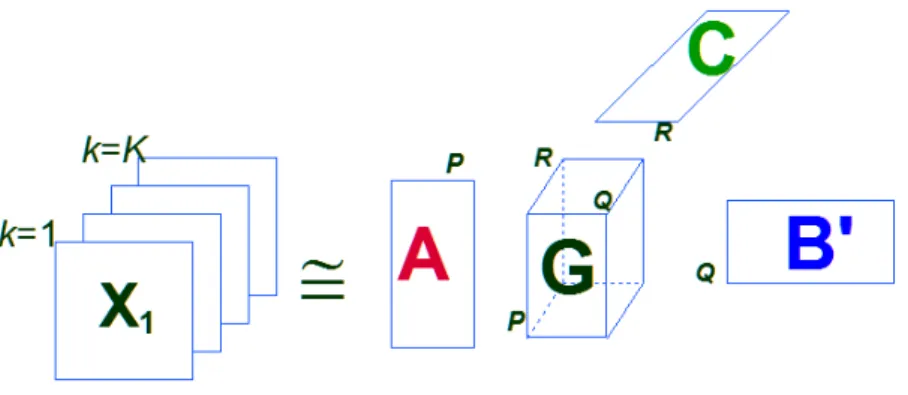
Figure 2: The Tucker3 model for the three-way data array X. A = Subject space with P components; B = Variable space withQ components; C= Condition space with R compo-nents; G = Core array with the P ×Q×R links between the components from the three ways.
array. The three-way component model was introduced by Tucker (1963; 1966; 1972), who also coined the wordcoreto indicate that the links in the core array play a fundamental role in modelling the relationships between the components of the three ways (see Figure2).
The other major three-way model is the parallel factors (PARAFAC) model (Harshman 1970; Harshman and Lundy 1984b,a, 1994). This model is also referred to as the CP model, an abbreviation of the CANDECOMP-PARAFAC model recognising Carroll and Chang’s1970 work on what they called the canonical decomposition (CANDECOMP) model. Later, an-other meaning was given to the same CP abbreviation, namely canonical polyadic decomposi-tion. The latter designation goes back to Hitchcock (Hitchcock 1927a,b) and was resurrected by researchers such as De Lathauwer, Comon, and Lek-Heng. In Figure2P=Q=Rare equal for the PARAFAC model, so that its core array is a cube which in addition is superdiagonal with onlyP elements.
The major differences between two-way and three-way models centre around the properties of uniqueness and complete decomposability. In the two-way component model the components can be transformed without losing fit of the model to the data. This transformational property is used extensively to enhance and facilitate interpretation. At the same time, the components are not unique, which hampers the theoretical identification of the solution.
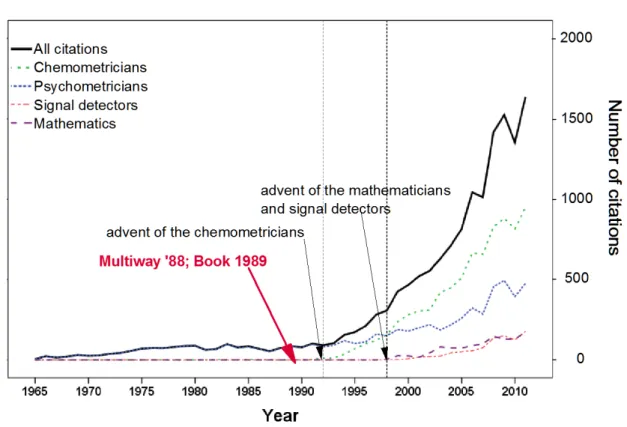
Figure 3: Citations to three-way and multiway papers by researchers from different disciplines. “Multiway 88; Book 1989” refers to the Multiway conference in Rome 1988;Coppi and Bolasco (1989) contains the proceedings.
2.2. The rise of multiway analysis
To get an idea of what went on in the multiway world we can take a look at what hap-pened with the proposed fundamental models over the years; in particular, what haphap-pened since Tucker’s introduction of three-mode data analysis in psychology (Tucker 1966)2 and Harshman’s ground-breaking work on the PARAFAC (or CP) model (Harshman 1970).
The curves in Figure 3 represent the number of citations to multiway articles written by authors from the fields of psychology, chemistry, signal detection, and mathematics, respec-tively. It is clear that there was a strong acceleration from 1992 onwards, and that for the time being there seems no end in sight. We can see that particularly in the field of chemistry the unbridled enthusiasm has continued unabated, but that researchers from other disciplines have become involved as well.
By the way, it is interesting to note that theoretical mathematicians such as Hitchcock came up with three-way models as early as 1927, but that for a long time mathematicians seemed to have forgotten about them. It was not until around 1998 that multiway models attracted their attention once more. It is noteworthy that psychometricians also started to publish in chemometric journals (e.g., Kiers and Harshman 1997; Kiers, Ten Berge, and Bro 1999; Harshman 2001; Kroonenberg and Van Ginkel 2012). This is primarily due to an
ever-2From Neil Dorans’s interview with Tucker (Dorans 2004) I learned that Tucker’s second initial R was not
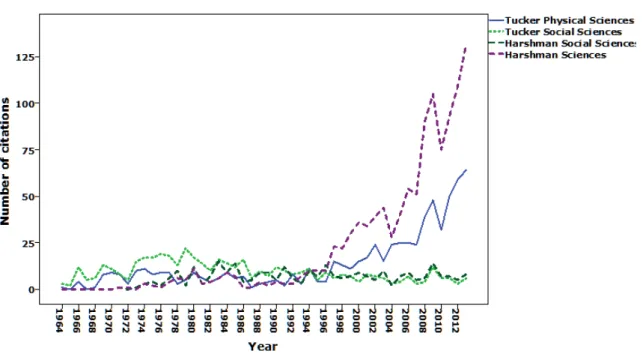
Figure 4: Citations to the work by L. R Tucker and R. A. Harshman in the social and behavioural, and in the physical sciences
increasing collaboration between psychometricians and chemometricians as a result of their triannual TRICAP (three-way methods in chemometrics and psychometrics) conferences; see, e.g., the early conference reports: Geladi (1994), Bro and Kiers (1997), and Van den Berg and Ceulemans(2003).
3. Multiway in the social and behavioural sciences
From Figure 3 one might get the impression that the increase in citations to psychometric three-way articles reflects an upsurge in their use in the social and behavioural sciences. Unfortunately, nothing is further from the truth. Figure4shows a very different picture. It is based on references to the work of the founding fathers Tucker and Harshman, split according to whether the citing author works in the natural sciences or in the social and behavioural sciences. We see that the increase in citations to the work of the two psychometricians is exclusively due to researchers from the natural sciences, rather than to researchers from their own discipline.
multi-variate descriptive techniques, and three-way techniques in particular, are mainly intended to model individual differences rather than test group characteristics such as averages, standard deviations, correlations, etc.
Moreover, social and behavioural scientists are missing something that in natural sciences such as chemistry is the motor for much three-way work: substantive theories that take the form of the statistical models used in three-way analysis. If such models are available, three-way techniques directly provide the estimates for the parameters of the formal physical models, and there is no need to wonder afterwards how parameters should be interpreted – which happens not infrequently in the social and behavioural sciences. This difference in modelling is discussed in, for instance, Hand’s presidential address to the Royal Statistical Society in 2009 under the heading “iconic models” versus “empirical models”. The physical sciences typically deal with the former, while the social and behavioural sciences have to make do with the latter. However, it should be understood that empirical modelling occurs in some way or another in nearly every kind of science, physical science included, as Hand convincingly demonstrates.
4. A cornucopia of applications
In this section I provide a brief and non-exhaustive overview of the breadth of topics that have been researched with multiway methods from domains other than the social and behavioural sciences (which are treated in a separate section). Lieven De Lathauwer mentioned, for example, that tensors, the mathematical elements that form the basis for many multi-way models, are the golden tools for “signal processing, array processing, data mining, machine learning, system modelling, scientific computing, statistics, wireless communication, audio and image processing, biomedical applications, bio-informatics and so forth” (De Lathauwer 2014), not even mentioning fields such as the social and behavioural sciences, environmental studies, and agriculture. Kroonenberg’s 2008 book contains examples from several of these last ones.
4.1. Chemistry
Besides physical models, chemistry also employs ‘linked’ measuring techniques that work to-gether to produce three-way data such as gas chromatography coupled with mass spectrom-etry. As a result, the chemometricians need techniques to analyse such data, and three-way and multiway methods have come to the rescue. This also resulted in three-way models for online process control in industry. A view of the breadth of applications in chemistry can be found in the review papers byBro (2006), Açar and Yener (2009), Kolda and Bader(2009), the edited book by Muñoz de la Peña, Goicoechea, Escandar, and Olivieri (2015), and the books bySmilde, Bro, and Geladi(2004) and Olivieri and Escandar (2014).
4.2. Agriculture and food industry
or sat-nav? It is in this field that there is a great upsurge of applications. Much about these developments can be found in the Handbook of Blind Source Separation (Comon and Jutten 2010, Chapter 13), the review paper byCichocki, Mandic, De Lathauwer, Zhou, Zhao, Caiafa, and Phan(2015), and the book by Cichocki, Zdunek, Phan, and Amari (2009).
4.4. Systems biology
A very special area of application is systems biology - a discipline that aims to study organ-isms as a whole, with specialorgan-isms such as metabolomics (the systematic study of the unique chemical characteristics of specific cell processes) and proteomics (the large-scale study of proteins, particularly their structure and function). Examples of the use of multiway meth-ods in these areas can be found in, for instance, Yener, Açar, Aguis, Bennett, Vandenberg, and Plopper(2008);Rubingh, Bijlsma, Jellema, Overkamp, Van der Werf, and Smilde(2009); andAçar, Lawaetz, Rasmussen, and Bro (2013).
5. Applications in the social and behavioural sciences
As shown above, three-way analysis is not commonly used within the social and behavioural sciences, although there are many kinds of projects that would benefit from its power and the insights derived from three-way techniques. If we want to explore the use of three-way analysis in social and behavioural scientific research in more depth, a crucial question is: “Is descriptive analysis, and three-way analysis in particular, actually useful in the social and behavioural sciences?”. Despite the relatively modest growth in three-way applications, I maintain that this is definitely the case, but to my mind this applies to all descriptive analytical techniques.
5.1. Three-way data types in social and behavioural research
To answer the question of the usefulness of three-way methods in the social and behavioural sciences in detail, we must first establish if the data collected within this discipline actually call for three-way techniques. In order to eliminate any doubt on this point, I here provide a non-exhaustive overview of major types of three-way data encountered in the social and behavioural sciences; for applications see, e.g.,Kroonenberg (2008).
• Three-way profile data
Example: It is recorded whether children seek proximity to strangers, observe them with distrust, etc. when child, parent, and stranger are in the same room; when the child is alone with the stranger; and when the stranger enters after the child has been left alone in the room.
• Repeated measures data
A number of participants are measured several times on the same variables.
Example: Each year in a sample of primary school children their reading ability is assessed on several different measures.
• Three-way rating data
A number of subjects judge various emotions in different situations leading to a kind of stimulus-response data.
Example 1: Children with asthma indicate on several scales how they would react in different situations, for example playing alone in the street, walking alone in the woods, playing with their friends in the school grounds, going on a cycling trip. For each of these situations the children are asked to imagine how afraid they would be to have an asthmatic attack, how lonely they would feel, or how exhilarated they would be. Example 2: Individuals are presented with a number of concepts pertaining to their day-to-day life which have to be judged with a set of scales describing the characteristics of these concepts. A well-known representative of this kind of data is Osgood’s semantic differential technique. Therapists presented a woman with a multiple personality with concepts regarding her daily life (state of mind, mental illness, her doctor, her spouse, her job, etc.) and asked her to rate the concepts on scales such as good versus bad, calm versus vehement, strong versus weak (see Osgood and Luria 1954).
• Sets of correlation or covariance matrices
Example: The correlations or covariances between subtests of an intelligence test are computed for samples of children at different ages, or from different countries. The question is whether the intelligence test has the same structure over time and/or in different languages.
• Sets of similarity matrices
Example: Children are asked to indicate to what extent they prefer peanut butter sandwiches over jam sandwiches, cheese, kippers, truffles, etc. An additional three-way profile data set with the characteristics of these food stuffs can be useful for explicitly linking the judged preferences between the food stuffs to their perceived characteristics.
• Results of fMRI studies
Example: The results of brain scans measured in various locations in the brain, under different conditions, in different people.
• Three-way interactions
Example: In a study 54 persons were asked to indicate with yes or no whether they displayed any of 15 hostile behaviors in 23 frustrating situations. This resulted in a binary 23 x 15 x 54 data array. Such an array is clearly too large to analyse for many classical techniques, but three-way binary component analysis, called three-way hierarchical classes analysis, is specifically designed to handle this type of large binary contingency tables (Ceulemans, Van Mechelen, and Leenen 2003; Ceulemans and Van Mechelen 2005).
The last two data types deserve further mention because they point to areas where three-way analysis within various disciplines has been underused. Categorical and binary data are fairly common in the social and behavioural sciences, as both criterion variables and predictor variables. For designs with one or more continuous variables and many levels in the categorical predictors, analysis of variance is used in many cases, and more than two factors with many levels quickly lead to large interaction tables. Similarly, large three-way contingency tables have large three-way interaction tables. Indicating that these interactions are significant hardly answers the research questions about the major underlying patterns.
Bro and Jakobsen (2002) developed the GEMANOVA procedure for handling higher-dimensional interactions with multiway methods; one example is Romano, Næs, and Brock-hoff(2015). Three-way interactions for contingency tables have been tackled with three-way correspondence analysis by Carlier and Kroonenberg (1996, 1998). In their book Beh and Lombardo(2015, Chapter 11) provide a contemporary overview of several variants of multiway correspondence analysis.
From the above it should be clear that research in the social and behavioural sciences produces many different kinds of data which can seriously benefit from three-way and multiway analysis. At the same time it is clear that large-scale descriptive analyses are not everybody’s cup of tea, and that there will always be interpretational issues, because understanding the patterns in three different component spaces and the way they are linked is not something that comes easily. On the other hand, the techniques allow for answers to complicated questions about interactions, although the answers will not necessarily be straightforward.
6. Three-way and multiway software
TWPack structure
2. Job Specifications
(for selected analysis
program) Analysis parameters
Missing data Data specification Output parameters Joint plots 5. PostProc Residuals
Rotate core & comps Parameters
7. Output inspection
Storage parameters: Memory of the program History job files
Menu: Internal book keeping
Menu: Utilities, External programs
Find Missing HiClas programs
Other programs Job Edit
Processing output
Control Centre (edit, view, plot, browse)4. Output inspection
1. Select analysis program 3.eXe
eXe
6.
Convert data
Utilities External programs
Rotate comps.
(view, plot, browse)
Convert data
Data Selector
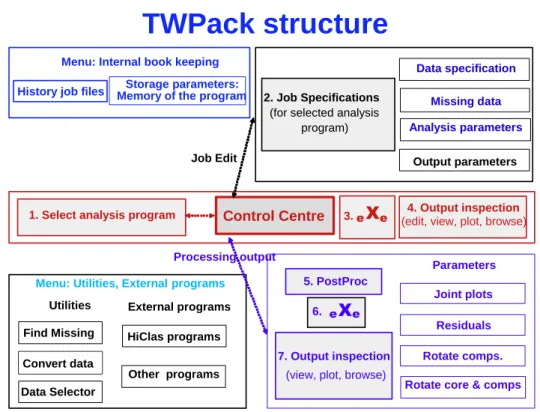
Figure 5: TWPack content structure.
program suite. I do not claim that all aspects mentioned here will always be relevant in program development but I expect that the kinds of issues, problems and solutions I came across in this context will occur in similar situations. Some of the problems and my solutions may at times seem a bit outdated, but that follows from my early start in the business.
6.1. Experiences in developing three-way software
It all started in 1975 when I wrote a Fortran program for a variant of the Tucker3 model, in which components are computed for only two of the three ways. This was followed by a program for the Tucker3 model itself (see Figure 2). Unsurprisingly, these two programs were later merged into one, and obviously the PARAFAC or CP model had to be included as well. Later I programmed additional models such as the simultaneous component model (Timmerman and Kiers 2003), three-mode correspondance analysis (Carlier and Kroonenberg 1996) and a few others. To be able to handle all these programs some sort of integrated environment was necessary; furthermore, such an environment is not complete without all kinds of utilities for preprocessing, postprocessing, graphing the results, evaluating residuals, etc.
and/or the core array, analysing and displaying residuals, as well as creating further graphics. A browser internal to the interface displays the output in a form which is reminiscent of the standard SPSS, as it also has a sidebar for navigation. The navigability is a great plus given the large amount of output.
For all of this to work an interface needs to have a memory. In the SPSSstatistical package the memory consists of the system file (*.sav), which contains the data and their definitions such as variable names, value names, format, etc. as well as information about missing data, which variables should be analysed as a set, etc. SPSSsaves the information about previous analyses in a syntax file (*.sps), thus making rerunning analyses possible. By default the
SPSSsyntax is also listed in the output and can be copied into the syntax file. The format of theSPSSsystem file is a proprietary one, but can be read by several other statistical packages such SASand EQS.
For each data set and its analysis the TWPack interface has one single memory or job file containing a basic description of the data, the locations of the relevant parameter files, and the details of the previous analysis, all of which should reside in the data directory. A data file has its own companions in a label file and a missing data file (if missing data are present). Job files are editable by a basic ascii editor. In order to keep track of what has been done to or with the data, it is necessary to have a separate directory for each data set. The great disadvantage of this system is that after a series of analyses one has a large number of files floating around in the data directory (see Figure5). However, all files related to a particular job have the same job name as part of their file name.
Unlike the TWPack interface, SPSS (and probably many other statistical programs) does not do reverse engineering, i.e., given a syntax or command file the program cannot set the menu system to correspond with the syntax file. For really complicated syntax files reverse engineering would be a great boon for users, because they do not necessarily have sufficient knowledge of the intricacies of the command language to easily make the same modifications they can make via the menu system.
6.2. Three-way and multiway software in the world at large
Naturally, there are several other collections of programs which are geared to performing three-way and multiway analysis, of which the MATLAB N-way Toolbox is probably the widest range of programs.
MATLAB toolboxes
• Andersson and Bro (2000): N-way Toolbox
http://www.models.life.ku.dk/nwaytoolbox); see also the Eigenvector Research’s PLS Toolbox
http://www.eigenvector.com/software/pls_toolbox.htm.
• Bader and Kolda (2006): Tensor Toolbox
http://www.sandia.gov/~tgkolda/TensorToolbox/.
• Comon, Luciani, and de Almeida (2009): Tensor Package
http://www.gipsa-lab.grenoble-inp.fr/ pierre.comon/TensorPackage/ tensorPackage.html
• De Lathauwer et al.: TensorLabToolbox (Vervliet, Debals, Sorber, Van Barel, and De Lathauwer 2016)
http://www.tensorlab.net/.
R packages
• Leibovici (2010): PTAk
https://CRAN.R-project.org/package=PTAk.
• Giordani, Kiers, and Del Ferraro (2014): ThreeWay
https://CRAN.R-project.org/package=ThreeWay.
• Of course Jan de Leeuw (together with Patrick Mair) has an Rpackage with three-way methods: smacof, but this is primarily concerned with multidimensional scaling (De Leeuw and Mair 2009)
https://CRAN.R-project.org/package=smacof.
Undoubtedly several other researchers have developed relevant software in this area. A full comparison of all these tool boxes and packages would be a worthwhile undertaking for a later paper.
7. Assignments for three-way researchers
Figure 6: Power to three-way analysis.
we will have to take into account that academics are interested in their own fields, not in our methods. Thus, if we want to show them that we have something to offer, the burden is on us to demonstrate this. In particular, we have to show that three-way methods have an added value compared to the standard statistical toolkit and can deliver results that cannot be obtained any other way. In other words, we have to argue that three-way analysis is like Heineken (see Figure6).
7.1. Statistical packages: Calculator and adviser in one
In concrete terms I would like to encourage methodologists (including myself) to concentrate, more than they have done so far, on: (1) showing the added value of the techniques in ap-plied articles in non-methodological journals; (2) presenting relevant analyses in collaboration with researchers working in the field, at the latter’s own, discipline-oriented, conferences; (3) training young academics specialising in these subjects in the use of three-way techniques, by organising courses that offer plenty of opportunity to practise with their own data; (4) producing guides for performing analyses, not just in print but also through intelligent and self-explanatory computer programs with easily accessible input and output.
Generally, statistical programs for three-way analysis are not half as simple to use as for instance SPSS with its extensive graphical interface. Quite apart from this, I would like programs, including my own, to follow Leland Wilkinson’s example in his SkyTree Adviser
Figure 7: Jan de Leeuw, 2011, Rennes, France.
results are explained. In this way, the program functions as an ‘analyser’ and personal adviser in one. Various multivariate statistics textbooks give examples of how the results of a certain analysis can be interpreted, but they always deal with the authors’, not the researcher’s data. It would be ideal if programs for statistical analysis explain the meaning of the results provided in their output. Until now, user-friendliness of computer programs has been almost exclusively discussed in terms of input rather than output and interpretation. Creating three-way analysis programs with user-friendly output seems like a perfect, rewarding project for a retired professor.
8. Conclusion: Returning to the beginnings
Andersson CA, Bro R (2000). “The N-Way Toolbox for MATLAB.” Chemometrics and Intelligent Laboratory Systems,52, 1–4. doi:10.1016/s0169-7439(00)00071-x.
Bader BW, Kolda TG (2006). “Algorithm 862: MATLABTensor Classes for Fast Algorithm Prototyping.” ACM Transactions on Mathematical Software,32, 635–653. doi:10.1145/ 1186785.1186794.
Basford KE, Kroonenberg PM, Cooper M (1996). “Three-Mode Analytical Methods for Crop Improvement Programs.” In M Cooper, GL Hammer (eds.), Plant Adaptation and Crop Improvement, pp. 291–305. CAB International, Wallingford.
Beh EJ, Lombardo R (2015). Correspondence Analysis. Theory, Practice and New Strategies. John Wiley & Sons, Chicester.
Bro R (1998).Multi-Way Analysis in the Food Industry. Models, Algorithms, and Applications. Ph.D. thesis, University of Amsterdam. URLhttp://www.models.kvl.dk/users/rasmus/ brothesis.pdf.
Bro R (2006). “Review on Multiway Analysis in Chemistry – 2000–2005.” Critical Reviews in Analytical Chemistry,36, 279–293. doi:10.1080/10408340600969965.
Bro R, Jakobsen M (2002). “Exploring Complex Interactions in Designed Data Using GE-MANOVA. Color Changes in Fresh Beef during Storage.” Journal of Chemometrics, 16, 294–304. doi:10.1002/cem.722.
Bro R, Kiers HAL (1997). “TRICAP: Three-Way Methods in Chemistry and Psychology, Lake Chelan, WA, USA, 4–9 May 1997.” Journal of Chemometrics, 11, 463–466. doi: 10.1002/(sici)1099-128x(199709/10)11:5<463::aid-cem494>3.3.co;2-8.
Carlier A, Kroonenberg PM (1996). “Decompositions and Biplots in Three-Way Correspon-dence Analysis.” Psychometrika,61, 355–373. doi:10.1007/bf02294344.
Carlier A, Kroonenberg PM (1998). “The Case of the French Cantons: An Application of Three-Way Correspondence Analysis.” In J Blasius, M Greenacre (eds.), Visualization of Categorical Data, pp. 253–275. Academic Press, New York.
Ceulemans E, Van Mechelen I (2005). “Hierarchical Classes Models for Way Three-Mode Binary Data: Interrelations and Three-Model Selection.” Psychometrika, 70, 461–480. doi:10.1007/s11336-003-1067-3.
Ceulemans E, Van Mechelen I, Leenen I (2003). “Tucker3 Hierarchical Classes Analysis.” Psychometrika,68, 413–433. doi:10.1007/bf02294735.
Cichocki A, Mandic D, De Lathauwer L, Zhou G, Zhao Q, Caiafa C, Phan HA (2015). “Tensor Decompositions for Signal Processing Applications: From Two-Way to Multiway Component Analysis.” IEEE Signal Processing Magazine,32, 145–163. doi:10.1109/msp. 2013.2297439.
Cichocki A, Zdunek R, Phan AH, Amari SI (2009).Nonnegative Matrix and Tensor Factoriza-tions. Applications to Exploratory Multi-Way Data Analysis and Blind Source Separation. John Wiley & Sons, Chicester.
Comon P, Jutten C (eds.) (2010). Handbook of Blind Source Separation. Academic Press, Oxford.
Comon P, Luciani X, de Almeida ALF (2009). “Tensor Decompositions, Alternating Least Squares and Other Tales.”Journal of Chemometrics,23, 393–405.doi:10.1002/cem.1236.
Coppi R, Bolasco S (eds.) (1989). Multiway Data Analysis. North Holland, Amsterdam.
De Lathauwer L (2014). “Tensor Decompositions: Golden Tools for Data Mining.” Lecture presented at the 25th Anniversary VOC. Rolduc, The Netherlands. 7 November 2014.
De Leeuw J (1975). “The TUCKALS2 Algorithm – Version 2.” Unpublished, URL http: //www.stat.ucla.edu/~deleeuw/janspubs/1975/notes/deleeuw_U_75c.pdf.
De Leeuw J (2016a). “Bibliography of Jan De Leeuw.” Accessed 2016-06-01, URL http: //gifi.stat.ucla.edu/.
De Leeuw J (2016b). “Curriculum Vitae of Jan De Leeuw.” Accessed 2016-06-01, URL http://gifi.stat.ucla.edu/cv-year.pdf.
De Leeuw J (2016c). “Pronounce My Last Name.” Accessed 2016-06-01, URLhttp://gifi. stat.ucla.edu/leeuw.mov.
De Leeuw J, Mair P (2009). “Multidimensional Scaling Using Majorization: SMACOF inR.” Journal of Statistical Software,31(3), 1–30. doi:10.18637/jss.v031.i03.
Dorans NJ (2004). “A Conversation with Ledyard R Tucker.”Technical report, ETS. Available from https://www.ets.org/Media/Research/pdf/tucker.pdf.
Geladi P (1994). “TRIC, The First Conference on Three-Way Methods in Chemistry, Epe, Netherlands, 22–25 August, 1993.”Journal of Chemometrics,8, 97–98. doi:10.1002/cem. 1180080110.
Notation and Algebra to N-Way Arrays.” Journal of Chemometrics, 15, 689–714. doi: 10.1002/cem.665.
Harshman RA, Lundy ME (1984a). “Data Preprocessing and the Extended PARAFAC Model.” InLawet al. (1984), pp. 216–284.
Harshman RA, Lundy ME (1984b). “The PARAFAC Model for Three-Way Factor Analysis and Multidimensional Scaling.” InLawet al. (1984), pp. 122–215.
Harshman RA, Lundy ME (1994). “PARAFAC: Parallel Factor Analysis.” Computational Statistics & Data Analysis,18, 39–72. doi:10.1016/0167-9473(94)90132-5.
Hitchcock FL (1927a). “Multiple Invariants and Generalized Rank of a p-Way Matrix or Tensor.” Journal of Mathematics and Physics,7, 39–79. doi:10.1002/sapm19287139.
Hitchcock FL (1927b). “The Expression of a Tensor or a Polyadic as a Sum of Products.” Journal of Mathematics and Physics,6, 164–189. doi:10.1002/sapm192761164.
Kiers HAL, Harshman RA (1997). “Relating Two Proposed Methods for Speedup of Al-gorithms for Fitting Two- And Three-Way Principal Component and Related Multi-linear Models.” Chemometrics and Intelligent Laboratory Systems, 36, 31–40. doi: 10.1016/s0169-7439(96)00074-3.
Kiers HAL, Ten Berge JMF, Bro R (1999). “PARAFAC2 – Part I. A Direct Fitting Algorithm For the PARAFAC2 Model.” Journal of Chemometrics,13, 275–294.doi:10.1002/(sici) 1099-128x(199905/08)13:3/4<275::aid-cem543>3.0.co;2-b.
Kolda TG, Bader BW (2009). “Tensor Decompositions and Applications.” SIAM Review,51, 455–500. doi:10.1137/07070111x.
Kroonenberg PM (1983). Three-Mode Principal Component Analysis: Theory and Ap-plications. DSWO Press, Leiden. Book available from http://www.leidenuniv. nl/fsw/three-mode/bibliogr/kroonenbergpm_thesis/kroonenberg1983.pdf; Errata, 1989; available from the author.
Kroonenberg PM (1984). “Three-Mode Principal Component Analysis: Illustrated with an Example from Attachment Theory.” InLawet al. (1984), pp. 64–103.
Kroonenberg PM (2005). “Three-Mode Component and Scaling Models.” In BS Everitt, D Howell (eds.), Encyclopedia of Statistics in Behavioral Sciences, pp. 2032–2044. John Wiley & Sons, Chichester.
Kroonenberg PM (2008). Applied Multiway Data Analysis. John Wiley & Sons, Hoboken.
Kroonenberg PM (2014a). “History of Multiway Component Analysis and Three-Way Cor-respondence Analysis.” In J Blasius, MJ Greenacre (eds.),Visualization and Verbalization of Data, pp. 77–94. Chapman & Hall/CRC, New York.
Kroonenberg PM (2014b). “De Driewegwereld Kent Geen Grenzen [The Three-Way World Knows No Boundaries].” Afscheidscollege. [Farewell lecture], Department of Education, Leiden University, Leiden. Available in English and Dutch from http://three-mode. leidenuniv.nl/.
Kroonenberg PM (2016). “The Three-Mode Company.” Accessed 2016-06-01, URL http: //three-mode.leidenuniv.nl/.
Kroonenberg PM, De Leeuw J (1977). “TUCKALS2: A Principal Component Analysis of Three-Mode Data.” Research Bulletin RB 001-’77, Department of Data Theory, Leiden University, Leiden.
Kroonenberg PM, De Leeuw J (1978). “TUCKALS2: Een Hoofdassenanalyse Voor Drieweggegevens. [TUCKALS2: A Principal Component Analysis for Three-Mode Data].” Methoden en Data Nieuwsbrief,3, 30–53.
Kroonenberg PM, De Leeuw J (1980). “Principal Component Analysis of Three-Mode Data by Means of Alternating Least Squares Algorithms.” Psychometrika, 45, 69–97. doi: 10.1007/bf02293599.
Kroonenberg PM, De Roo Y (2010). “3WayPack: A Program Suite for Three-Way Analysis.” Program manual, The Three-Mode Company, Leiden University, Leiden. Available from http://three-mode.leidenuniv.nl/.
Kroonenberg PM, Van der Voort THA (1987). “Multiplicatieve Decompositie Van Interacties Bij Oordelen over De Werkelijkheidswaarde Van Televisiefilms [Multiplicative Decompo-sition of Interactions from Judgements about the Preceived Reality of Television Films].” Kwantitatieve Methoden,8(23), 117–144.
Kroonenberg PM, Van Ginkel JR (2012). “Combination Rules for Multiple Imputation in Three-Way Analysis Illustrated with Chromatography Data.” Current Analytical Chem-istry,8, 224–235. doi:10.2174/157341112800392544.
Law HG, Snyder Jr CW, Hattie JA, McDonald RP (eds.) (1984). Research Methods for Multimode Data Analysis. Praeger, New York.
Leibovici DG (2010). “Spatio-Temporal Multiway Decompositions Using Principal Tensor Analysis onk-Modes: TheRPackagePTAk.”Journal of Statistical Software,34(10), 1–34. doi:10.18637/jss.v034.i10.
Smilde AK, Bro R, Geladi P (2004). Multi-Way Analysis: Applications in the Chemical Sciences. John Wiley & Sons, Chichester.
Timmerman ME, Kiers HAL (2003). “Four Simultaneous Component Models for the Analysis of Multivariate Time Series from More than One Subject to Model Intraindividual and Interindividual Differences.” Psychometrika,68, 105–121. doi:10.1007/bf02296656.
Torgerson WS (1958). Theory and Methods of Scaling. John Wiley & Sons, New York.
Tucker LR (1963). “Implications of Factor Analysis of Three-Way Matrices for Measurement of Change.” In CW Harris (ed.), Problems in Measuring Change, pp. 122–137. University of Wisconsin Press, Madison.
Tucker LR (1966). “Some Mathematical Notes on Three-Mode Factor Analysis.” Psychome-trika,31, 279–311. doi:10.1007/bf02289464.
Tucker LR (1972). “Relations between Multidimensional Scaling and Three-Mode Factor Analysis.” Psychometrika,37, 3–27. doi:10.1007/bf02291410.
Van den Berg F, Ceulemans E (2003). “TRICAP 2003: Three-Way Methods in Chemistry and Psychology, University of Kentucky, Lexington, KY, USA, 22–27 June 2003.” Journal of Chemometrics,17, 618–619. doi:10.1002/cem.823.
Van den Boom DC, Hoeksma JB (1994). “The Effect of Infant Irritability on Mother-Infant Interaction: A Growth Curve Analysis.” Developmental Psychology, 30, 581–590. doi:10.1037/0012-1649.30.4.581. For the data see http://www.leidenuniv.nl/fsw/ three-mode/data/irritablebabiesinfo.htm.
Van Eeuwijk E, Kroonenberg PM (1998). “Multiplicative Models for Interaction in Three-Way ANOVA, with Applications to Plant Breeding.” Biometrics,54(4), 1315–1333. doi: 10.2307/2533660.
Vervliet N, Debals O, Sorber L, Van Barel M, De Lathauwer L (2016). “TensorLab 3.0.” Program manual, ESAT, Katholieke Universiteit Leuven, Leuven, Belgium. Available from http://www.tensorlab.net/.
Williams T, Kelley C (2016). “gnuplot5.0.2: An Interactive Plotting Program.” URL http: //gnuplot.info/.
Yener B, Açar E, Aguis P, Bennett K, Vandenberg SL, Plopper GE (2008). “Multiway Modeling and Analysis in Stem Cell Systems Biology.” BMC Systems Biology,2(63). doi: 10.1186/1752-0509-2-63.
Affiliation:
Pieter M. Kroonenberg
Faculty of Social and Behavioural Sciences Leiden University
2333 AK Leiden, The Netherlands E-mail: [email protected] and
The Three-Mode Company
URL: http://three-mode.leidenuniv.nl/