Capacity Evaluation of Power Transmission Line Towers under
Wind Loading: A Case Study
Asad Ullah Qazi, Muhammad Sameer Azhar, Safeer Abbasand Asif Hameed
Department of Civil Engineering, University of Engineering and Technology Lahore, Pakistan
* Corresponding Author: E-mail: [email protected]
Abstract
Pakistan is currently facing massive energy crisis and requiring huge investment into the power transmission line infrastructure. The longest transmission lines of the country are of 220 kV lines stretching up to 7359 km. The contemporary factored design wind load effects for overhead lattice transmission line tower are evaluated based on the applicable wind load factor, gust response factor and design wind speed as recommended by WAPDA/IEC Specifications (1988), ASCE-74 (1991) and ASCE-7 (2005). The current factors and design wind speed were developed considering linear elastic responses. However, information on the non-linear inelastic responses of such towers under dynamic wind loading and on the structural capacity of towers in relation to the design capacities is lacking. The knowledge and assessment of the capacity curve and its relation to the design strength is important to evaluate the integrity and reliability of these towers. Therefore, in this study, analysis was performed on 220 KV river crossing tower of 78.25 high (the highest transmission line tower in Pakistan), using a nonlinear static pushover analysis (NSPA) and incremental dynamic analysis (IDA). Firstly, NSPA was performed on 2D and 3D structural models for aforementioned codes and also for three additional load patterns according to first mode shape, power law and microburst/downburst phenomena. Afterwards, the IDA was performed for which time histories were generated by using NATHAZ Online wind simulator followed by a series of nonlinear direct integration dynamic analysis. Finally, for each loading pattern of NSPA and each time history of IDA, base shear load versus top displacement curves were plotted which are known as capacity curves. Numerical results showed that the structural capacity curves of the tower determined from the NSPA depend on the loading pattern and are similar to those obtained from IDA. The results indicated that the towers in Pakistan are reasonably reliable yet over designed due to standardized design approach across the country.
Key Words
: Transmission line, wind load, capacity curve, non linear static push over analysis,incremental dynamic analysis, NATHAZ wind simulator.
1. Introduction
Energy is an important resource of any country. In the modern industrial era, there is an ever increasing demand of electricity to attain economic growth and prosperity. To achieve this, addition of new power generation plants and power infrastructure is required. Transmission line networks are a key part of electric power infrastructure. The transmission line consists of strings of conductors suspended on support structures (towers/poles). The reliability of transmission line system requires that under any circumstances, the conductors do not get
detached or broken. As the transmission lines stretch across thousands of kilometers on open terrain and have directly exposed elements, in structural engineering perspective, it is imperative to have strong yet economical towers to bear the brunt of strong winds, snow and earthquakes etc.
The existing transmission system in Pakistan can merely support the current power production and bears enormous electricity losses. To address this issue, new grid stations and transmission lines are being planned. All these programs and projects will incorporate a long network of transmission towers
spanning over hundreds of miles across the country [1]. There are two types of structures normally used for power transmission lines: latticed steel tower and tubular poles [2]. It is evident that the latticed steel towers are mostly used. Lattice steel tower is a 3D space truss. All over the world, research is going on in the field of inelastic analysis of transmission line towers to assess the reliability of towers.
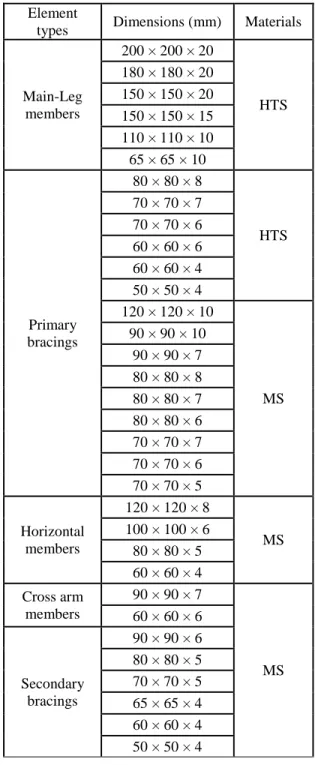
A lattice tower consists of cross arms over the basic body which supports the conductors [2]. Figure 1 elaborates typical parts of lattice transmission line tower. Leg extensions are provided to level the tower in an uneven area. Ground wire is provided to safeguard against lightening. Conventionally, the direction perpendicular to the run of the conductors is called as transverse direction and parallel to the run of conductors is termed as longitudinal direction. Lattice towers have tapered shape legs ensuring varying slight angle along its height. The four main legs form the outer boundary of the tower excluding the cross arms and are usually made of the heavier angle sections. Primary bracing elements act as basic lateral load resisting frame work whereas, secondary
bracing elements not intended for supporting loads rather they are provided to satisfy the slenderness ratio and control the buckling of main elements.
2. Research Significance and
Objectives
It is contemporary practice to design the transmission line towers on basis of elastic analysis results in accordance with design standards such as ASCE, IEC codes etc., which extensively provide the basic wind speed maps. Basic wind speed maps of developed countries (i.e. United State of America) and even our neighboring country India are available but unfortunately no such map has been developed for Pakistan. In order to assess the capacity of a tower, full scale tests are required to be carried out for the most critical tower arrangement of transmission line. However, full scale testing is rarely done in Pakistan due to financial and experimental setup constraints. Therefore, a methodology for non-linear static and dynamic analysis and evaluation of capacity curves for transmission line towers subjected to wind loads in Pakistan was developed in this study. Furthermore, capacity curves of power transmission line towers by applying the non-linear
static and dynamic analysis method were evaluated. This study will provide an assessment on the integrity and reliability of existing tower design under wind loading using numerical approach.
3. Description of Selected Tower
A river-crossing tower is selected for this study (Fig. 2). It is the highest transmission line tower in Pakistan with height of 78.25 m and base width of 17.25 m. It is a typical double circuit tower with six cross arms and main legs tapered throughout the height as shown in Fig. 2. The tower consists of steel elements. Two types of steels were used, namely mild steel and high tensile steel. The chemical composition of steel materials is summarized in Table 1. Details can be found elsewhere [3]
Table 1: Chemical composition of steel material
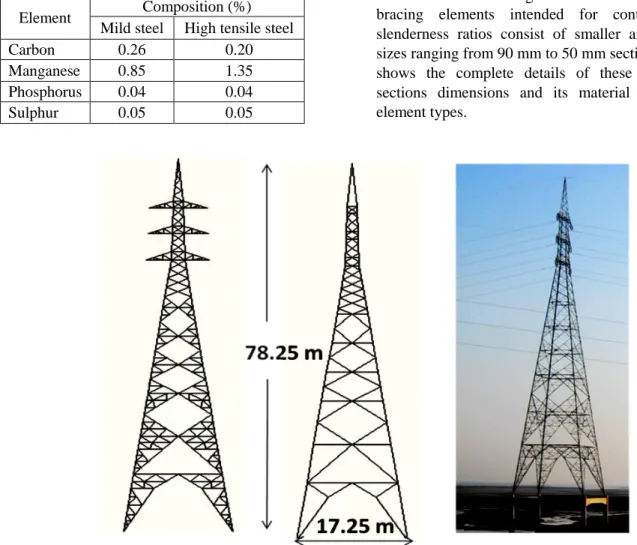
Element Composition (%) Mild steel High tensile steel
Carbon 0.26 0.20
Manganese 0.85 1.35
Phosphorus 0.04 0.04
Sulphur 0.05 0.05
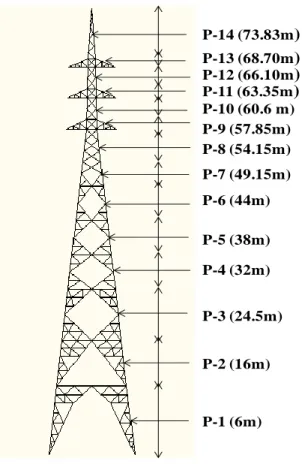
All the members of lattice transmission line tower are made of angle sections. The main legs are of high tensile steel with angle section size ranging from 200 × 200 mm to 65 × 65 mm sections. The primary bracings of the tower are the main lateral load resisting elements having a mix of mild and high tensile steel elements. A high tensile steel angle sections are provided till the basic body height and their size range from 80 × 80 mm to 60 × 60 mm sections. The remaining tower height till the top earth wire level consists of mild steel sections comprising of 60 × 60 mm and 50 × 50 mm sections. The rest of the members such as horizontal, cross arms and secondary bracing members are of mild steel. Horizontal members range from a maximum size of 120 × 120 mm to a minimum of 60 × 60 mm angle sections. Whereas, the cross arms supporting the insulators and conductors are made of 90 × 90 mm and 60 × 60 mm angle sections. The secondary bracing elements intended for controlling the slenderness ratios consist of smaller angle section sizes ranging from 90 mm to 50 mm sections. Table 2 shows the complete details of these used angle sections dimensions and its material for various element types.
Table 2: Section properties of tower members Element
types Dimensions (mm) Materials
Main-Leg members
200 × 200 × 20
HTS 180 × 180 × 20
150 × 150 × 20 150 × 150 × 15 110 × 110 × 10 65 × 65 × 10
Primary bracings
80 × 80 × 8
HTS 70 × 70 × 7
70 × 70 × 6 60 × 60 × 6 60 × 60 × 4 50 × 50 × 4 120 × 120 × 10
MS 90 × 90 × 10
90 × 90 × 7 80 × 80 × 8 80 × 80 × 7 80 × 80 × 6 70 × 70 × 7 70 × 70 × 6 70 × 70 × 5
Horizontal members
120 × 120 × 8
MS 100 × 100 × 6
80 × 80 × 5 60 × 60 × 4 Cross arm
members
90 × 90 × 7
MS 60 × 60 × 6
Secondary bracings
90 × 90 × 6 80 × 80 × 5 70 × 70 × 5 65 × 65 × 4 60 × 60 × 4 50 × 50 × 4
HTS = high tensile steel; MS = mild steel
4. Tower Modelling
The structure of transmission tower is difficult to model due to a large number of inclined members having changing inclination with height and tapering cross arms. To overcome the difficulties following steps were taken:
1) Due to advance drawing tools of AutoCad-2010, it was selected for drawing the 2D structure of selected tower in both mutually perpendicular directions i.e. transverse face (perpendicular to the run of the conductors) and longitudinal face (parallel to the run of the conductors).
2) Coordinates were found out from 2D models. 3) The main body of the tower excluding cross
arms was modeled in commercially available software SAP 2000 [4] by employing the 3D truss template and transmission tower 1 option by utilizing the coordinates found through 2D model.
4) This 3D main body model was exported as autocad.dxf file and AutoCad was utilized to add the cross arms to main body.
5) This drawing was imported in SAP 2000 where in, member sections (Table 2) were defined. 6) Main members were assigned frame sections. 7) Rest of the members mainly bracing elements
were drawn and assigned respected section properties (Table 2) and replicated by using circular replication option.
5. Superimposed Loads
Generally, tower like other structures are subjected to loads in the direction of all axes (x, y and z axis). Apart from dead load of the structure, the codes recommend superimposed load on key locations like top of the tower where earth wire is joined to the tower and edges of the cross arms where conductors are joined to the tower. The ultimate superimposed loads were applied in accordance with WAPDA/NTDC specification [5] as shown in Table 3.
In Table 3, the vertical loads are the ultimate superimposed dead loads of the earth-wire including its fittings and accessories. The transverse loads are the ultimate loads caused by lateral wind force applied on the earth-wire/conductor including its fittings and accessories. The longitudinal loads are ultimate loads applicable in the direction of run of broken earth-wire/conductor to account for the pull caused by unbalance of forces.
Table 3: Ultimate loads on conductors and earth-wire locations
Loads Description Load (kg)
Vertical
Weight of earth wire
and its fittings 630 Weight of conductor
insulator strings and fittings for conductor
2775
Transverse
Wind on earth wire and
its fittings 1842
Wind on earth wire and fittings with earth wire broken
921 Wind on conductor,
insulators and fittings with conductor intact
6034 Wind on conductor,
insulators and fittings with conductor broken
3115
Longitudinal
Due to earth wire
broken 2075
Due to conductor
broken 4655
6. Application of Wind Loads
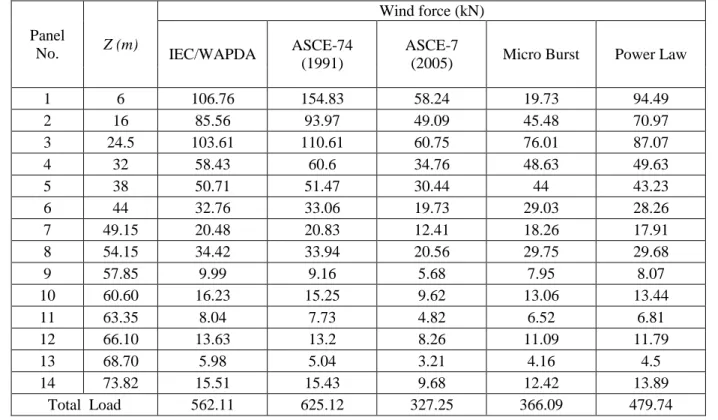
For the application of wind load, generally, the structure is divided into a number of panels and the wind load is determined at the centroid of that panel, which is eventually distributed to the panel points. Ideally, load should be distributed to every node of the truss but it is highly cumbersome. Every utility firm/company has its own procedures for calculation of wind load. The panels should include the waist of the tower, cross arms and top tapered portion.
The load distribution to panel points should be based on a logical approach in which importance is given not only to moment equivalence but also to shear equivalence at the base. It can be achieved by introduction of an equivalent part load which produces an equal moment at the base of that part and is transferred to the upper loading point and the remaining part to the base. This process is repeated for other parts of the tower from the top downwards (Fig. 3). Table 4 and 5 shows the comparison of wind loads applied on the selected tower in accordance with WAPDA, ASCE 74 (1991), ASCE 7 (2005), power law and micro-burst [5-7] for both transverse and longitudinal directions.
P-1 (6m) P-2 (16m) P-9 (57.85m) P-10 (60.6 m) P-11 (63.35m) P-12 (66.10m) P-13 (68.70m) P-14 (73.83m)
P-3 (24.5m) P-4 (32m) P-5 (38m) P-6 (44m) P-7 (49.15m) P-8 (54.15m)
Fig. 3 Wind load panels
7. Analysis Methodologies
A non-linear static pushover analysis (NSPA) [8] and incremental dynamic analysis (IDA) [9] were performed on the selected tower in order to evaluate its non-linear inelastic behavior. The time history was generated by using online wind simulator developed by Natural Hazard NATHAZ modeling laboratory at the University of Notre Dame, USA, also known as NATHAZ Online Wind Simulator (NOWS) [11].
8. Results and Discussion
8.1 Non-Linear Pushover Analysis
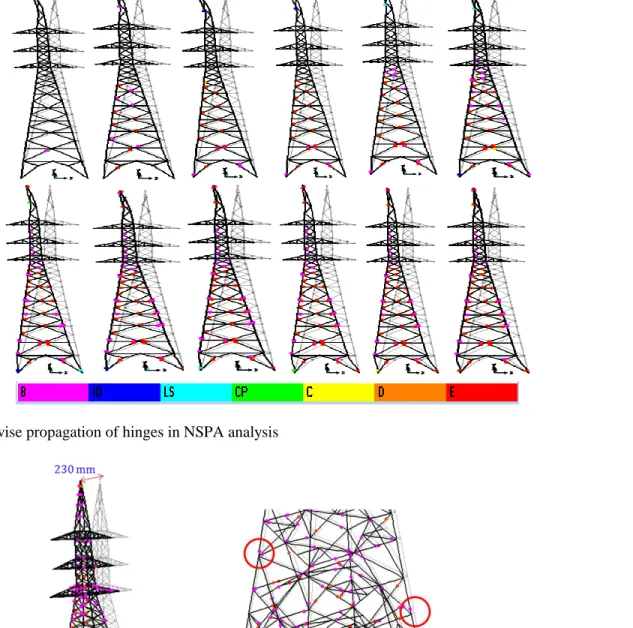
NSPA was performed for both 2D and 3D models. In the analysis, the software captured the deformation of structure under monotonic loads and this deformation increased till it reached the target displacement. The step by step deformation of a 2D structure model is shown in Fig. 4. In the initial steps fewer hinges were developed which are usually in the range of “B” performance level on the load-deformation curve. In the later steps the more hinges were formed and they progressed on the load-deformation curve till they reached the collapse
Table 4: Summary of static lateral wind loads in longitudinal direction Panel
No. Z (m)
Wind force (kN) IEC/WAPDA ASCE-74
(1991)
ASCE-7
(2005) Power law Micro burst
1 6 106.76 154.83 58.24 94.49 19.73
2 16 85.56 93.97 49.09 70.97 45.48
3 24.5 103.61 110.61 60.75 87.07 76.01
4 32 58.43 60.6 34.76 49.63 48.63
5 38 50.71 51.47 30.44 43.23 44
6 44 33.52 33.95 20.25 29.01 29.8
7 49.15 26.1 26.65 15.88 22.92 23.37
8 54.15 30.21 30.59 18.53 26.75 26.81
9 57.85 23.46 23.34 14.48 20.55 20.26
10 60.60 17.48 17.13 10.8 15.1 14.67
11 63.35 21.46 21.32 13.3 18.79 17.97
12 66.10 14.26 14.13 8.85 12.63 11.88
13 68.70 18.7 18.29 11.64 16.31 15.09
14 73.82 15.51 15.43 9.68 13.89 12.42
Total Load 605.77 672.32 356.68 521.34 406.12
Table 5: Summary of static lateral wind loads in transverse direction
Panel
No. Z (m)
Wind force (kN) IEC/WAPDA ASCE-74
(1991)
ASCE-7
(2005) Micro Burst Power Law
1 6 106.76 154.83 58.24 19.73 94.49
2 16 85.56 93.97 49.09 45.48 70.97
3 24.5 103.61 110.61 60.75 76.01 87.07
4 32 58.43 60.6 34.76 48.63 49.63
5 38 50.71 51.47 30.44 44 43.23
6 44 32.76 33.06 19.73 29.03 28.26
7 49.15 20.48 20.83 12.41 18.26 17.91
8 54.15 34.42 33.94 20.56 29.75 29.68
9 57.85 9.99 9.16 5.68 7.95 8.07
10 60.60 16.23 15.25 9.62 13.06 13.44
11 63.35 8.04 7.73 4.82 6.52 6.81
12 66.10 13.63 13.2 8.26 11.09 11.79
13 68.70 5.98 5.04 3.21 4.16 4.5
14 73.82 15.51 15.43 9.68 12.42 13.89
Fig.4: Stepwise propagation of hinges in NSPA analysis
prevention “C” performance limit. At first, the hinges were developed in bracing elements whereas with the increase in lateral displacement, the hinges started to form in the main legs. Finally, at the target displacement level, appreciable hinges were formed along the main legs of basic body of the tower. Hinges especially at the base have exhausted their capacity.
At the yield capacity level, hinges were formed on the main legs of the tower but deformation of the whole structure was not substantial in comparison to the target displacement. At the target displacement level, most of the hinges have exhausted their load carrying capacity and deformed appreciably. This behavior was observed for both the 2D and 3D model analyses (Fig. 5). It was observed that 3D analysis models attained higher base shear and lower top displacement values than 2D models. A comparison of bilinear capacity curve of 2D and 3D models is shown in Fig. 6. At yield capacity level, for 2D model the deformation was 280 mm at base shear of 1480 kN whereas, for 3D model, the lateral deformation was 230 mm at a higher base shear of 2000 kN .
0 500 1000 1500 2000 2500 3000
0 200 400 600 800 1000
B
as
e
sh
ear
(
k
N)
Displacement (mm)
ASCE-74 (1991) 2D ASCE-74 (1991) 3D
Fig. 6 Comparison of NSPA capacity curves of 2D & 3D models in transverse direction
Also, at target lateral deformation level (1000 mm), the 3D model attained much higher base shear load of 2750 kN as compared to 1730 kN base shear load of 2D model. These results affirm the superiority of 3D over 2D model analysis which is attributed to the greater indeterminacy and robustness shown by the 3D model structure. Although, 2D model analysis have the advantage of quicker modeling and faster analysis but 3D model analysis reveal the potential of
a structure close to actuality and the utilization of residual capacity beyond yield capacity.
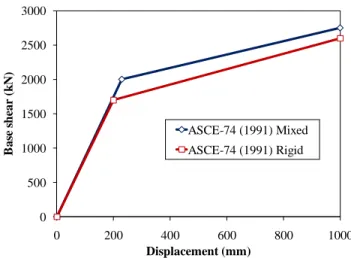
8.1.1 Comparison of Rigid and Mixed Joint Approach
The results of tower modeled with rigid joint approach and mixed joint approach were comparable. A comparison of NSPA capacity curves for rigid and mixed joint approach is presented in Fig. 7. It is clear that the magnitude of base shear load for mixed approach is higher than the rigid approach (Fig. 7).
0 500 1000 1500 2000 2500 3000
0 200 400 600 800 1000
B
as
e
sh
ear
(
k
N)
Displacement (mm)
ASCE-74 (1991) Mixed ASCE-74 (1991) Rigid
Fig. 7 Rigid vs mixed joint approach in transverse direction
The results of NSPA for the two approaches do not posses any compelling differences to adjudicate in favor of one approach over the other but researchers have favored rigid joint approach in nonlinear analysis as it simplifies analysis and design processes [12]. In this study, the detailed cases for NSPA and IDA discussed subsequently were assessed by modeling the tower with rigid joint approach.
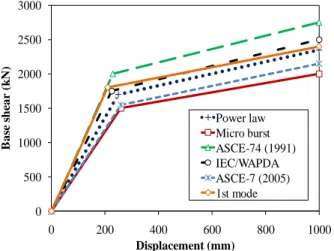
8.1.2 Comparison of NSPA Capacity Curves
NSPA for the six load cases were compared in both transverse and longitudinal direction. This comparison is shown in Figs. 8 and 9. The capacity curves for both directions revealed different behavior of structure for the six loading patterns.
For both directions of the wind loads, the ASCE-74 (1991) load pattern had highest load and IEC/WAPDA had the second highest loads. In the
0 500 1000 1500 2000 2500 3000
0 200 400 600 800 1000
B as e s h e ar ( k N) Displacement (mm) Power law Micro burst ASCE-74 (1991) IEC/WAPDA ASCE-7 (2005) 1st mode
Fig. 8 NSPA capacity curves in transverse direction 0 500 1000 1500 2000 2500 3000 3500
0 200 400 600 800 1000
B as e s h e ar ( k N) Displacement (mm) Power law Micro burst ASCE-74 (1991) IEC/WAPDA ASCE-7 (2005) 1st mode
Fig. 9 NSPA capacity curves in longitudinal direction 0 500 1000 1500 2000 2500 3000 3500
0 200 400 600 800 1000
B as e s h e ar ( k N) Displacement (mm) ASCE-74 (1991) Conductor breakage
Fig. 10 Comparison of conductor broken case and ASCE-74 (1991) NSPA capacity curves in longitudinal direction
longitudinal direction, a comparison has been made between the highest load pattern ASCE-74(1991) and conductor broken condition as shown in the Fig. 10, both yield at same load level with just 30 mm more displacement for conductor broken case. Also, at target displacement level, the base shear was just 100 kN more for conductor broken condition. The behavior of the two cases was quite similar.
Results for NSPA analysis (Table 5) showed that the yield load varied from 1500 kN to 2000 kN in transverse direction and 2100 kN to 2600 kN in longitudinal direction. Also, the top displacement at yield ranged from 210 mm to 260 mm in transverse direction and 160 mm to 250 mm in longitudinal direction. For both directions of the wind loads, the
Table 5: Summary of NSPA capacity curves
Load Cases Longitudinal direction Transverse direction
Yield capacity (kN) Base shear at target displacement level (kN) Top displacement at yield (mm) Yield Capacity (kN) Base shear at target displacement level (kN) Top displacement at yield (mm)
Conductor breakage
2600
3300
200
-
-
-
Power law
2100
2700250
1700
2350
250
Micro burst
2100
2750
200
1500
2000
260
ASCE-74 (1991)
2600
3200
170
2000
2750
230
IEC/WAPDA
2500
3100
220
1750
2500
225
ASCE-7 05
2100
2650
220
1550
2150
260
ASCE-74 (1991) loading pattern had highest load followed by the IEC/WAPDA loading pattern. 8.2 Incremental Dynamic Analysis
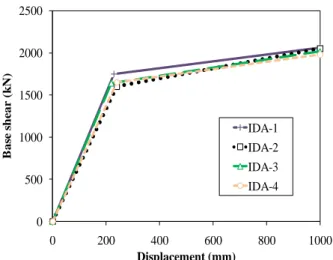
The results for incremental dynamic analysis (IDA) are summarized in the form of capacity curves (Figs. 11 and 12) for four sets of time history. The capacity curve data is summarized in Table 6. The yield capacity was observed between 1700 kN to 1800 kN for transverse direction. Minimum recorded yield capacity was 1600 kN and maximum 1750 kN in longitudinal direction. The top displacement at yield capacity for both the directions ranged from 220 mm to 240 mm. It is recommended in FEMA-356 [10] to average the results when time history cases are more than three. In compliance to the same, the average IDA results were compared for both directions (Table 6). The difference in yield capacity for transverse and longitudinal direction was just 115 kN and corresponding top displacement was merely 2.5 mm.
0 500 1000 1500 2000 2500 3000
0 200 400 600 800 1000
B
as
e
sh
ear
(
k
N)
Displacement (mm) IDA-1 IDA-2 IDA-3 IDA-4
Fig. 11 IDA capacity curves in transverse direction
0 500 1000 1500 2000 2500
0 200 400 600 800 1000
B
as
e
s
h
e
ar
(
k
N)
Displacement (mm)
IDA-1 IDA-2 IDA-3 IDA-4
Fig. 12 IDA capacity curves in longitudinal direction
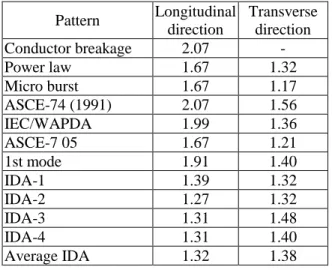
8.3 Comparison of NSPA and IDA Methods The availability of the reserve or residual strength beyond the design capacity can be assessed by determining the ratio of yield capacity determined from the NSPA and IDA results to the elastic design capacity of the structure termed as Y/D ratio. The Y/D ratio greater than 1.0 is an indication of the extent of availability of the reserved strength capacity above design capacity of the structure. The Y/D ratio for NSPA and IDA results is presented in Table 7.
The varying trend is again visible for the NSPA results. In longitudinal direction, the yield capacity was at maximum 2.07 and minimum 1.67 times the design capacity of 1255 kN. Similarly, in transverse direction, it varied from 1.56 to 1.17 times the design capacity of 1286kN.
Table 6: Comparison of IDA capacity curve parameters
Load Cases
Longitudinal direction Transverse direction Yield
capacity (kN)
Base shear at target displacement
level (kN)
Top displacement
at yield (mm)
Yield Capacity
(kN)
Base shear at target displacement
level (kN)
Top displacement
at yield (mm)
IDA-1
1750
2060
230
1700
2030
220
IDA-2
1600
2050
240
1700
2050
240
IDA-3
1640
2020
220
1900
2550
240
IDA-4
1650
1980
240
1800
2250
240
Table 7: Summary of yield capacity/design capacity ratio for NSPA and IDA results Pattern Longitudinal
direction
Transverse direction
Conductor breakage 2.07 -
Power law 1.67 1.32
Micro burst 1.67 1.17
ASCE-74 (1991) 2.07 1.56
IEC/WAPDA 1.99 1.36
ASCE-7 05 1.67 1.21
1st mode 1.91 1.40
IDA-1 1.39 1.32
IDA-2 1.27 1.32
IDA-3 1.31 1.48
IDA-4 1.31 1.40
Average IDA 1.32 1.38
The average IDA results were very similar in both directions. The yield capacity remained 1.32 and 1.38 times the design capacity in longitudinal and transverse directions, respectively. Top displacement at yield for all cases remained within the allowable deflection limit of 560 mm (Fig. 13).
0 100 200 300 400 P ow er law M icr o b u rs t AS CE -74 (1991) IE C/W AP DA AS CE -7 (2005) Is t m od e A ve rage I DA T op d is p lac em en t ( m m )
Fig. 12 Top displacement at yield capacity level in transverse direction
9. Conclusions
It is apparent that the wind loads formulas provided by various codes were based on the concept of conversion of kinetic energy of air to potential energy produced on the obstructing body. The ASCE-74 (1991) produces highest total applied load. Its load pattern is very similar to IEC/WAPDA approach. The velocity profile of special metrological phenomena like microburst is more realistic than the inexact power law. The force profile is not as smooth
as the accepted wind profile due to the fact that the jaggedness along the profile takes place depending upon the varying solidity ratio of the panels. The magnitude of load varies along the height of the structure but the shape of force profile is essentially the same which is attributed to the intrinsic principles of wind load codes.
In the past, the application of NSPA to wind load analysis for transmission line towers were heavily based on 2-D models. Although analysis with 2-D model is less time consuming as compared to analysis of 3-D model. Factually, analysis of 3-D model gives better representation of indeterminacy of the structure.
The selection of joint type may impact the design of individual member but in non-linear analysis, the global behavior of the structure is least affected by it. In this study, the mixed approach yielded slightly higher base shear and deflection as compared to rigid joint approach. The difference between the two was not significant whereas, mixed approach analysis is difficult to converge.
The displacement control approach of NSPA makes the magnitude of applied loads irrelevant. The pattern of applied loads is more relevant factor. This is the reason that the load pattern according to 1st mode of vibration can be applied for NSPA although, it is not suited for wind load analysis. The 1st mode of vibration shape has very different from wind profile. The NSPA gave varying yield capacities (1500-2000 kN, 2100-2600 kN) and corresponding top displacement (210-260 mm, 160-250 mm), in transverse and longitudinal directions, respectively. This is mainly due to the inherent drawbacks of the technique and its dependence upon the load pattern. In comparison, the IDA results were more precise. Also, they yielded same range of top displacement (220-240 mm) in both directions. Despite the use of NATHAZ Online Wind Simulator (NOWS), IDA is still a computationally hectic analysis approach. In contrast, NSPA is computationally efficient method, yet it can lead to false margin of safety. Therefore, IDA can be found better suited than NSPA approach.
The transmission line towers in Pakistan are being designed based on elastic design approach. A
standardized design should be specified for all the regions of the country, despite the fact that the country has a variety of topographic features and wind corridors. The Y/D ratios of all the load cases were above 1.0, which means that the towers were reliable yet over-designed.
10. References
[1] National transmission and Despatch Company Limited (NTDCL) Final Report “National power system expansion plan 2011-2030,” 2011.
[2] Hannuksela, J., "The transmission line cost calculator," Technology and Communication, 2011.
[3] Azhar, M. S., “Capacity evaluation of transmission line towers in Pakistan under wind loading,” M.Sc Thesis, U.E.T., Lahore, 2014. [4] Computers and Structures, Inc. 2009. SAP2000
Structural Analysis Program, Nonlinear Version 14.0.0, Berkeley, California.
[5] WAPDA /NTDC Design Standards Specification, 1988.
[6] ASCE 74, Guidelines for electrical transmission line structural loading, ASCE manuals and reports on engineering practice No. 74, 1991. [7] ASCE 7, Seismic design provisions, 2005. [8] Krawinkler, H. and Seneviratna, K., “Pros and
cons of a pushover analysis of seismic performance evaluation.” Engineering Structures, Vol. 20, No. 4-6, 1998,
[9] Vamvatsikos, D. and Cornell, A., “Incremental dynamic analysis.” Earthquake Engng Struct. Dyn., Vol. 31, 2002,
[10] NatHaz On-line Wind Simulator (NOWS) http://windsim.ce.nd.edu/int_winsim.html [11] FEMA (2000), Prestandard and commentary for
the seismic rehabilitation of buildings, Publication no. 356, prepared by the American Society of Civil Engineers for the Federal Emergency Management Agency, Washington, D.C.
[12] Concepción, D., Pascual, M., Mariano, V. and Osvaldo, M. Q. “Review on medelling of joint behaviour in steel frames.” Journal of constructional steel research, Vol. 67, 2011,