The Emergence of Core-Periphery
Structures in the European Union:
a Complexity Perspective
Claudius Gräbner, Jakob Hafele
The Emergence of Core-Periphery
Structures in the European Union:
a Complexity Perspective
Claudius Gräbner
1,2,3, Jakob Hafele
1,21: ZOE. Institut für zukunftsfähige Ökonomien.
2: Johannes Kepler University Linz, Institute for the Comprehensive Analysis of the Economy. 3. Institute for Socioeconomics, University of Duisburg-Essen.
Abstract:This paper investigates the emergence of polarisation patterns in the EU during the last 60 years from a structuralist and complexity economics perspective. Based on the results, feasible opportunities for EU policy-making, which aim to counteract a tendency of polarization, are delineated.
The study comprises of a historical analysis of the politico-economic events during this time and a complementary quantitative analysis of the European trade network. The results suggest that trade in the Eurozone is unequal at the expense of the peripheries and follows a pattern of “unequal technological exchange”.
The paper also assesses the usefulness of country taxonomies such as ‘cores’ and
‘peripheries’ for identifying the roots of polarization patterns. While it generally affirms
the relevance of structural dependencies, and confirms the epistemic usefulness of country taxonomies, it also highlights three challenges – the challenges of dynamics, of ambiguity and granularity – that any such taxonomy necessarily faces, and which must be dealt with explicitly in any structuralist analysis using such taxonomies.
Licence:Creative-Commons CC-BY-NC-ND 4.0.
Herausgeber/Publisher: ZOE. Institut für zukunftsfähige Ökonomien e. V., Thomas-Mann-Straße 36, 53111 Bonn.
[email protected]·www.zoe-institut.de·ISSN 2627-9436.
ZOE Diskussionspapiere präsentieren wirtschafts- und sozialwissenschaftliche Analysen von Potentialen und Hemmnissen für eine zukunftsfähige Wirtschaftsordnung. ZOE discussion papers present economic and socio-scientific analyses of potentials and barriers for a future-fit economic system.
1 Introduction
This paper studies polarisation patterns in the EU during the last 60 years from a structuralist perspective. It pursues two goals, one substantial, the other methodological: first, it seeks to contribute to a better understanding of the historical roots of polarization patterns in the EU and to
delineate pragmatic and feasible policy measures that
can be used to counteract current polarization patterns. Second, existing structuralist studies regularly use country taxonomies, such as ‘cores’ and ‘peripheries’ in their analysis, and then try to identify structural interdepen-dencies between the groups. Grouping countries always comes with a loss of information and a certain degree of ambiguity. Therefore, the second goal of this paper is to ask critically to what extent the analytic gain of using such country taxonomies outweights their poten-tial costs of shallowing the particularities of single countries.
Political and economic polarization patterns in the EU have been documented by several recent studies (e.g. Celi et al., 2018; Gräbner et al., 2019, 2020b; Simonazzi et al., 2013). The reasons for these patterns remain, however, sub-ject to debate. While some prominent explanations consider
the financial crises in 2008ffas a major source for these
polarization patterns, others stress that polarization has its roots in the decade before the financial crisis (e.g. Gräbner et al., 2020b). The present contribution goes back in time even further: inspired by structuralist theorists such as Musto (1981) – who warned already in 1981 that “growing inequali-ties, caused by regional concentration of economic activiinequali-ties, will lead to permanent structural crisis in the Union, pre-determine the development outlook of the new [Southern]
member states and hinder further integration” (p. 245,
trans-lation by the authors) – it searches for deeper structural reasons of ongoing polarization dynamics in the whole time period since the 1960s. Considering such longer time hori-zon also allows for a critical evaluation of the dynamics of core-periphery structures with regard to the actors involved: as will be shown below, although the core-periphery struc-ture as such can be observed over almost the entire time frame since the 1960s, the allocation of countries to the core and the periphery as such is not entirely stable. An adequate consideration of such longer-term phenomena is important in the context of the second main focus of the paper, i.e. the critical evaluation of a structuralist approach to study polarization in the EU.
Before we proceed, two methodological clarifications are in order: first, the present paper rests upon the triangulation of two non-standard approaches to socio-economic devel-opment: structuralism and economic complexity. The two approaches are complementary since complexity economics provides for a number of methods that can be used to study patterns – which have been described by structuralists many years ago – quantitatively and in more depth. At the same time, structuralism can provide for a theoretical
framework that most current complexity economic studies are lacking. By contextualizing the quantitative part of the investigation, the two approaches are triangulated in a way that is consistent with a critical realist perspective (Lawson, 1997). Second, since approaches are also characterized by a focus on the productive sphere of the economy and for the pragmatic reason of data availability, most of the discussion that follows focuses on economic development and polarization in the manufacturing sector. This can be justified by the structuralist contention that the industrial sector of a nation is crucial for its overall development since it not only provides for accessible employment opportunities for both skilled and unskilled labor, but is also essential for
the diffusion of productive knowledge within the economy.
To achieve the two main goals of the paper – to delineate guidelines for policies based on a historical analysis of polar-ization patters in in the EU and to scrutinize the usefulness of structuralist country taxonomies for such an analysis – it proceeds as follows: section 2 explicates the theoretical origins of our work by reviewing structuralist contributions to the EU and it’s predecessors. These contributions are characterized by the analytic use of core-periphery country taxonomies. Section 3 provides for the context of the later empirical analysis by conducting a politico-economic anal-ysis of the major development events in the EU since the 1950s. These elaborations suggest that there is evidence for the existence and stability of core-periphery structures in the EU. Section 4 then highlights a so far underappreciated
dimension of these structures: that of anunequal
technolog-ical exchange. These contributions are then synthesized in section 5. This includes a discussion of the policy implica-tions that are suggested by the results and an assessment of their pragmatic feasibility in light of EUs current room to manoeuvre. Finally, section 6 concludes.
2 The theoretical framework: core-periphery theory and structural polarization - a literature review 2.1 The theoretical vantage point: core-periphery
thinking, structuralism and economic complexity
The reference to the core-periphery distinction can be traced back to early philosophers like Plato (Sepos, 2016). Today, is plays a role in a number of approaches in economics and political economy, including the ‘New Trade Theory’, ‘New Economic Geography’, the ‘Varieties of Capitalism’ (VoC) approach and structuralism.
New Trade Theory (NTT) has been pioneered by Paul Krugman who developed several general equilibrium mod-els of international trade built upon theories of monopolistic competition and production under increasing returns to scale. In Krugman (1981) he presents a model that explains the emergence of ‘core’ and ‘periphery’ countries by the
an initially more favorable capital-labor ratio will become rich and industrialized, while the other country will become capital-poor and agricultural. In Krugman (1991), which is often considered the vantage point for what later will be called ‘New Economic Geography’ (Fujita et al., 1999), he develops these ideas further and studies the emergence of cores and peripheries within a single country. In all, both NTT and NEG are built upon general equilibrium models in
which cores and peripheries are mereoutcomesof the
mod-els, which are not themselves used for explanatory purposes.
This is different in the VoC approach, which goes back to
Hall and Soskice (2001): It stands for a comparative insti-tutional analysis of market economies based on New Insti-tutionalist theory and with the aim to identify certain ‘ideal types’ such as ‘liberal’ or ‘coordinated’ market economies. A number of studies on the EU in this tradition are present in the literature (see Hall, 2018, for an overview). The main units of analysis of this work have been the single countries and their institutions, which are then compared to the ideal types suggested by the theory. As in the case of NTT and NEG, the relations between the countries as such receive relatively little attention.
Structuralists, by contrast, emphasize exactly those rela-tions as key explanatory factors for the emergence and sta-bility of core-periphery patterns across countries. Unequal distribution of political power and asymmetric trade patterns favouring core countries are considered central characteris-tics of these relations. Together with the relations between cores and peripheries, structuralist research regularly refers to the distribution of technological capabilities and – through the concept of circular cumulative causation (Myrdal, 1958) – income inequality as further key explanatory devices (for an overview see Bárcena and Prado, 2016). Given ample evidence for the political and economic importance of the relations between countries in the EU (e.g. Celi et al., 2018), the present paper finds itself much closer to structuralism than NTT, NEG or the VoC approach.
The main focus will be on one particular aspect of this relationship, which has been highlighted regularly by structuralist scholars: international trade and the dynamics of the manufacturing sector. Of particular relevance here is the idea of an ‘unequal exchange’ between the core and the periphery. This concept goes back to Prebisch (1950) and Singer (1950), who have identified an unequal exchange between primary goods produced in the peripheries and industrial goods produced in the cores. They found that this leads to a constant deterioration of the terms of trade for the peripheries with adverse consequences for industries in peripheries. Emmanuel (1972) picks this up and comes up with his own theory of unequal exchange in which he
puts differences in wages at the heart of his explanation
for the uneven development between cores and peripheries hindering the development in peripheries.
The present paper complements structuralist theory with methods and concepts from the literature on economic
com-plexity (see Hidalgo, 2015; Hidalgo et al., 2007), a combina-tion that has so far been undertaken only in Gala et al. (2018) At the core of the complexity literature is the idea that a key explanation for a society’s wealth is the ability of its citizens to collectively engage in sophisticated economic activities, such as the production of complex products. Analyzing inter-national trade data with tools from network science, Hidalgo and Hausmann (2009) allows the delineation of indicators that measure the complexity of products (i.e. the amount of technological capabilities needed to produce the product) and of countries (i.e. the amount of collective capabilities accumulated in this society). The resulting formal appara-tus allows for the empirical identification of core-periphery patterns in global production structures, as anticipated by earlier structuralist scholars. As we will discuss in sections 4 and 5 below, it also allows for the extension of structuralist concepts since with the complexity of products a new dimen-sion of unequal exchange between cores and peripheries can be investigated.
2.2 Structuralist analyses of core-periphery relations in the EU
The present study is by no means the first structuralist analy-sis of polarization patters in the EU. As one of the first of its kind, Musto (1981) stressed the relevance of the unequal distribution of technological capabilities, and predicted struc-tural crisis because of the increasing polarization between technologically advanced and less-advanced regions in the EU. More recently, Simonazzi and Ginzburg (2015) anal-ysed the trends that led to the uneven development between Southern European peripheries and core countries. In short they argue that the deindustrialization of the European pe-ripheries in the 1970s followed increased international com-petition and market saturation for peripheral exports in core countries. According to the authors this was amplified by the fact that the state was prevented from investing in industrial upgrading in times of liberal integration to the EU. More-over, the financial liberalization policies since the late 1980s
have had particularly negative effects on the development of
Southern periphery countries, because their national control mechanisms were particularly weak and speculation had been amplified over-proportionally if compared to the core countries (see also Celi et al., 2018; Kapeller et al., 2019; Stockhammer, 2015). These dynamics implied unsustain-able debt driven growth in the peripheries that covered up the underlying structural problems and subsequently culminated into the financial crisis 2008. Here, Simonazzi and Ginzburg (2015) make an argument that is common for structuralists:
countries in the European periphery are affected differently
by more general dynamics, and these different reactions tend
to reproduce existing core-periphery relationships (see also Celi et al., 2018).
Gräbner et al. (2019) argue that the path dependent de-velopment of production structures in cores and peripheries, which they link to the deeper accumulation dynamics of
their technological capabilities, is a key driver for diverg-ing development in the EU (for a discussion of how the 2020 Corona-crisis aggravates these trends see Gräbner et al., 2020a). They show empirically that the increase of economic openness in the EU tends to aggravate the struc-tural polarization in the EU and argue that convergence can only be achieved via a change of institutions and active in-dustrial policy. A slightly broader perspective is taken by Kapeller et al. (2019), who add the increasing focus on com-petition in the EU as a further explanation for polarization patterns and present a set of policy measures that can ad-dress these shortcomings. These arguments relate well to the work of Storm and Naastepad (2015) as well as Dosi et al. (2015), and stresses – in a very structuralist spirit – the relevance of technology gaps, i.e. the uneven distribution of technological capabilities between core and periphery re-gions in Europe: Many periphery countries simply lack the technological capabilities to compete successfully in the rel-evant international markets, and experience too high levels of domestic inequality to stabilize their aggregate demand internally.
Another factor that is regularly stressed in structuralist the-ory is that of politico-economic power (see already Sunkel, 1972) For the context of the EU, for instance, Becker et al. (2015) argue that the implementation of the Deutsche Mark as anchor currency prior to the introduction of the Euro gave the German central bank the power to dominate the monetary policy of the EU. The restrictive monetary policy that followed from this dominance then had asym-metrically negative impacts on countries in the periphery, thereby reinforcing existing core-periphery structures (for
the asymmetric effects of the Treaty of Maastricht see, e.g.,
Storm, 2019). The institutional shift that came along with the monetary integration can be understood as a shift in political power away from national democratic institutions and towards technical state apparatuses which made it
in-creasingly difficult to challenge those asymmetric structures
(Schneider and Sandbeck, 2019). The same can be said for the responses to the Euro crises, which was driven by the interest of core countries (Magone et al., 2016) and had
adverse effects on peripheries (Storm and Naastepad, 2015).
This focus on the long run relationship between core and periphery, the consideration of power relations, as well as development of productive structures and technological capabilities is again a typical feature of structuralist analysis
(Bárcena and Prado, 2016). Therefore, the emergence
of core-periphery structures in Europe has recently been linked to the idea of ‘growth models’ (see e.g. Baccaro
and Pontusson, 2016). The latter are used to explain
the membership in the core or the periphery with the
pursuit of different growth models (Gräbner et al., 2020b).
The literature on growth models is concerned with the composition of aggregate demand, and according to the most common distinction, the European core has followed an export-driven growth model and the periphery has followed mainly a debt-driven growth model, which was
rendered infeasible after the crisis (Gräbner et al., 2020b; Stockhammer, 2015). When elaborating on the reasons why some countries have seen the emergence of a debt-led rather than an export-led growth model to stabilize aggregate demand, Gräbner et al. (2020b) stress the relevance of non-price competitiveness, which mainly depends on the accumulation of technological capabilities and is essential for being successful on international markets (see also Dosi et al., 2015).
Three things are noticeable with regard to the various structuralist contributions of European development dynam-ics: first, while all these contributions make use of country taxonomies, no commonly accepted classification exists. Second, some authors use additional country groups beyond the simple core-periphery dichotomy. Third, most contribu-tions don’t provide a clear definition of cores and peripheries. This leads to a variety of country taxonomies that are cur-rently used in the literature (see table 1 for an overview).
2.3 Three challenges for structuralist country taxonomies
Differences in the country taxonomies used in the literature
relate to different selections of variables and indicators,
dif-ferent methods and different personal assessments used to
classify countries. Here we suggest the existence of three main challenges for country taxonomies as used in
structural-ism that are underlying these difficulties: first, thechallenge
of dynamics, which refers to the fact that countries might switch from one group to another over time. Ireland is an ex-ample that comes immediately to mind which switched from being a periphery, very depended on the UK, to a financial-ized country with considerable GDP growth throughout the 1990s (notwithstanding more recent problems of Irish GDP
accounting). Second, thechallenge of ambiguity, according
to which countries might belong to the core in one sense, and the periphery in another sense. France, for instance, is a politically important player, yet features some typical
economic characteristics of peripheries. Third, thechallenge
of granularitystresses that countries themselves might be divided into core and periphery. Within Spain, for example, the North plays the role of a core, the South the role of a periphery.
These three challenges illustrate that any fixed country typology must be used carefully. Nevertheless, the present paper also grants credit to the structualist argument that the relationship between core and peripheries is an important in-gredient to any explanations of the developmental dynamics in the EU. However, to take the three challenges seriously we fully acknowledge the potential ambiguity of any static topology and respond to this by an explicit discussion of the challenges whenever they appear relevant. These dis-cussions will not only prove to be insightful on their own, but also allow us to draw a more nuanced picture of the
Source Country groups used Main methods of classification
Gräbner et al. (2019) Core, periphery, financial hubs,
catch-up economies
Descriptive statistics, analysis of technological change, hierarchical clustering based on reaction to European integration
Esposito et al. (2019), López-Bazo et al. (1999), and Vickerman et al. (1999)
Core, periphery Location, north – south
Becker et al. (2015) and Simonazzi et al. (2013)
and others1
Core, periphery Other, e.g.: level of trade integration, GDP, level
of industrialization, power, size, productivity
Seers (1979) Core, semi-periphery, inner and
outer periphery
Technological capacity, capital goods industries, military power, national owned industries, main import and export goods, per-capita income, dualism between urban upper class and rural lower class, dependence on migration and tourism, lack of diversification and factor mobility, inability of governments to impose sacrifices on any class, foreign indebtedness Farole et al. (2011) and
Thomas (2013)
Sub-national/regional core and
periphery
GDP and export (Thomas, 2013), economic agglomeration (Farole et al., 2011)
Simonazzi and Ginzburg (2015)
First-comer industrialized (cores) , late-comer and late-late-comer industrialized (periphery)
level of industrialization, productivity (performance dependent on four factors: 1) innovation, 2) position in global value chains,
3) support by infrastructures and institutions and 4) industrial policy)
Bartlett and Prica (2016) Core, Inner Periphery, Outer
Periphery (European Periphery outside of the Eurozone), Super Periphery (outside of the EU and the Eurozone, but influenced by
developments in the EU)
Structural imbalance between core and periphery
Table 1: Taxonomies used in the current literature.
determinants of the developmental dynamics in the EU. Therefore, the paper proceeds as follows: the paper adopts as a baseline taxonomy the classification proposed in Gräbner et al. (2019) with the only exception being France, which is – because of its political power (Schneider,
2017) – considered a core country in the present paper2.
The resulting taxonomy is summarised in table 2. This taxonomy is not only based on both theoretical and empirical considerations, it also represents a workable compromise between aggregation of similar countries into
meaningful groups, and sufficient granularity to account for
specifics. Moreover, the typology is based on a perspective
1 For instance, Bayoumi and Eichengreen (1992), De Santis and
Cesaroni (2016), Leonardi (2006), Magone et al. (2016), and Rhodes (1995).
2 Note that Gräbner et al. (2019) mainly used economic rather than
political variables for their classification.
on the current situation in Europe. Therefore, the historical analysis in section 3 allows for a critical analysis of how countries arrived at their current place in this typology and, because of the long time horizon covered, allows for a critical reflection of the taxonomy, particularly against the three challenges mentioned above.
Before proceeding with the historical analysis, the classifi-cation of one country deserves further justificlassifi-cation: Consid-ering Italy as part of the periphery is certainly a controversial choice, which provides for an immediate illustration of the three challenges introduced above. First, as will be shown
below, Italy is subject to thechallenge of dynamicssince it
cannot be considered to be part of the European periphery
right from the 1950s. Second, Italy illustrates thechallenge
Category Distinguishing characteristics Members
Core
High GDP per capita levels
Importance of industrial production Production of complex products Relatively low unemployment
Austria, Belgium, Denmark, Finland, France, Germany
and Sweden
Periphery
Lower export shares Relatively high public debt
Tendency to current account deficits Relatively high unemployment
Cyprus, Greece, Italy, Portugal, and Spain
Catch-Up
Relatively low levels of wages and GDP per capita
High degree of foreign ownership Small service sector, but important manufacturing sector
Bulgaria, Romania, Czech Republic, Estonia, Latvia, Lithuania, Hungary, Poland,
Slovenia, Slovakia
Finance
High debt levels of private firms Important share of finance in terms of gross output
High foreign investment inflows Large incomes from wealth taxes
Luxembourg, Netherlands, Malta, and Ireland
Table 2: Our baseline taxonomy, mainly based upon Gräbner et al. (2019), who further justify the taxonomy via an analysis of the technological development paths in all the countries, as well as their reactions to European economic integration.
and the world: it is part of the G7 and has an influential voice within European policy debates. However, there are also reasons for the classification of Italy as periphery country: not only is it struggling with low productivity, but it also plagued with high levels of public debt and relatively high unemployment rates. Thus, in economic terms, Italy shares more with countries typically associated with the periphery. And also the political position within Europe might not be as strong as the size and the history of the country might suggest. As the current debate about the introduction of European bonds, particularly during the Covid19-pandemics (‘Corona-Bonds’) shows, Italy cannot enforce their interests
effectively against Germany and other Northern European
countries. Finally, Italy also illustrates thechallenge of
gran-ularity. Some parts of Italy, particularly in the North-West, host very productive, highly innovative and internationally competitive industries and are characterised by low unem-ployment and high incomes. At the same time, other areas, particularly the Southern ‘Mezzogiorno’ are lagging
eco-nomically, suffering from high unemployment and
techno-logically inferior businesses. Thus, there are cores within the periphery, just as there are some peripheries within the countries classified as cores (some parts of Eastern Germany immediately come to mind).
3 Developmental trends in Europe since 1950
The structuralist contributions reviewed in the preceding sec-tion suggest that unequally distributed technological
capabil-ities, as well as the asymmetric power relations between core and periphery countries, play an important role for current polarization dynamics. Since they also stress the relevance of path dependencies inherent in the politico-economic envi-ronment, the present exposition takes a long-term perspec-tive starting from 1950s.
3.1 Catching-up after the second World War
The 1950s and 1960s were, at first sight, a time when to-day’s periphery countries experienced good economic de-velopment: the industrial sectors in the Southern European peripheries were growing steadily, supported by the protec-tionist policies in place (Foreman-Peck and Federico, 1999).
In effect, the peripheries showed considerable growth rates.
For example, in the 1960s Greece experienced the 2nd high-est average growth rate worldwide, exceeded only by Japan (data: World Bank). However, because of their backlog in terms of technological capabilities, the European periph-eries remained dependent on capital and technology imports from the core – a situation that structuralists describe as ‘de-pendent industrialization’ (e.g. Nohlen and Schultze, 1985). According to Becker et al. (2015) this led to current account deficits financed by tourism and remittances from the core countries – a highly dependent development model making the peripheries vulnerable to crises.
The time after the second World War also provides for a
first example for thechallenge of dynamics. Italy, in most of
this point of time much closer to the core: it industrialized earlier than Greece, Spain and Portugal and, consequently, had a much stronger industrial base in the 1960s than the other countries. Thus, it also enjoyed a considerably higher standard of living (Simonazzi and Ginzburg, 2015). Until about 1962, the Italian economy also experienced further industrialisation and upgrading, fuelled by protective and active policies and quick urbanisation (Celi et al., 2018). France on the other hand, often treated as core country be-cause of its considerable political power and its high GDP (Seers, 1979) has shown a negative trade balance throughout the 1960s and 1970s (data: COMTRADE) and lagged be-hind in terms of size and complexity of its industries. Since its political position was already very strong at that time, it
also represents an example for thechallenge of ambiguityat
that time. This indicates that countries may switch positions within a given taxonomy and begs the question about the determinants of such changes – a question that will be taken up below.
3.2 Economic liberalization, increased competition and the end of convergence in the 1970s and 1980s
The Treaty of Rome set the stage for an ongoing process of economic liberalization which culminated in the integra-tion of Greece, Portugal and Spain into the European single market in 1981 and 1986, respectively. The rules of the Single Market were applied to all countries equally – to the economically and technologically strong core countries as well as the economically and technologically less developed peripheral countries (see table 2). The integration of Greece, Portugal and Spain into the Single Market led to increas-ing imports from the technologically strong core countries. These flows of manufactured goods from the core into the periphery followed the liberalization and put the previously well-protected industries in the periphery under increased competitive pressure. There are a number of arguments for why the industries in the peripheries were not ready for this increasing competition:
1. their lower productivity as compared with the firms in core countries (Hummen, 1977; Musto, 1986; Seers, 1979),
2. their smaller size and inability to exploit economies of scale (firms in the peripheries were much smaller, handicraft type of manufacturing, as compared to the large industrial plants in the cores Hummen, 1977; Zouboulidis, 2006),
3. their low innovativeness (Seers, 1979; Simonazzi and Ginzburg, 2015), and
4. less linkages with other industries and related services (Simonazzi and Ginzburg, 2015; Zouboulidis, 2006).
The shift of policies towards integrated markets was not an isolated European phenomenon. The replacement of Key-nesian polices with market-liberal policies in the 1970s led to an increasing globalization of manufacturing structures and the rapid growth of global production networks (Dicken, 2015). This change was accompanied by a centralization of worldwide industrial production into fewer and larger firms and thus also an accumulation of power in these produc-tion networks (Dicken, 2015; Kapeller and Gräbner, 2020). So-called lead firms, which often resemble an oligopoly within the production network, faced smaller suppliers who were exposed to increased competition. This asymmetrical structure allowed lead firms to decide what, when, how and where to produce and to exert price pressure on the suppli-ers creating a new kind of dependency of firms that were integrated into those networks as suppliers (Milberg and
Winkler, 2013, p. 111ff., 123ff.). This shift was
accompa-nied by increasing demand for complex and high-quality goods in European core-countries, based on the saturation of those markets with durable consumer goods (Simonazzi
and Ginzburg, 2015, p. 112ff). Companies responded with
vertical product differentiation, shortened product cycles and
services-based marketing strategies. Thus, more complex and higher-quality products were created, which were in-tegrated into a marketing-oriented service sector making it
more difficult to compete with.
For the European peripheries it became much more diffi
-cult to produce competitively with core-countries industries because the shift towards more complex products meant that tacit productive knowledge, sectoral linkages and broad production networks became relatively more important as main determinants for international competitiveness (e.g. Carlin et al., 2001; Dosi et al., 2015). These demands could only be met by very few of the most productive firms in the peripheries.
The oil crisis in the 1970s came on top of the increased competition stemming both from the EU market liberaliza-tion and the globalizaliberaliza-tion of producliberaliza-tion structures. Those
two effects led to the exit of smaller and younger
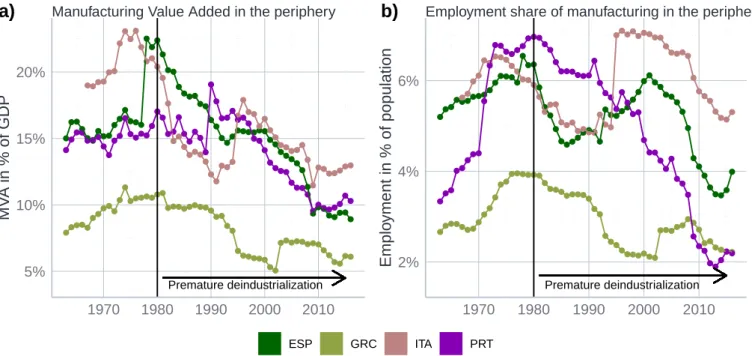
indus-tries in the peripheries. Figure 1 shows that the share of manufacturing value added (MVA) in GDP started to de-cline, even before the countries had gone trough a proper experience of industrialization, given rise to a ‘premature de-industrialization’ (Rodrik, 2016).
This premature de-industrialization marked a turning point in the catch-up process of the European peripheries. A phase of broad and rapid industrialization was interrupted and replaced by a phase in which only the most productive industries survived, mostly by being integrated into global production networks. This led to a new type of dependent de-velopment in which peripheral economies became depended on lead-firms in global production networks. Figure 2 de-picts the stable catch-up process until the oil-crises, which
then became volatile and finally stopped.3
3
Premature deindustrialization 5% 10% 15% 20% 1970 1980 1990 2000 2010 MV A in % of GDP
Manufacturing Value Added in the periphery
a)
Premature deindustrialization 2% 4% 6% 1970 1980 1990 2000 2010 Emplo yment in % of populationEmployment share of manufacturing in the periphery
b)
ESP GRC ITA PRT
Data: INDSTAT; authors' own calculations.
Figure 1: Premature deindustrialization.
−2.5 0.0 2.5 5.0 1970 1980 1990 2000 2010 MV A pc gro wth per ipher y/core
Long−term trend of MVA per capita growth in the peripheries and the core
a)
−2 0 2 4 6 1965 1970 1975 1980Stable & moderate catch−up until 80s b) −2 0 2 4 6 1981 1985 1990
Volatile catch−up dynamics in the 80s c) −2 0 2 4 6 1991 1995 2000 2005 2010 2015
Lack of convergence since the 90s d)
Data: INDSTAT; authors' own calculations.
Figure 2: MVA per capita growth in cores vs peripheries. Data points above the solid line (y=1) indicate a faster growth
The globalization of production structures helped those firms that were placed close to international hubs. Supported by the industrial agglomeration policies of the time this led to the development of ‘cores within the peripheries’ creating an uneven development pattern within the peripheries (Simonazzi and Ginzburg, 2015; Stoehr,
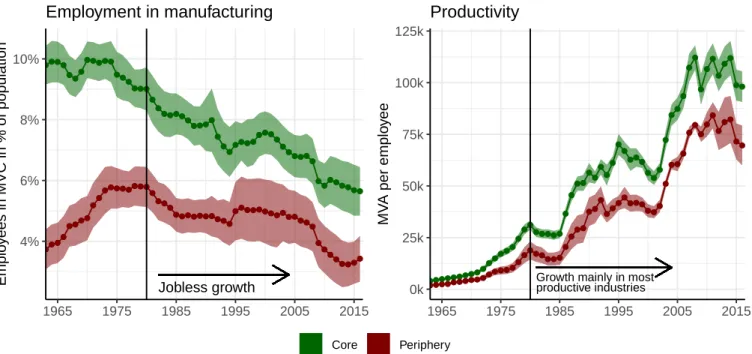
1985; Weissenbacher, 2015).4 Moreover, from the 1980s
on, industrial development in the peripheries was almost entirely led by productivity increases, i.e. the phase of MVA growth after the 1980s was mostly jobless (see figure 3). So, huge parts of the peripheral population didn’t benefit directly from the remaining industries anymore. In all, the decreasing importance of industries in the peripheries during this period marked the end of their industry driven growth-model.
This period, again, contains a number of examples for the challenges for country taxonomies introduced in
section 2.2: first, with regard to thechallenge of dynamics,
we have seen that Italy has started off as a relatively
well-industrialized country in the 60s and could well be classified as a core country. After the 80s this advantage, however, has vanished to a large extent, so it presents itself more as a member of the periphery. Among the events that were crucial for Italy’s decline into the periphery were the 1963 crisis caused by the excessive monetary expansion and resulting needs for contractions. In context of the oil
crisis5 and combined with increasing imports resulting
from free-trade agreements in the EC and the failure to improve the productive structures in the South fast enough this led to premature deindustrialization (Celi et al., 2018, p.
224-228). Second, thechallenge of granularitybecomes
particularly relevant due to the phenomenon of ‘centres within the peripheries’ (see above): in countries such as Italy or Spain, regions with surviving industrial clusters one would find many characteristics of core regions, yet this is in stark contrast to most of the other regions in
these countries. Finally, also thechallenge of ambiguity
presents itself in a very pronounced fashion during this time: France, one of the politically most powerful countries in
Europe, suffered from some characteristics more typical to a
peripheral economy. The world market integration in the 1960s and 1970s led to a continuous trade balance deficit and together with the oil crises in the 1970s it put a stop to its rapid industrialization process from which it didn’t recover until the 1990s (Data: Worldbank).
data from national data sources with different data quality. E.g. Oman includes only firms with 10 and more employees, China reports data on firms with annual revenue above 20 million Chinese Yuan, etc. (see INDSTAT Metadata for more Information).
4
For the social effects see e.g. Sunkel (1972)
5 which in Italy was accompanied by reduced commodity prices due
to liberalisation policies and the rise of East Asian economies, as well as rising public debts because of the crisis of state-owned firms
3.3 Four accelerators after the 90s: the Eastern enlargement, financialization, the financial crisis and intra-European competition
Four further events were important for the accelerating polarization patterns in Europe: (1) the Eastern enlargement, (2) financialization, (3) the financial crisis as well as (4) the increasing race for the best location within Europe. During the eastern enlargement of the EU between 2007 and 2013 several countries entered the EU, which do not fit neatly to the dualist distinction between a ‘core’ and a ‘periphery’: recent studies suggest to treat them as a separate country groups (e.g. Gräbner et al., 2019) and
even stress differences among Eastern European countries
themselfes (see e.g. Bohle, 2017; Celi et al., 2018).6 The
fundamental differences of the Eastern to other European
countries are not surprising given the particular historical circumstances in which most Eastern European countries entered the EU in the 1990s: those eastern countries had just gone trough deep transformation crises following the disintegration of the Soviet Union and of former Yugoslavia. Moreover, the integration process into the EU induced further institutional changes due to the conditionality of the process, which included the need for the liberalization of capital movements and suggested privatizations (Bohle, 2017). The liberalization of goods and financial markets led to deindustrialization and high unemployment in a first phase, and the subsequent establishment of a low-wage sector which fitted into European supply chains in a second phase (Becker et al., 2016) . This way, the Eastern
enlargement had profound effects on the Southern periphery
since low-cost producers in the East started to displace exports from the South, indicating a replacement of imports from the South through imports from the East, particularly in sectors related to the German manufacturing core (Celi et al., 2018, see figure 4). Thus, the Eastern enlargement is, thereby, again an illustration of the structuralist argument
according to which peripheries and centres are affected
differently by general events. In the present case, while
countries in the core benefited from the new low-wage labor
markets in the East, countries in the periphery suffered from
the increase in competition.
The second major event is related to the liberalization of financial markets in the 1990s and 2000s. Financial goods became increasingly important and a shift in economic ratio-nale towards financial motives followed. The process of the increasing importance of the financial sector is commonly termed ‘financialization’ and had a profound impact on the Southern peripheries, particularly by facilitating speculative
6 Celi et al. (2018) distinguish two groups with strong vs. little
involvement into the German production network (i.e. Poland, Czechia, Hungary, Slovakia and Slovenia vs. Bulgaria, Croatia, Estonia, Latvia, Lithuania and Romania), while Bohle (2017) distin-guishes the Visegrad countries with a dependent export-led growth model from the Baltic countries, which were characterized by de-pendent credit-led growth.
Jobless growth 4% 6% 8% 10% 1965 1975 1985 1995 2005 2015 Emplo y ees in MVC in % of population
Employment in manufacturing
Growth mainly in most productive industries 0k 25k 50k 75k 100k 125k 1965 1975 1985 1995 2005 2015 MV A per emplo y ee
Productivity
Core PeripheryData: INDSTAT; authors' own calculations.
Figure 3: Jobless growth.
Periphery Finance China Catchup 0% 25% 50% 75% 100% 0% 25% 50% 75% 100% 1965 1975 1985 1995 2005 2015 Impor t share
Sources for imports of the core countries
a) Periphery Finance China Catchup 0% 25% 50% 75% 100% 0% 25% 50% 75% 100% 1965 1975 1985 1995 2005 2015 Expor t share
Destinations for exports from the core countries
b)
Data: Atlas of Economic Complexity (2020); authors' calculation using the SITC product classification.
Figure 4: Changes in the export relationships between the core and other clusters. This highlights the relative decline of the Southern periphery as compared to the Eastern countries and China. These figures do not consider exports within the core and between the core and the rest of the world. In 1965 and 2017 the relative exports from the core to itself (the rest of the world) accounted for 46.6% (42.36%) and 34.24% (40.41.69%) of total exports, respectively. The relative imports of the core from itself (the rest of the world) accounted for 45.65% (45.08%) and 35.74% (35.08%) of total imports in 1965 and 2017, respectively.
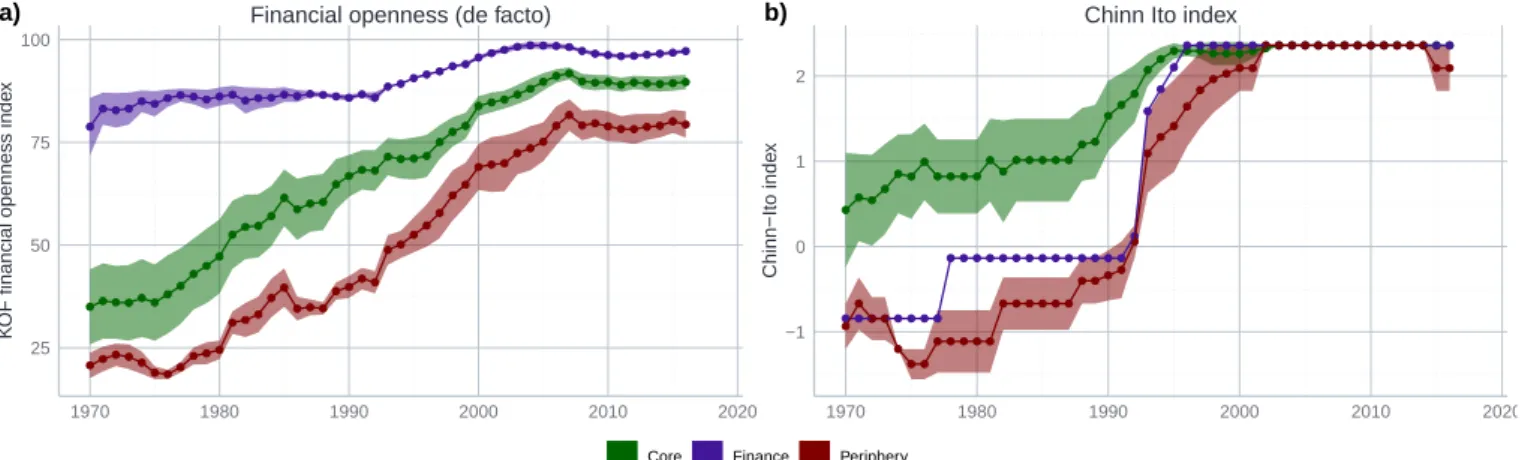
bubbles (for more details see p. 234ffin Celi et al., 2018). Important hallmarks for the financialization process in the EU were the lifting of capital controls in the 1990s, the dereg-ulation of interest rates (1993), the two banking directives on the harmonisation of the banking market (1981 and 1992) and the adoption of the 1999 Five-Year Financial Services Action Plan. Parallel to this process, the introduction of the Euro eliminated exchange rate risks and – together with the financial market deregulation – ultimately led to a fully integrated and liberalised European financial market, which caused a convergence of interest rates, risk assessments and an increase in cross-border capital transfers within the euro area (Caldentey and Vernengo, 2012, see figure 5).
In the southern European peripheries this new conditions gave rise to a new, debt-led growth-model with the notable exception of northern Spain in which solid industrial de-velopment was established. For the rest of Spain and the other Peripheries this new growth-model replaced the period of growth mostly based on industrialization in the 1960s and 1970s: The convergence of interest rates and risk as-sessments has greatly improved credit conditions for these countries. After a phase of stagnant economic development in the 1980s these favourable credit conditions made it pos-sible for households to increase consumer spending based on debt (Caldentey and Vernengo, 2012). Most notably in Greece and Portugal, the poorest of the southern European peripheries, this led to a “consumer society without a produc-tion base” (Fotopoulos, 1992, from Simonazzi and Ginzburg 2015, p. 125). Large amounts of capital also flowed into the real estate sector, which led, especially in Spain, to a sharp rise in prices and later to a real estate bubble. (Becker et al., 2015).
In face of the fact that the euro made currency devaluation an impossibility and the limitations for active industrial policy imposed by the Lisbon treaty the options to supporting catching-up industrialization by economic policy where limited (e.g. Celi et al., 2018). In this situation, politicians increasingly relied on the tourism sector as a growth driver. Credit-financed growth in the consumer, real estate and tourism sectors of the peripheries were the consequence (Celi et al., 2018, p. 86). At the same time, with the exception of northern Spain, the development of the production base stagnated. Thus, the process of financialization also provides for a further illustration of the structuralist argument that the polarization between cores
and peripheries gets reproduced by their different reaction
to general events: in this case, the financialization impacted
upon different European economies very distinctively.
This also applies to the financial crisis in 2007ff: while
the elaborations so far show that the crisis is as such not the reason for the current polarization patterns, it worked as an accelerator: countries in the periphery were hit asymmetrically hard because their growth models – which were mainly debt driven (see e.g. Gräbner et al., 2020b) – were rendered unfeasible through the crisis and the policital reactions in the form of austerity. Since these countries have
not been able to substitute the falling domestic demand with rising exports, due to the technological inferiority of the majority of their firms, they were hit hard by a recession, which was much less severe for the technologically advanced countries in the core (Gräbner et al., 2020b).
Finally, core-periphery relationships were aggravated through the increasing level of competition among Euro-pean countries (‘EuroEuro-pean race for the best locations’, see Kapeller et al., 2019). Given the current institutional frame-work, countries were incentivized to improve upon their relative competitiveness via particular location factors, if necessary at the expense of other European countries. In Germany and most other countries of the core these location factors could be provided by their technological capabil-ities (Gräbner et al., 2019, 2020b; Kapeller et al., 2019). The accumulation of such capabilities is a path dependent process in which countries with already many capabilities usually are enabled to accumulate even more capabilities faster, leading to a situation in which “success breeds further success and failure begets more failure” (Kaldor, 1980, p. 88).
Some other countries, especially those that entered the EU during the phase of the Eastern enlargement were not able to compete with the core countries in terms of their techno-logical capabilities, but given their historical circumstances
it was easy for them to offer low wages as an alternative
location factor (Gräbner et al., 2019). This strategy was, for historical and institutional reasons, not feasible in countries in the European South, such as Italy, Spain or Portugal.
The financialization patterns described above allowed for another way to create favorable location factors: countries such as Ireland, Luxembourg, the Netherlands or Malta attracted companies and wealthy companies and individuals with a ‘competitive regulatory framework’, which allowed these players to save taxes and evade regulations in other European countries. Ireland, for instance, provides favorable conditions for multinationals, particularly in the pharmaceutical and chemical industries (see, e.g., Barry and Bergin, 2012) and Luxembourg competes with low tax rates for wealth and swift financial services (e.g. Zucman, 2015) These strategies are typical examples for ‘beggar-thy-neighbor’ policies, which improve the situation of one country at the expense of others. With regard to the tax strategy of the Netherlands, Cobham and Garcia-Bernardo (2020) estimate that European member states lost in total 10-15 billion of corporate tax, with the corresponding corporate tax collected in the Netherlands amounting to only about 2 billion Euros. Three of the
five by far most affected countries belong to the periphery:
France, Italy, and Spain lost about 2.7, 1.5 and 0.9 billions of corporate taxes due to the Netherlands (Cobham and
Garcia-Bernardo, 2020).7 Thus, the ‘race for the best
7 The other two most affected countries were Germany and Belgium
25 50 75 100 1970 1980 1990 2000 2010 2020 K
OF financial openness inde
x
Financial openness (de facto) a) −1 0 1 2 1970 1980 1990 2000 2010 2020 Chinn−Ito inde x
Chinn Ito index b)
Core Finance Periphery
Data: Gygli et al. (2019), Chinn & Ito (2006); authors' own calculations.
Austria Belgium Germany Denmark Spain Finland France Ireland Italy Luxembourg Netherlands Portugal Sweden Greece
Malta Bulgaria BelgiumAustria
Czechia Germany Denmark Greece Spain Finland France Hungary Ireland Italy Lithuania Luxembourg Latvia Malta Netherlands Poland Portugal Romania Sweden Slovenia Slovakia 0% 5% 10% 15% 20% 1990 1995 2000 2005 2010 2015 Interest r ate diff erence to Ger man bonds
Catchup Core Finance Periphery
Risk spreads for long−term government bond yields (individual countries)
Data: Eurostat; authors' own calculations.
c)
Figure 5: Financialization in the Eurozone.
location’ is in several dimensions an accelerator for the polarization patterns in Europe and thereby a stabilizer for the core-periphery demarcation within the EU.
In all, the historical elaborations so far suggest that today’s polarization processes have their roots in the longer-run dynamics in the EU. This is consistent with early prediction of structuralist scholars such as Musto (1981). The next section complements these structuralist observations with new forms of evidence on the trade flows on the product level between European countries for the time period considered.
4 Unequal technological exchange in the EU trade network
The previous elaborations stressed the relevance of the in-dustrial sector for economic development and polarization dynamics. This section complements the analysis so far by highlighting another dimension of self-reinforcing core-periphery relations in the European trade data (for a visu-alization see figure 6). To this end, we study data on intra-European trade flows on the product level. These data has considerable advantages over ‘simple’ macro data such as
the total GDP was, however, lower.
such as GDP and industrialization shares, which contains only limited information about production structures and no information about the relationships and dependencies across countries – the latter being crucial for a structuralist analysis. At the same time, there are undeniable drawbacks such as the inability to identify outsourcing activity and ex-ploitative value added chain structures. To consider such information one would need to use value-added-trade data, which would come with considerable disadvantages in itself, such as its dependency on the assumptions made during its construction and its limited availability. Thus, while a value-chain-analysis in the spirit of Caliendo et al. (2017) would add considerably to the topic at hand, one has to acknowl-edge that not only does such analysis come with its own fundamental drawbacks, it is certainly beyond the scope of the present paper.
That being said, the network-theoretic analysis of trade data helps us to highlight a dimension of polarization in Europe that has so far received little attention in the literature: that of an ‘unequal technological exchange’.
The concept of an ‘unequal exchange’ has a long tradition in structuralist thought, dating back to the original hypothe-sis of Prebisch (1950) and Singer (1975) (see also section 2). They argued that the exchange of agricultural goods from the periphery to the core and of industrial goods from the
The european trade network in 1970 BEL DNK DEU ESP FRA ITA NLD SWE FIN AUT POL CYP HUN IRL PRT GRC MLT ROU BGR
The european trade network in 2016
AUT NLD BEL BGR CYP CZE DEU DNK ESP EST FIN FRA GRC HUN IRL ITA LTU LUX LVA MLT POL PRT ROU SVK SVN SWE
Figure 6: The European trade network in 1970 and 2016. Thickness of the edges corresponds to intensity of trade, and size of the vertices to total exports of these countries. Data: Atlas of Economic Complexity (SITC); authors’ own calculations.
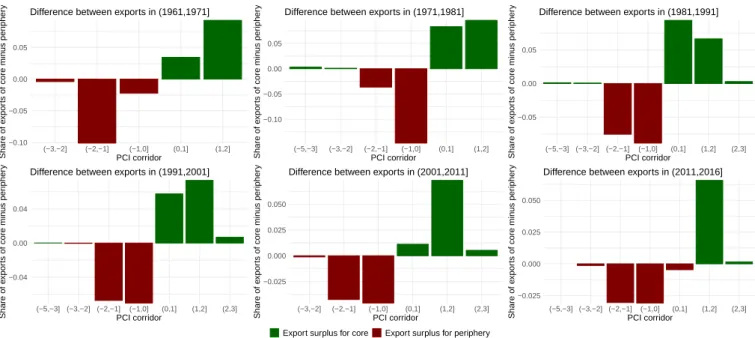
core to the periphery were detrimental for the development of the periphery. As can be seen from figure 7, a variant of such unequal exchange relationship can be observed for the Eurozone. Only this time it is not about agricultural and industrial, but about simple and complex products: one can observe that countries from the periphery export less complex products to the core, while the core countries ex-port more complex products to the periphery. This suggests the existence of a ‘vicious specialization’ in Europe: the core countries have specialized in the production of com-plex products, i.e. an activity that has been found to be one key driver to economic prosperity (Hidalgo and Hausmann, 2009; Hidalgo et al., 2007), while the periphery countries serve as workbenches for less attractive goods. This finding aligns well with Gräbner et al. (2019), who find that trends in sectorial specialization in Europe happened at the expense of Southern European countries. The present analysis provides additional evidence from European network data.
This is an example where the tools of complexity eco-nomics help highlighting yet another dimension of the un-equal relationships between cores and peripheries as pre-viously theorized by structuralist thinkers. The resulting concept of an ‘unequal technological exchange’ aligns well to core-periphery thinking as outlined above and, as will be discussed in the next section, has some immediate implica-tions for policy.
5 Discussion
5.1 Core-periphery structures in the EU
One goal of the present paper was to contribute to a better understanding of the historical roots of polarization patterns in the EU from a structuralist perspective, while at the same time providing a critical self-reflection on the analytical use-fulness of structuralist country taxonomies. In this context, the paper highlights a number of issues that are also relevant for the delineation of policy measures against polarization patterns (see section 5.2):
First, the history of Europe is not exclusively a history of polarization. There were periods – albeit brief – without a drifting-apart between country groups and in which coun-tries in the periphery showed some signs of actual catching-up. These periods, however, were short and fall into the time before the focus on trade liberalization in the EU.
Second, the literature and the present paper discuss sev-eral events and phenomena that can be considered reasons
for polarization, such as financialization, the 2007ffcrisis
or inter-European competition. The long-term perspective of section 3 suggests, however, that many of these alleged reasons are accelerators rather than ultimate causes for po-larization: a divergence of production structures and
asym-metric trade relations in the form ofunequal technological
exchangehave been visible well before the Eastern Enlarge-ment, the financial crisis, or the emergence of a financialized growth model. While this is not to deny the important role of these events in substantially accelerating polarization, it does suggest to also ask for deeper reasons of polarization and for ways to eliminate these ultimate sources via adequate
−0.10 −0.05 0.00 0.05 (−3,−2] (−2,−1] (−1,0] (0,1] (1,2] PCI corridor Share of e xpor ts of core min us per ipher y
Difference between exports in (1961,1971]
−0.10 −0.05 0.00 0.05 (−5,−3] (−3,−2] (−2,−1] (−1,0] (0,1] (1,2] PCI corridor Share of e xpor ts of core min us per ipher y
Difference between exports in (1971,1981]
−0.05 0.00 0.05 (−5,−3] (−3,−2] (−2,−1] (−1,0] (0,1] (1,2] (2,3] PCI corridor Share of e xpor ts of core min us per ipher y
Difference between exports in (1981,1991]
−0.04 0.00 0.04 (−5,−3] (−3,−2] (−2,−1] (−1,0] (0,1] (1,2] (2,3] PCI corridor Share of e xpor ts of core min us per ipher y
Difference between exports in (1991,2001]
−0.025 0.000 0.025 0.050 (−3,−2] (−2,−1] (−1,0] (0,1] (1,2] (2,3] PCI corridor Share of e xpor ts of core min us per ipher y
Difference between exports in (2001,2011]
−0.025 0.000 0.025 0.050 (−5,−3] (−3,−2] (−2,−1] (−1,0] (0,1] (1,2] (2,3] PCI corridor Share of e xpor ts of core min us per ipher y
Difference between exports in (2011,2016]
Export surplus for core Export surplus for periphery
Data: Atlas of Economic Complexity (SITC data); authors' own calculations.
Figure 7: Unequal technological exchange in the Eurozone. The Product Complexity Index (PCI) corridor groups products by their complexity, with higher values indicating higher complexity. The values on the y-axis indicate the export surpluses of the groups with positive values indicating a relative surplus for core countries, and negative values indicating a relative surplus for periphery countries.
policy measures.
Third, section 2.3 introduced three challenges for
struc-turalist country classification: the challenges ofdynamics,
ambiguityandgranularity. Throughout the historical view on the developments in Europe on encounters numerous examples for the relevance of each of these challenges. Italy, for instance, has moved from the group of core countries in
the 50s to the periphery, illustrating thechallenge of
dynam-ics. France is a country that holds both characteristics of a
core country (e.g. influential political position), as well as a member of the periphery (e.g. high unemployment and
vulnerable labor markets), thereby illustrating thechallenge
of ambiguity. And Spain with its ’cores within the
periph-ery’ does the same for thechallenge of granularity: regions
in the North are economically extremely well-offand
com-petitive, while much of the remaining countries is facing serious economic problems. This suggests that country clas-sifications have to be used carefully and the criteria for the classification must be made very explicit. Moreover, one must keep in mind that heterogeneity both within country groups as well as within countries might be considerable and that despite path dependencies it is not impossible for countries to switch to an alternative development trajectory,
catapulting them into a different group.
Fourth, despite the relevance of the three challenges just described, the country classifications are relatively stable and changes between groups can happen only in particular windows of opportunity (or ‘critical junctures’ Capoccia and Kelemen, 2007). Therefore, adopting a core-periphery view on the developments in Europe not only helps to highlight these exceptionable events, but also facilitates the
identifica-tion of important structural features of polarizaidentifica-tion patterns in Europe. Particularly, a historical view shows that
coun-tries on different development trajectories can be affected
very differently by the very same historical event, and that
institutional changes in the Union, although affecting all
countries equally in the first place, do not necessarily have the same consequences for all countries (on a similar point regarding institutions more general see Chang, 2010).
Fifth, the structuralist perspective on core-periphery rela-tions is distinctively useful when compared to other research programs also using a core-periphery categorisation (see sec-tion 2): ‘cores’ and ‘peripheries’ in Europe are not merely
a result of different endowments, policies and institutions
as considered in the fields ofNew Trade Theory,New
Eco-nomic Geographyor theVarietes of Capitalismapproach. Rather, the relationships among ‘cores’ and ‘peripheries’ reproduce the groups themselves and must not be neglected when designing policy measures meant to end polarisation in Europe.
Finally, the simultaneous relevance of the challenges as well as the usefulness of structuralist country classifications and the focus between groups suggests that relationships
between countries on different trajectories are an important,
yet one among several explanatory elements to make sense of polarisation. As often the case in economics, a plurality of approaches is necessary to fully understand a given phe-nomenon. The single approach, illuminating as it is, will
always suffer from certain blind spots, which can only be
eradicated by a pluralist research endeavour transcending a single study.
5.2 Industrial policy for resilient economic development
The prior analysis has shown that there are structural fea-tures in the EU economy that limit the ability of peripheral European countries to develop industries on their own terms and capture more of the value they help create. Only a co-herent set of EU-wide policies that coordinates economic policies through multi-level governance across states can address this problem. One key element of such a set of policies is a place-based, self determined industrial policy that allows regions to develop resilient industries. Based on the previous results and building upon recent literature (e.g. Chang, 2009; Lin and Chang, 2009; Mazzucato, 2015; Pianta et al., 2020) we suggest that such an industrial policy should follow the following three key principles:
• Adaptability of Policies to allow for the flexibility needed to react to unforeseen challenges and to do justice to the nature of complex innovation processes (Peneder, 2016; Teece, 2017).
• Context appropriatenessis necessary to do justice to
the fact that the same rules affect countries on different
development trajectories differently, and different
re-forms are needed in core, periphery, catch-up and finan-cialized countries. This also allows to make better use of country-specific existing technological capabilities (Hidalgo et al., 2007) and institutional arrangements (Chang, 2010; Cimoli et al., 2009).
• Coherenceto create policy packages that maximize synergies instead of focusing on single policies with
the risk of creating unnecessary trade-offs (Grahl and
Teague, 2013, for EU Commission discussion on the topic see e.g. C(2016)6626 and SWD(2019)20). Here
it is important to also factor in long-run trade-offs like
resource depletion and climate trade-offs to make sure
that established industries are resilient.
As indicated by Bailey et al. (2018), the EU was already taking steps in the right direction, e.g. with its smart spe-cialization strategy that emphasizes ‘place’ as a key part of policy-making and, thereby, allows for a certain degree of context appropriateness. However, as Hassink and Gong (2019) point out it also has its clear drawbacks, as it builds on existing competitive advantages and therefore structurally weak regions are less likely to benefit from it. Accordingly, it might even support divergence rather than supporting con-vergence. The new 2020 industrial strategy for Europe
(COM/2020/102) and the new cohesion policies are also
addressing some important points by supporting innovation capacities through investments and pushing for a greener low-carbon economy. The COVID recovery and resiliency
facility (EUCO 10/20. CO EUR 8. CONCL 4) will
po-tentially also provide 750 billion Euro for investments in the form of loans and grants and one of its proposed top
priorities is cohesion. However, as with the smart special-ization strategies there is also still room for improvements. E.g. the level playing field approach that can be found in the new industrial strategy lacks context appropriateness as
it doesn’t do justice to the differentiated needs of
periph-eral economies (Landesmann and Stöllinger, 2019). Policy
coherence is an ongoing challenge that is not sufficiently
addressed and information on existing technological capabil-ities are not considered in the decisions on where to invest. In fact, some existing rules and regulations like the state
aid rules make it very difficult to employ vertical
indus-trial policy which is necessary to make best use of existing technological capabilities(Landesmann, 2015).
The widespread acknowledgement of the need for ecolog-ical policy reforms in Europe allows for a coherent cross-fertilization between policies geared towards more conver-gence and an ecological transformation in the EU. One exam-ple for such comexam-plementary measures is the establishment of (mostly) inner European supply-chains for the production of essential goods like medical equipment and pharmaceuticals, which has gained further momentum during the Covid-19 crisis in 2020. Strategically placing lead-firms of those supply-chains in peripheral regions could not only foster European convergence by boosting capability accumulation in the periphery, it could also make the European economy more resilient by reducing its dependency on imports, level economic power structures within the EU and reduce overall carbon emissions by saving transport emissions.
While there is a need for more far-reaching reforms in the EU (see, e.g., Kapeller et al., 2019), there is already much potential to use already existing policy processes to address the challenge of polarization. For instance, the context appro-priateness of existing policies could be improved by adding criteria to the cohesion fund as well as the recovery and re-silience facility in order to push specific technologies which build upon already existing technological capabilities. A long term objective of EUs industrial policy is creating an
international level playing field8. Building on that a carbon
border tax could be implemented to support the establish-ment of green, and thus long-term resilient, industries. Or, finally, adding resilient and coherent industrial development as a core dimension to the Annual Sustainable Growth Sur-vey would put this topic high on the Agenda of the European semester.
However, changes to some existing rules and regulations are also necessary to allow individual member states di-rected investments and vertical industrial policy. At the
moment, the stability and growth pact is effectively
hamper-ing peripheral economic development by limithamper-ing necessary investments due to its restrictive fiscal rules (Heimberger, 2020). Existing state aid rules prevent the direct support of specific industries, although such support would be nec-essary to achieve convergence (e.g. Gräbner et al., 2020b;
8 As opposed to the inner EU level playing field approach that is
Kapeller et al., 2019; Pianta et al., 2020). As these changes require majorities among member states in the council that are not straightforward to establish, it seems necessary to start with the reforms that could immediately implemented within the current set of rules and regulations.
6 Summary and conclusions
The present paper was meant to address two major goals: first, to contribute to a better understanding of the historical roots of polarization patterns in the EU from a structuralist and complexity perspective, and, second, to provide a critical self-reflection on the analytical usefulness of structuralist country taxonomies.
The paper suggests that while there were (short) periods of convergence in Europe, the existence of coperiphery re-lations and a divergence of living standards has been the rule rather than the exception. This divergence has its reason not (only) in individual country characteristics, but also in the relationships between countries. The results of the analysis indicate that there are asymmetric trade structures regard-ing the technological complexity of traded goods between
European Cores and peripheries. Thisunequal
technolog-ical exchange, it was argued, is effectively hampering the development of the peripheries.
The present analysis shows that the structuralist approach of using dependencies among countries and their reproduc-tion as one central explanandum is useful. At the same time, the paper indicates the existence of three challenges for the structuralist approach of using country taxonomies
– the challenges ofdynamics,ambiguityandgranularity–
that must be kept in mind and that show that a structuralist analysis must be complemented with other approaches in a pluralist fashion.
Based on these results, some pragmatic policy implica-tions that can be placed within existing policy programs of the EU were delineated. Although these policies can be
considered an important first step, fostering effective
con-vergence will require more far-reaching reforms of the insti-tutional structure of the EU. Given the political promise of the EU to bring about socio-economic convergence among its members, however, these challenges seem to be worth taken.
Acknowledgements
We are grateful to Matthias Aistleitner, Julia Eder, Philipp Heimberger, Anna Hornycewycz, and Oliver Richters for their extensive and most useful comments on earlier versions of this paper. All remaining errors are our own.
The authors gratefully acknowledge financial support of the Economic and Social Research Council (UK) under grant
reference number ES/R00787X/1. We also acknowledge the
role of the National Institute of Economic and Social Re-search (NIESR) in hosting the Rebuilding Macroeconomics Network. CG also acknowledges funding from the Austrian Science Fund (FWF) under grant number ZK 60-G27.