PARASITES ENHANCE ECOSYSTEM FUNCTIONS AND RESISTANCE TO DROUGHT IN A COASTAL ECOSYSTEM
Joseph Philip Morton
A thesis submitted to the faculty of The University of North Carolina at Chapel Hill in partial fulfillment of the requirements for the degrees of Master of Science in the Department of Marine
Sciences.
Chapel Hill 2015
ii © 2015
iii ABSTRACT
Joseph Philip Morton: Parasites Enhance Multiple Ecosystem Functions and Resistance to Drought Stress in a Coastal Ecosystem (Under the direction of Charles H. Peterson).
Parasites are more diverse and numerous than the organisms they feed upon, yet we know little about how parasites affect natural ecosystems. In salt marsh ecosystems of the southeastern U.S., increasing drought stress interacts synergistically with keystone grazing by marsh
iv
v
ACKNOWLEDGMENTS
The practice of gratitude is, at its core, the explicit effort to acknowledge that one’s accomplishments have come into being through the labor of innumerable hands, countless gifts given in love to be celebrated in joy. I am endlessly grateful to all of those people whose efforts, large and small, made this work possible. I would like to thank my wonderful and brilliant lab mates, Stacy Zhang, Elizabeth Schrack, and Qiang He, who could always be counted on to provide much-needed encouragement, intellectual support, camaraderie, and field assistance. They were all terribly generous with their time and always open to discussing the nuances of experimental design and implementation. I am proud to count them among my dearest friends. Additionally, I am so grateful to Sarah Sunu, Eliza Oldach, Carrie Hamilton, Megan Schmitt, Jenny Hughes, Matt Dwinell, and Morgan Freese for their assistance in the lab and field. The tedious preliminary work upon which this project was founded could not have been completed without the limitless patience and assiduousness of Erica Wenzel. I would like to thank Rachel Gittman, who encouraged me to pursue my research on trematode parasitism in Littoraria
irroratta while employed as her technician. I couldn’t have asked for a better boss and friend. I
am grateful for my good friend, Teri O’Meara, for reminding me to stop and smell the roses once
in a while. I am incredibly grateful for my advisor, Pete Peterson, whose mentorship has
vi
material support made this project a success. Finally, I would like to express my gratitude to my family for their encouragement and support from the very beginning. Every breath I draw is a whispered “thank you”.
vii
TABLE OF CONTENTS
LIST OF FIGURES...vii
I. INTRODUCTION...1
II. METHODS...4
Study System...4
Experiment...4
Changes to Salt Marsh Structure...6
Snail Climbing...7
Primary Production...7
Infiltration Rate...8
Nursery Habitat...8
Decomposition Rate...9
Survey of Marsh Die-off Areas...9
Statistical Analysis...10
III. RESULTS...11
Initial Plot Conditions, Infection Prevalence, and Snail Densities...11
Radulations...11
Aboveground Biomass, Live Stem Density, and stem height...12
Snail Climbing Behavior...13
Primary Production...13
viii
Decomposition Rate...14
Nursery Habitat...14
Survey of Marsh Die-off Areas...15
IV. DISCUSSION...16
VI. FIGURES...20
ix
LIST OF FIGURES
Figure 1.1 – The effect of parasite prevalence on L. irrorata radulations on S. alterniflora...20
Figure 1.2 – The effect of parasite prevalence on S. alterniflora aboveground biomass...21
Figure 1.3 – The effect of parasite prevalence on S. alterniflora stem density...22
Figure 1.4 – The effect of parasite prevalence on S. alterniflora stem height...23
Figure 2 – The average proportion of infected and uninfected snails above the mean high water line (MHWL) in each plot...24
Figure 3.1 – The effect of parasite prevalence on S. alterniflora net primary production...25
Figure 3.2 – The effect of parasite prevalence on infiltration rate...26
Figure 3.3 – The effect of parasite prevalence on decomposition rate...27
Figure 4.1 – The effect of parasite prevalence on the abundance of juvenile L. irrorata...28
Figure 4.2 – The effect of parasite prevalence on the abundance of juvenile fiddler crab burrows...29
Figure 4.3 – The effect of parasite prevalence on the abundance of grass shrimp...30
Figure 4.4 – The effect of parasite prevalence on the abundance of juvenile Killifish...31
Figure 5 – The average shell lengths, measured from apex to arperture, of adult L. irrorata collected from each survey site...32
1
INTRODUCTION
A primary goal of ecology is to determine what factors influence the stability of ecosystems. The stability of ecological communities in response to disturbances is largely a function of their ability to absorb stress and remain “essentially unchanged” in terms of their
taxonomic composition, process rates, trophic structure, and functions (i.e. resistance) (Grimm and Wissel, 1997). Understanding the processes that underlie ecosystem resistance is essential for more robust predictions of how communities will respond to environmental change and for development of effective conservation measures.
A sizable body of research has focused on the role of top predators in organizing communities and increasing ecosystem resistance through trophic control of prey population densities. Evidence from both terrestrial and aquatic systems suggests that ecosystems in which top predators have been retained or restored show an increased capacity to buffer against environmental stresses, including those associated with climate change (Mittelbach et al., 1995; Wilmers et al., 2006a, b; Wallach et al., 2010). Additionally, in many systems, the loss of top predators can trigger cascading effects that ultimately result in a loss of ecosystem structure and function (Estes and Palmisano, 1974; Carpenter et al., 1985; Silliman and Bertness, 2002; Myers et al., 2007; Estes et al., 2011; Rosenblatt et al., 2013; Bertness, 2014).
2
herbivores directly by reducing densities or reproductive capacity or indirectly through modification of host phenotype. If a host is abundant or otherwise ecologically influential, parasites may modulate resource availability to other organisms or initiate state changes in biotic or abiotic community components (Jones et al., 1994, 1997). Because phenotypic alterations of host species may ultimately modify the habitat of all community members, parasites, like predators, may be able to affect ecosystem stability. While parasites are ubiquitous community components and parasitism represents the most common organismal feeding strategy on the planet (Dobson et al., 2008; Kuris et al., 2008), there is still very little known about how parasites modify the behavior of keystone hosts and how such modifications affect important ecosystem properties such as functional stability of ecosystem structure and function, including resistance to disturbance (but see Combes, 1996; Wood et al., 2007, and Sato et al., 2012).
In salt marsh ecosystems of the Southeastern United States, episodic, sub-lethal edaphic stress associated with drought interacts synergistically with grazing by the keystone gastropod,
Littoraria irrorata, to produce small- to large-scale localized die-off events (Silliman et al.,
2005; Angelini and Silliman, 2012). While precipitation in the Southeastern United States is predicted to increase under climate change scenarios, evaporation is expected to outpace
precipitation over the next century, potentially exacerbating drought in the region (Seager et al., 2009). Die-off, triggered by regular episodic drought events, has the potential to induce major shifts in ecosystem structure, function, and services, elevating the importance of understanding marsh processes that contribute to ecosystem stability.
3
the first intermediate host to three species of digenean trematodes, with the great majority of infections by the cosmopolitan species Parorchis acanthus (R. Heard, pers. comm.). Infection
with P. acanthus yields marked changes to snail behavior, dramatically reducing both snail
radulation of live Spartina tissue and circatidal climbing up Spartina stems (Morton, unpublished data). Moreover, infection incidence can be high enough in some marsh areas (>25%), that trematode infections could have a positive localized effect on salt marsh community structure and function.
4 METHODS
Study System
I conducted my experiment in the intermediate Spartina alterniflora zone of a marsh within the Hoop Pole Creek Clean Water Reserve in Atlantic Beach, North Carolina, USA (34°42’25.12” N, 76°45’1.14” W). The study site was characterized by an absence of snails, an
initial subsurface soil salinity of ~35 ppt, and a relatively uniform elevation (determined by use of a laser level). The experiment was conducted over the course of the Spartina growing season (May- August) of 2014.
Experiment
To test the hypothesis that widespread trematode infection can diminish the capacity of snails to overgraze marsh under sub-lethal salt stress conditions, we established 0.5-m22 caged
5
area, whereas the 30% treatment represented a naturally occurring high prevalence from the same site (Joseph P. Morton, unpublished data). We added 100 adult snails with shell length (mean ± SE) 18.71 ± 0.45 mm and wet weight of 1.62 ± 0.11 g per individuals to each grazer addition plot. The grazer density used was representative of naturally occurring densities along marsh die-off areas of Hoop Pole Creek determined in early summer (May 10th) by haphazardly
tossing a 0.5-m-2 quadrat a total of 20 times along die-off borders and enumerating the snails therein.
Salt was delivered monthly to sediments in appropriate treatments for the duration of the experiment (3 months) by inserting 16 plastic centrifuge tubes (50-ml) with 16 holes (hole diameter 0.16-cm) drilled in the sides into the sediments within each plot. Each tube contained 150 g of salt. Pore water salinity was monitored and salt added monthly (May- July) to sediments within appropriate treatment plots. At total of 900-g of salt was added to each plot during the course of the experiment.
6
Changes to Salt Marsh Structure
I took measurements of several marsh characteristics in all plots initially and in each month following installation for the duration of the experiment. Because the total length of snail radulations per stem is directly proportional to the magnitude of the negative effects of snail grazing on Spartina production (Silliman et al., 2004), we enumerated the total length of radulations on the topmost unfurled leaf of 5 randomly selected stems within each plot. Additionally, we determined live and dead stem densities and measured the heights of ten randomly selected stems in each plot (measured to the highest extent of live, green tissue). In both instances, stems were randomly selected by tossing small plastic dowel into the plot and then taking measurements stems touching the dowel. If the number of stems in contact with the dowel was insufficient, measurements were taken from stems closest to the dowel.
At the end of the experimental period, all aboveground biomass was harvested and dried at 60°C for two weeks. Change in biomass over the growing season was calculated from height measurements using regression of stem height vs. stem biomass. Aboveground growth of S.
alterniflora for each treatment is reported as net production (g dry mass · m-2 · mo-1) and as live
standing biomass at the end of the experiment. Belowground biomass was sampled using two 0.5-cm diameter, 30-cm deep cores taken from the center of each plot at the end of the
7
Snail Climbing
Snails actively avoid predators by climbing Spartina stems with the incoming tide. Once they have ascended, snails produce longitudinal scars with their radula, making a suitable substrate for fungal growth. Because trematode infection affects snail locomotion and because such changes could affect grazing intensity, we assessed differences in snail movement and position relative to the substrate at both low and high tide. Within a month of the experiment’s installation, we enumerated the number of infected and uninfected snails in each plot above the water line at high tide. At low tide, five infected and five uninfected snails that were closest to the center salt-addition well were selected and their height above the dry marsh substrate was measured. Snail position (on stems, on the marsh substrate, or at the base of stems) was also recorded for each individual.
Primary Production
To determine the effect of parasite infection prevalence on net primary productivity (NPP), net Spartina production over the duration of the experiment was estimated by measuring the difference in live aboveground plant biomass from the beginning to the end to the
experiment. In May, when experimental plots were established, we measured stem height and density in all plots and converted these measurements to an initial standing biomass by using regressions based on destructive sampling of Spartina stems taken from just outside the
plots. Initial standing biomass did not differ significantly across plots (mean estimated Spartina
8
Infiltration rate
We quantified the effect of parasite infection prevalence on marsh sediment infiltration rate (i.e. the rate at which surface water moves into and through the sediment) at the conclusion of the experiment through the use of a double-ring infiltrometer (Johnson A.I., 1963). Two hours after high tide, we placed a 2.0-L ring firmly in the center of each plot and filled it with 1.0-L of water drawn from the tidal channel adjacent to the study area. Infiltration rate was measured as the amount of time required for the water to completely drain out of the ring and into the soil (L · hr-1). This measurement was repeated in five plots for each treatment.
Nursery habitat
9
Decomposition rate
One month before the end of the experiment, we quantified the effect of parasite-mediated behavioral changes on marsh decomposition rate by deploying a bundle of dead Spartina stems zip tied to a plastic marker flag. Standing dead Spartina stems were collected from an area adjacent to the experimental cages, rinsed clean, and dried to a constant weight (2 weeks at 60°C). Dried stems were cut into 10 cm pieces, which were then grouped into bunches of three and weighed to the nearest 0.001 g. Weighed bundles were then affixed to a plastic marker flag, which was placed at the center of each plot with the lower margin of each bundle positioned at 3 cm above the sediment surface. After 30 days, remaining plant matter was retrieved, carefully washed, and dried to constant weight as before. The dry remnants were weighed and mass lost was calculated for each plug. Decomposition rate was measured as the difference between initial and final stem bunch biomass per month.
Survey of die-off areas
10
border. Within each quadrat, all visible snails were collected, transported back to the lab,
measured, and dissected to determine infection status. Additionally, radulations and stem height data were collected in each quadrat as for the cages in the previous experiment.
Statistical analysis
Treatment differences in response variables measured at the end of the field experiment were assessed using two-way ANOVA followed by Tukey’s honestly significant difference (HSD) test for post hoc analysis. Data analyzed using two-way ANOVA both exhibited homogeneity of variance (confirmed through Levene’s test) and were normally distributed
(confirmed through Shapiro-Wilk test) or were transformed using log transformations for analysis to conform to test assumptions. For data that did not meet normality assumptions (counts of Fundulus and Cyprinodon spp.), a generalized linear model (GLM) was employed for analysis. Differences in heights climbed by infected and uninfected snails within plots at low tide and differences in the proportion of infected and uninfected snails above the mean high water line at high tide were evaluated with a one-way ANOVA.
11 RESULTS
Initial plot conditions, infection prevalence, and snail densities
Initial plot vegetation conditions (mean height, density of live and dead stems, and stem biomass) were not significantly different among treatments and the interaction of treatments (P>0.35 at least, two-way ANOVA, for each response variable). There were no significant differences in Spartina, NPP, stem density, or stem height means between caged controls and uncaged plots. Additionally, there were no significant differences in means of potentially confounding factors (i.e., fiddler crab abundance, elevation, porewater salinity) among treatments (P>0.6, two-way ANOVA, for all response variables). The final mean infection prevalence for each treatment did not differ significantly from initial conditions (P>0.94, two-way ANOVA, all cases) indicating that the infection rate at the study site was consistently very low. On average, less than one snail per week was removed from caged snail exclusion controls. The mean weekly deviation in snail density in snail addition treatments never exceeded 10%.
Radulations
12
prevalence. There was a significant interaction between salt addition and parasite prevalence (P= 0.037, two-way ANOVA).
Aboveground biomass, live stem density, and stem height
Salt addition significantly decreased mean aboveground biomass (Fig. 1.2, P < 0.0001, two-way ANOVA), live stem density (Fig. 1.3, P < 0.03, two-way ANOVA), and the change in average stem height (Fig. 1.4, P<0.0001, two-way ANOVA) in plots where it was added. There was no significant interaction effect of salt addition and parasite prevalence for any of these factors (P>0.42, at least, two-way ANOVA). Parasite-driven differences in the magnitude of grazer-induced wounds on live Spartina translated into marked changes in these metrics of marsh structure, quantified at the end of the experiment. Plots with healthy snails (no parasite infection) lost the greatest average amount of biomass compared to snail-free controls (69% in unsalted plots, 93% in salted plots). Mean aboveground biomass increased significantly with increased parasite prevalence (Fig. 1B, P<0.0001, two-way ANOVA). Increases in biomass were roughly proportional to the level of infection prevalence. A 10% increase in infection prevalence decreased the amount of biomass lost by 13% in salted plots and 11% in unsalted plots (Tukey HSD, P<0.0001, both cases). Likewise, a 30% increase in infection prevalence decreased the amount of biomass lost by 34% in salted plots and 23% in unsalted plots (Tukey HSD, P<0.0001, both cases).
Parasite prevalence and salt affected not only the amount of available marsh structure but also structural qualities. Salt addition significantly decreased the difference in mean stem height over the course of the experiment, while increased parasite prevalence was significantly
13
ANOVA). Likewise, live stem density decreased significantly with both the addition of salt and increasing parasite prevalence (Fig. 1.3, P<0.0001, both cases, two-way ANOVA).
Snail climbing behavior
Trematode infection significantly decreased average height climbed above the marsh substrate at low tide by more than 66% (P<0.0001, one-way ANOVA). Infected snails were 6 times more likely to be found on the marsh substrate at the base of stems than uninfected conspecifics at low tide. At high tide, a significantly smaller mean proportion of infected snails remained above the mean high water line (MHWL) (12.8%) compared to uninfected conspecifics (80.7%) (Fig. 4, P<0.0001, one-way ANOVA).
Primary production
Net Primary Production (NPP), calculated at the end of the experimental period, increased significantly with the increased infection treatment level and decreased significantly with the addition of salt (Fig. 3.1, P<0.0001, both cases, two-way ANOVA). There was no significant interaction between salt and parasite prevalence on NPP (P>0.5, two-way ANOVA). NPP values for salt addition plots with 0% and 10% infection prevalence treatments were negative, indicative of the net loss of biomass within those plots.
Infiltration Rate
14
Decomposition rate
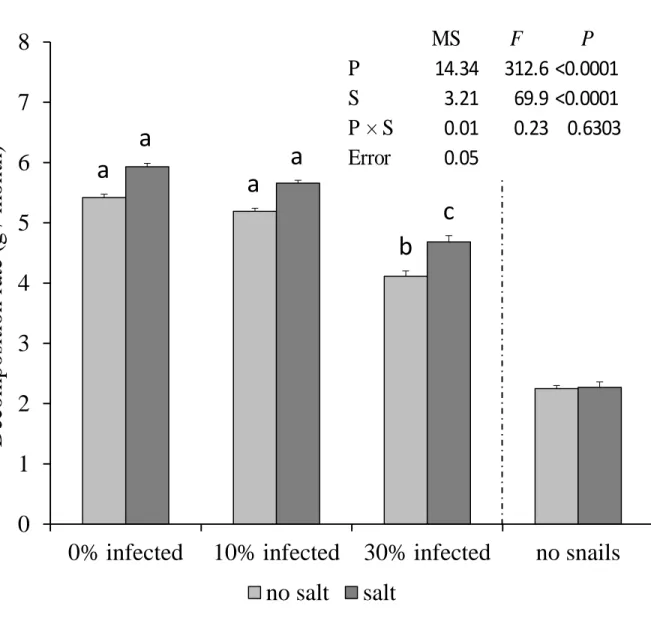
Salt had no significant effect on decomposition rate in snail-free controls. In plots with snails, decomposition rate decreased significantly with increasing level of infection prevalence and significantly decreased with the addition of salt (Fig. 3.3, P<0.0001, both cases, two-way ANOVA). The interaction effect between salt addition and parasite prevalence was non-significant (P>0.63, two-way ANOVA). At both levels of salt stress, there was no non-significant difference in decomposition rate between the 0% and 10% infection prevalence treatments (Tukey HSD, P>0.09, both cases), although decomposition did decrease in the latter.
Nursery Habitat
By reducing the quality and quantity of salt marsh structure, snail grazing affected nursery habitat utilization for all mobile species quantified. The abundances of juvenile snails and grass shrimp declined significantly with the addition of salt (Fig. 4.1 and 4.2, P<0.0001, both cases, two-way ANOVA), while the abundances of juvenile crab burrows and juvenile killifish were not significantly affected by salt addition (Fig 4.3 and 4.4, P>0.81 and GLM, P>0.40, respectively, two-way ANOVA). The abundance of all species increased significantly with increasing levels of parasitism (Fig. 4.1 – 4.4, P<0.024, two-way ANOVA, for juvenile snails, grass shrimp, and juvenile fiddler crabs; P<0.002, GLM, for juvenile killifish)
15
Survey of marsh die-off Areas
Three of the ten sites surveyed across scales of southeastern states revealed no trematode infections. Snails at these three sites had the lowest mean shell lengths (Fig. 5). This is
consistent with past observations that only adult snails (> 16mm shell length) are found to harbor trematode infections. Radulation and parasite prevalence data from the seven sites where
16 DISCUSSION
Previous surveys have suggested that Mid-Atlantic Coast populations of L. irrorata do not harbor trematode parasites (Rossiter, 2013) and that infection prevalence rarely exceeds 1% in Southern Atlantic and Gulf Coast salt marshes (Holliman, 1961; Hamilton, 1978; Richard Heard, pers. comm.). The findings of my surveys (current study and unpublished data)
demonstrate that summertime infection prevalence can exceed 10% in some marshes and can be as high as 30%. My experimental treatments encompassed this range in infection prevalence and, therefore, tested the maximum potential of P. acanthus to indirectly affect salt marsh structure and function that we could expect to observe under current natural conditions.
My investigation is one of very few studies to manipulate parasite prevalence in the field and quantify the indirect community-level consequences of parasite-induced behavioral
modifications of their host species (Wood et al 2007). Additionally, my study represents the first experimental demonstration of the ability of parasites to confer ecosystem resistance to
disturbance through behavioral modification of an influential host species. Because I did not account for the effects of predators, which consume infected snails at higher rates than healthy conspecifics, my study likely underestimates the effects of trematode infection in mediating snail grazing impacts.
My results suggest that sub-lethal drought stress conditions interact with grazing snails to produce die-off conditions, consistent with the findings of previous research (Silliman et al., 2005). Additionally, I provide evidence of a trait-mediated trophic cascade in which
17
Spartina aboveground growth, and prevented wholesale die-off of these foundational plants. The
ameliorating effects of parasites on salt marsh structure increased with the incidence of infection, although not always proportionately. In both salted and unsalted treatments, a mere 10%
increase in the prevalence of infection yielded an almost 30% increase in the total length of leaf scars associated with snail grazing. This is likely the result of slightly biased sampling, which did not account for trematode-induced changes to snail locomotion. Infected snails did not climb as high as uninfected conspecifics and their grazing activities were confined mainly to plant bases, dead stems, or the marsh substrate (Fig. 4). At least some of the differences observed in the intensity of snail grazing likely reflect our method of measuring radulations on the topmost unfurled leaves of individual plants where infected snails were less likely to be found feeding. These disparities were not as apparent with regard to plot aboveground biomass, where increases in plant biomass scaled roughly in proportion to parasite prevalence.
Plots with uninfected snails were characterized by a nearly complete loss of marsh structure and a loss or diminishment of multiple functions. Primary production, infiltration, decomposition, and nursery habitat functions were all enhanced by parasite facilitation of salt marsh structure, in some instances maintaining functionality near levels observed in ungrazed control plots (Figures 3.1 – 3.4). Increasing infection prevalence consistently yielded increases in the performance level of each function measured, whereas salt addition indirectly decreased the level of all measured ecosystem functions by stimulating grazers and stunting the growth of foundational plants. Because this is only the second documentation of parasites indirectly modifying ecosystem functions (see Sato et al., 2012) our results suggest some new systems in which parasites may be functionally influential. Parasites appear to indirectly stimulate
18
juvenile fiddler crabs. This represents the first evidence of parasites indirectly modifying hydrology and prompts new questions about the roles played by parasites in important geophysical processes.
Increased infection prevalence along die-off boarders in surveyed marshes was
significantly related to a decrease in the average length of radulations, consistent with the results of our field experiment. Our survey suggests that die-off borders may be infection hotspots, where increased prevalence reduces the magnitude of local Littoraria grazing effects and preserves marsh integrity. This pattern is likely driven by the increased usage of these areas by foraging marsh birds. Bird droppings, which potentially harbor trematode eggs, were frequently noted inside sample plots along die-off boarders in all surveyed marshes, while droppings were rarely found within healthy marsh plots. Moreover, direct observations in the field indicated that birds, including known final hosts of P. acanthus, such as rails and wading birds, were found in greater abundance around die-off borders than in healthy marsh areas. This is consistent with previous observations where trematode infections were much more abundant in close proximity to clapper rail nests and roosting areas (Heard, 1970; Morton, unpublished data). The existence of high infection rates at die-off borders would represent a negative potential feedback that could suppress the expansion of such borders, even in the absence of predators. It has yet to be
experimentally determined, however, whether high incidence of infection along die-off borders is the result of elevated infection rates due to an abundance of bird final hosts or a diminished abundance of predators that consume infected snails at much higher rates.
19
2002; Wood et al. 2007; Hernandes and Sukhdeo, 2008a; Libersat et al. 2009; Sato et al., 2012). While the ubiquity of parasites in natural systems is well-documented, the effects of many parasites on the behavior of their hosts, and how such changes to host phenotype affect ecosystem properties, are poorly understood. Parasites may influence aspects of resilience in many ecosystems by modifying the behavior of influential hosts, dampening consumer effects, or facilitating processes that contribute to diversity (such as predation). In order to better understand how natural systems will respond to global scale disturbances, it is important that the roles played by parasites in aspects of ecosystem resilience are better elucidated. Additionally, the potential for parasites to have positive effects on ecosystem stability, as illustrated by the current study, may provide greater impetus to conserve certain parasitic fauna and the hosts which they depend on.
20
FIGURE 1.1 - The effect of parasite prevalence on L. irrorata radulations on S. alterniflora. Probability values are given for a two-way ANOVA testing for main and interactive effects. P = main effect of parasite prevalence, and S = main effect of salt addition. Data are means and SE; n=8 treatment replicates.
0
2
4
6
8
10
12
14
16
18
20
0% infected
10% infected 30% infected
no snails
R
ad
u
latio
n
len
g
th
(
cm
)
/ total
leaf
leng
th
(cm
)
/
stem
no salt
salt
21
FIGURE 1.2 - The effect of parasite prevalence on S. alterniflora aboveground biomass. Probability values are given for a two-way ANOVA testing for main and interactive effects. P = main effect of parasite prevalence, and S = main effect of salt addition. Data are means and SE; n=8 treatment replicates.
0
50
100
150
200
250
300
0% infected
10% infected 30% infected
no snails
Ab
o
v
eg
rou
n
d
b
io
m
ass
(g d
ry
m
ass
/
0
.70
-m
²)
no salt
salt
22
FIGURE 1.3 - The effect of parasite prevalence on S. alterniflora live stem density. Probability values are given for a two-way ANOVA testing for main and interactive effects. P = main effect of parasite prevalence, and S = main effect of salt addition. Data are means and SE; n=8 treatment replicates.
-100
-90
-80
-70
-60
-50
-40
-30
-20
-10
0
0% infected
10% infected 30% infected
no snails
Ch
an
g
e in liv
e stem
d
en
sity
(stem
s
/ 0.7
0
m
²)
no salt
salt
23
FIGURE 1.4 - The effect of parasite prevalence on S. alterniflora live stem height. Probability values are given for a two-way ANOVA testing for main and interactive effects. P = main effect of parasite prevalence, and S = main effect of salt addition. Data are means and SE; n=8 treatment replicates.
-20
-10
0
10
20
30
40
50
0% infected
10% infected 30% infected
no snails
Ch
an
g
e in stem
h
eig
h
t
(cm
)
no salt
salt
a
b
c
c
d
e
MS
F
P
P
6347.4 357.9 <0.001
S
710.5 40.06 <0.001
P × S
0.9 0.052
0.821
24
FIGURE 2 - The average proportion of infected and uninfected snails above the mean high water line (MHWL) in each plot.
0 0.1 0.2 0.3 0.4 0.5 0.6 0.7 0.8 0.9
uninfected infected
P
rop
or
tion
of
sn
ail
s
ab
ove
M
HWL
at hi
gh
tid
25
FIGURE 3.1 - The effect of parasite prevalence on S. alterniflora net primary production. Probability values are given for a two-way ANOVA testing for main and interactive effects. P = main effect of parasite prevalence, and S = main effect of salt addition. Data are means and SE; n=8 treatment replicates.
-50
0
50
100
150
200
250
300
0% infected
10% infected 30% infected
no snails
Net p
rim
ar
y
p
rod
u
ction
(g
d
ry
m
ass
/
0
.7 m
²)
no salt
salt
26
FIGURE 3.2 - The effect of parasite prevalence on infiltration rate. Probability values are given for a two-way ANOVA testing for main and interactive effects. P = main effect of parasite prevalence, and S = main effect of salt addition. Data are means and SE; n=5 treatment replicates.
0
0.5
1
1.5
2
2.5
3
3.5
4
4.5
5
0% infected
10% infected 30% infected
no snails
Inf
iltration
r
ate
(L
/
h
r)
no salt
salt
a
a
a
a
b
27
FIGURE 3.3 - The effect of parasite prevalence on decomposition rate. Probability values are given for a two-way ANOVA testing for main and interactive effects. P = main effect of parasite prevalence, and S = main effect of salt addition. Data are means and SE; n=8 treatment replicates.
0
1
2
3
4
5
6
7
8
0% infected
10% infected
30% infected
no snails
Decom
p
o
sitio
n
rate (g
/ m
o
n
th
)
no salt
salt
a
a
a
a
b
c
MS
F
P
P
14.34
312.6 <0.0001
S
3.21
69.9 <0.0001
28
FIGURE 4.1 - The effect of parasite prevalence on the abundance of juvenile L. irrorata. Probability values are given for a two-way ANOVA testing for main and interactive effects. P = main effect of parasite prevalence, and S = main effect of salt addition. Data are means and SE; n=8 treatment replicates.
0
2
4
6
8
10
12
14
0% infected
10% infected 30% infected
no snails
Ju
v
en
ile
L.
irr
o
rr
a
ta
(ind
iv
id
u
als / 0.7
-m
²)
no salt
salt
29
FIGURE 4.2 - The effect of parasite prevalence on the abundance of juvenile fiddler crab burrows. Probability values are given for a two-way ANOVA testing for main and interactive effects. P = main effect of parasite prevalence, and S = main effect of salt addition. Data are means and SE; n=8 treatment replicates.
0
5
10
15
20
25
30
35
40
45
50
0% infected
10% infected 30% infected
no snails
Ju
v
en
ile f
id
d
ler
crab
b
u
rr
o
ws (bu
rr
o
ws
/
0
.7
-m
²)
no salt
salt
30
FIGURE 4.3 - The effect of parasite prevalence on the abundance of grass shrimp. Probability values are given for a two-way ANOVA testing for main and interactive effects. P = main effect of parasite prevalence, and S = main effect of salt addition. Data are means and SE; n=8 treatment replicates.
0
2
4
6
8
10
12
14
16
18
0% infected
10% infected 30% infected
no snails
Grass
Sh
rim
p
(ind
iv
id
u
als
/
0
.7
-m
²)
no salt
salt
31
FIGURE 4.4 - The effect of parasite prevalence on the abundance of juvenile killifish.. Probability values are given for a GLM testing for main and interactive effects. P = main effect of parasite prevalence, and S = main effect of salt addition. Data are means and SE; n=8 treatment replicates.
0
0.2
0.4
0.6
0.8
1
1.2
1.4
1.6
1.8
0% infected
10% infected 30% infected
no snails
Fun
d
u
lu
s
sp
p
.
(ind
iv
id
u
als / 0.7
-m
²)
32
33
FIGURE 6 - Least Squares linear relationship between trematode infection prevalence and snail grazing intensity (mean radulations per leaf length corrected for snail density) along die-off boarders for seven marshes along the eastern US coast.
y = -0.0018x + 0.0271
R² = 0.3089
0
0.01
0.02
0.03
0.04
0.05
0.06
0
3
6
9
12
Rad
u
latio
n
s
(cm
)
/
to
tal leaf len
g
th
(
cm
)
•
sn
ail den
sity
Infection prevalence (%)
Hoop Pole Creek, NC Masonboro Island, NC Charleston, SC
34
LITERATURE CITED
Angelini, C., & Silliman, B. R. (2012). Patch size-dependent community recovery after massive disturbance. Ecology, 93(1), 101–110.
Bertness, M. D., Brisson, C. P., Coverdale, T. C., Bevil, M. C., Crotty, S. M., & Suglia, E. R. (2014). Experimental predator removal causes rapid salt marsh die-off. Ecology Letters,
17(7), 830–835.
Carpenter, S. R., Kitchell, J. F., & Hodgson, J. R. (1985). Fish predation and herbivory can regulate lake ecosystems. BioScience, 35(10), 634–639.
Combes, C. (1996). Parasites, biodiversity, and ecosystem stability. Biodiversity &
Conservation, 5(8), 953-962.
Coverdale, T. C., Brisson, C. P., Young, E. W., Yin, S. F., Donnelly, J. P., & Bertness, M. D. (2014). Indirect human impacts reverse centuries of carbon sequestration and salt marsh accretion. PLoS ONE, 9(3), 1–7.
Curtis, L. A. (1985). The influence of sex and trematode parasites on carrion response of the estuarine snail Ilyanassa obsoleta. Biological Bulletin, 169(2), 377–390.
Dobson, A. & Crawley, M. (1994). Pathogens and the structure of plant communities. Trends in
Ecology & Evolution (Personal Edition), 9(10), 393–398.
Dobson, A., Lafferty, K. D., Kuris, A. M., Hechinger, R. F., & Jetz, W. (2008). Colloquium paper: homage to Linnaeus: how many parasites? How many hosts? Proceedings of the
National Academy of Sciences of the United States of America, 105 Suppl 1, 11482–11489.
Estes J.A. & Palmisano J.F. (1974). Sea otters: their role in structuring nearshore communities.
Science, 185(4156), 1058–60.
Estes, J. A, Terborgh, J., Brashares, J. S., Power, M. E., Berger, J., Bond, W. J., & Wardle, D. a. (2011). Trophic downgrading of planet Earth. Science (New York, N.Y.), 333(6040), 301– 306.
Finkes, L. K., Cady, A. B., Mulroy, J. C., Clay, K., & Rudgers, J. a. (2006). Plant-fungus
mutualism affects spider composition in successional fields. Ecology Letters, 9(3), 347–356. Graça, M. A., Newell, S. Y., & Kneib, R. T. (2000). Grazing rates of organic matter and living
fungal biomass of decaying Spartina alterniflora by three species of salt-marsh invertebrates. Marine Biology, 136(2), 281–289.
35
Hamilton, P. V. (1978). Intertidal distribution and long-term movements of Littorina irrorata
(Mollusca: Gastropoda). Marine Biology, 46(1), 49–58.
Hemond, H. F., W. K. Nuttle, R. W. Burke, & K. D. Stolzenbach (1984). Surface infiltration in salt marshes: Theory, measurement, and biogeochemical implications. Water Resour. Res., 20(5), 591–600.
Hildebrand, S.F., and W.S. Schroeder (1928). Fishes of Chesapeake Bay. Bulletin of the U.S.
Bureau of Fisheries, 43(1), 1-336.
Howes, B. L., Howarth, R. W., Teal, J. M., & Valiela, I. (1981). Oxidation-reduction potentials in a salt marsh: Spatial patterns and interactions with primary production. Limnology and
Oceanography, 26(2), 350–360.
Heard, R. W. III (2011). Parasites of the Clapper Rail, Rallus longirostris Boddaert. Some trernatodes and cestodes from Spartina marshes of the Eastern United States. Proc. Helm.
Soc. Wash., 37(2), 147–153.
Intergovernmental Panel on Climate Change (2014). Climate change 2014: Impacts, adaptation, and vulnerability, (March), 1–44.
Johnson, A.I. (1963). A field method for the measurement of infiltration. U.S. Geol. Surv., Water
Supply Pap. 1544–F (1963)
Jones, C. G., Lawton, J. H., & Shachak, M. (1994). Organisms as ecosystem engineers. Oikos, 69, 373–386.
Jones, K. E., Patel, N. G., Levy, M. a, Storeygard, A., Balk, D., Gittleman, J. L., & Daszak, P. (2008). Global trends in emerging infectious diseases. Nature, 451(7181), 990–993. Kneib, R.T. 1987. Predation risk and use of intertidal habitats by young fishes and shrimp.
Ecology, 68, 379–386.
Kohler, S. L., & Wiley, M. J. (1997). Pathogen outbreaks reveal large-scale effects of competition in stream communities. Ecology, 78(7), 2164–2176.
Kuris, A. M., Hechinger, R. F., Shaw, J. C., Whitney, K. L., Aguirre-Macedo, L., Boch, C. A., Lafferty, K. D. (2008). Ecosystem energetic implications of parasite and free-living biomass in three estuaries. Nature, 454(7203), 515–518.
Lafferty, K. D., & Kimo Morris, a. (1996). Altered behavior of parasitized killifish increases susceptibility to predation by bird final hosts. Ecology, 77(5), 1390–1397.
36
Mittlebach, G. G., Turner, A. M., Hall, D. J., Rettig, & J. E., Osenberg, C. W. (1995). Perturbation and resilience a long term whole lake study of predator extinction and reintroduction. Ecology, 70(8), 2347-2360.
Myers, R. A., Baum, J. K., Shepherd, T. D., Powers, S. P., & Peterson, C. H. (2007). Cascading effects of the loss of apex predatory sharks from a coastal ocean. Science, 315 (5820), 1846–1850.
Omacini, M., Chaneton, E. J., Ghersa, C. M., & Müller, C. B. (2001). Symbiotic fungal endophytes control insect host-parasite interaction webs. Nature, 409(6816), 78–81. Rosenblatt, A., Heithaus, M., Mather, M., Matich, P., Nifong, J., Ripple, W., & Silliman, B.
(2013). The roles of large top predators in coastal ecosystems: New insights from long term ecological research. Oceanography, 26(3), 156–167.
Rossiter, W. (2013). Current opinions: Zeros in host-parasite food webs: Are they real?
International Journal for Parasitology: Parasites and Wildlife, 2(1), 228–234.
Sala, E. (2006). Top predators provide insurance against climate change. Trends in Ecology and
Evolution, 21(9), 479–480.
Sato, T., Egusa, T., Fukushima, K., Oda, T., Ohte, N., Tokuchi, N., Lafferty, K. D. (2012). Nematomorph parasites indirectly alter the food web and ecosystem function of streams through behavioral manipulation of their cricket hosts. Ecology Letters, 15(8), 786–793. Seager, R., Tzanova, A., and Nakamura, J. (2009). Drought in the Southeastern United States:
Causes, variability over the last millennium, and the potential for future hydroclimate change. J. Climate, 22(19), 5021–5045.
Silliman, B. R., & Bertness, M. D. (2002). A trophic cascade regulates salt marsh primary production. Proceedings of the National Academy of Sciences of the United States of
America, 99(16), 10500–10505.
Silliman, B. R., Layman, C. A., Geyer, K., & Zieman, J.C. (2004). Predation by the black-clawed mud crab, Panopeus herbstii, in Mid-Atlantic salt marshes: Further evidence for top-down control of marsh grass production. Estuaries, 27(2), 188–196.
Silliman, B. R., Koppel, J. Van De, Bertness, M. D., Stanton, L. E., & Mendelssohn, I. A. (2015). Drought, snails, and large-scale die-off of southern U.S. salt marshes. Science, 310, 1803-1806.
Silliman, B. R., McCoy, M. W., Angelini, C., Holt, R. D., Griffin, J. N., & van de Koppel, J. (2013). Consumer fronts, global change, and runaway collapse in ecosystems. Annual
37
Trussell, G. C., Ewanchuk, P. J., Bertness, M. D., & Silliman, B. R. (2004). Trophic cascades in rocky shore tide pools: Distinguishing lethal and nonlethal effects. Oecologia, 139(3), 427– 432.
Wallach, A. D., Johnson, C. N., Ritchie, E. G., & O’Neill, A. J. (2010). Predator control promotes invasive dominated ecological states. Ecology Letters, 13(8), 1008–1018. Wilmers, C. C., & Post, E. (2006). Predicting the influence of wolf-provided carrion on
scavenger community dynamics under climate change scenarios. Global Change Biology,
12(2), 403–409.
Wilmers, C. C., Post, E., Peterson, R. O., & Vucetich, J. a. (2006). Predator disease out-break modulates top-down, bottom-up and climatic effects on herbivore population dynamics.
Ecology Letters, 9(4), 383–389.
Wood, C. L., Byers, J. E., Cottingham, K. L., Altman, I., Donahue, M. J., & Blakeslee, A. M. H. (2007). Parasites alter community structure. Proceedings of the National Academy of