ARTICLE
Considerable gains in neonatal survival have been achieved in well-resourced countries, with almost all their live births surviving the neonatal period.[1] The same is not true in less-resourced countries. In particular, in sub-Saharan Africa (SSA) the burden of childhood mortality is highest during the neonatal period, with over 40% of under-five deaths occurring in the first month of life.[2] Although general under-five mortality in the region has declined notably, there has not been a comparable decrease in neonatal mortality.[3]
Public health investments such as immunisation programmes have been instituted in various countries to improve child health. Despite this, the neonatal mortality rate is estimated at 31 deaths per 1 000 live births in SSA, compared with 4 per 1 000 across Europe and North America.[4] Some of the risk factors of neonatal mortality in SSA include poor hygiene practice, poor care for babies of low birth weight, late initiation of breastfeeding, children’s biodemographic characteristics and gaps in healthcare coverage.[5-8] Studies have also identified biological and clinical factors as causes of neonatal death in the region.[8-11]
Many of the causes of neonatal deaths, such as diarrhoea, pneumonia and malaria,[12] are preventable or curable through timely low-cost healthcare measures. Also, many childhood illnesses and complications at child birth can be identified during antenatal visits. However, we hypothesised that women with a low or poor position in the household are less equipped to implement the necessary healthcare measures to increase the survival of their newborns. The issue of women’s position in the marital dyad has become an important point on policy agendas. While studies have established a relationship between women’s household position and factors such as women’s autonomy, household decision-making, spousal communication,[13] maternal healthcare utilisation,[14,15] contraceptive use,[16] intrahousehold bargaining and resource allocation,[17] there is a paucity of evidence on how the position influences neonatal mortality. This study therefore examined the effects of women’s
position in the household on neonatal survival and the associated pathways in selected countries in SSA.
Methods
Data source
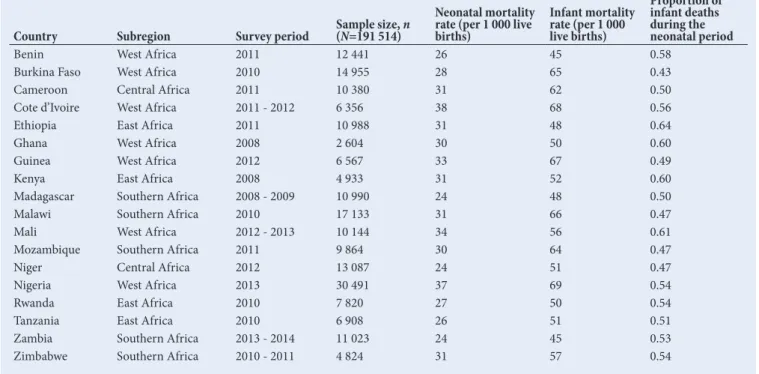
Data from 18 countries in SSA, selected for their high levels of neonatal mortality, were used (Table 1). The selected countries represent the four regional SSA blocs.
Demographic and health survey (DHS) data of the selected countries as archived in the Integrated Public Use Microdata Series (IPUMS) database were obtained with permission from IPUMS International.[18] Data sets obtained from children’s files were used because they contain information on birth history of women of reproductive age. Table 1 shows the period of the applicable surveys. Data from the 18 countries were pooled into a single data set.
To collect demographic and heath data across countries, the DHS programme uses stratified multistage cluster sampling with enumeration areas designed for the census exercises of different countries as a proxy for cluster or primary sampling units. The sampling process involved random selection of eligible women, aged 15 - 49 years, from the sampled households.
The current analysis spanned data from a total of 191 514 children, pooled into a single data set, with sample sizes for individual countries ranging from 2 604 children (Ghana) to 30 491 (Nigeria). Analyses were restricted to children of married or cohabiting women (born within 5 years before the survey) in order to properly explore women’s household position relative to that of their partners in the conjugal dyad.
Definition and measurement of variables
Outcome measure
The outcome variable in this study was neonatal mortality, measured as the duration of survival since birth (in days) and, as a time-to-Background. The burden of under-five mortality in sub-Saharan Africa (SSA) is highest during the neonatal period, with over 40% of cases occurring during the first month of life. There is a paucity of evidence on the influence of women’s household position on neonatal survival in SSA.
Objective. To assess the influence of women’s household position on neonatal survival in SSA.
Methods. We analysed pooled data (N=191 514) from the demographic and health surveys of 18 countries in SSA. Cox proportional hazards regression analysis was used to explore statistically significant relationships.
Results. Findings support the hypothesis that a low position of a woman in the household is significantly associated with high neonatal mortality, as children of women who experienced a high position in the household had a significantly lower risk of neonatal mortality (hazard ratio 0.85, confidence interval 0.76 - 0.95; p<0.05) than those whose mothers experienced a low household position.
Conclusion. This study concludes that improving women’s household position through enhanced socioeconomic status could substantially contribute to reducing neonatal mortality in SSA.
S Afr J Child Health 2019;13(1):17-22. DOI:10.7196/SAJCH.2019.v13i1.1531
Women’s position in the household as a determinant
of neonatal mortality in sub-Saharan Africa
S A Adedini,
1,2PhD; J O Akinyemi,
2,3PhD; S O Wandera,
2,4PhD
1Demography and Social Statistics Department, Faculty of Social Sciences, Obafemi Awolowo University, Ile-Ife, Nigeria
2 Demography and Population Studies Programme, Schools of Public Health and Social Sciences, University of the Witwatersrand, Johannesburg, South Africa
3Department of Epidemiology and Medical Statistics, Faculty of Public Health, University of Ibadan, Ibadan, Nigeria 4 Department of Population Studies, School of Statistics and Planning, Makerere University, Kampala, Uganda
Corresponding author: S A Adedini ([email protected])
ARTICLE
event phenomenon, was modelled as the probability of survival during the first 28 days of life. Children who died before completing the first month of life were regarded as the cases and their survival time was noted as their age at death in days. Conversely, children who survived the first month of life were categorised as non-cases. The survival time was censored at 28 day for children who were alive at the time of survey.
Independent variable
The main independent variable in this study was women’s household position. Based on theoretical insight from reviewed literature, we defined women’s household position as the extent of a woman’s autonomy and her involvement in household decision-making.[13] We used a proxy measure of different dimensions of decision-making in a marital dyad. Freedom and active involvement in decision-making in the conjugal unit were considered indicative of a woman having a high status and a good social position.
We measured women’s household position according to the six dimensions of a woman’s involvement in making decisions in respect of: (1) large household purchases; (2) visits to family and friends; (3) spending her own earnings; (4) her own health; (5) food to be cooked, and (6) spending her partner’s earnings. We generated an overall index, which was a composite score of the number of decisions a woman participated in, either alone or with her partner. The composite scores ranged from 1 to 6. Respondents with scores between 1 and 3 were considered to have a low position in the household, whereas those with scores >3 were categorised as having a high position.
Control variables
Other variables previously established in the literature as important predictors of childhood survival were selected as control variables in our study (Table 2). These included child-relevant variables such as sex, self-rated birth size, birth order, birth interval and number of births. The selected maternal characteristics were: maternal age; maternal education; religion; wealth index; and place of residence. Selected maternity variables included place of delivery and antenatal care.
Statistical analysis
Statistical analysis was performed at three levels. At the univariate level, we presented the proportional distribution of study samples according to the selected independent variables. The bivariate analysis assessed the proportional distribution according to sample characteristics. At the multivariate level, Cox proportional hazard models were fitted to determine the effects of a woman’s household position on neonatal mortality while adjusting for the selected control variables.
A total of five Cox hazard models were fitted. Model 1 was unadjusted. In Model 2, we adjusted for the effects of child-relevant variables, while in Model 3 we adjusted for the effects of maternal characteristics. Model 4 examined the simultaneous effects of a woman’s household position and maternity characteristics on neonatal mortality. The full model (Model 5) incorporated all the selected covariates. Weighting factors provided by the DHS programme were applied to account for the complex nature of the survey, which ensured the national representativeness of the data at country level.
All statistical analyses were conducted using Stata (version 12.0) (StataCorp, USA). Measures of association are presented as hazard ratios (HRs) with a 95% confidence interval (CI), at a significance level of p<0.05.
Ethical considerations
Secondary data sets were used in this study and all personal identifiers were anonymised by the implementing organisations. Permission for use of the IPUMS-DHS data sets was granted by IPUMS International. Ethical permission to conduct the initial surveys was granted to ICF International by the Ethics Committee of the Opinion Research Corporation (USA) and the implementing partners of the relevant countries.
Results
Neonatal mortality rates
Table 1 presents the neonatal mortality rates compared with infant Table 1. Relevant demographic and health survey data from countries included in the analysis
Country Subregion Survey period Sample size, n (N=191 514)
Neonatal mortality rate (per 1 000 live births)
Infant mortality rate (per 1 000 live births)
Proportion of infant deaths during the neonatal period
Benin West Africa 2011 12 441 26 45 0.58
Burkina Faso West Africa 2010 14 955 28 65 0.43
Cameroon Central Africa 2011 10 380 31 62 0.50
Cote d’Ivoire West Africa 2011 - 2012 6 356 38 68 0.56
Ethiopia East Africa 2011 10 988 31 48 0.64
Ghana West Africa 2008 2 604 30 50 0.60
Guinea West Africa 2012 6 567 33 67 0.49
Kenya East Africa 2008 4 933 31 52 0.60
Madagascar Southern Africa 2008 - 2009 10 990 24 48 0.50
Malawi Southern Africa 2010 17 133 31 66 0.47
Mali West Africa 2012 - 2013 10 144 34 56 0.61
Mozambique Southern Africa 2011 9 864 30 64 0.47
Niger Central Africa 2012 13 087 24 51 0.47
Nigeria West Africa 2013 30 491 37 69 0.54
Rwanda East Africa 2010 7 820 27 50 0.54
Tanzania East Africa 2010 6 908 26 51 0.51
Zambia Southern Africa 2013 - 2014 11 023 24 45 0.53
ARTICLE
mortality rates in the selected countries. Neonatal mortality rates were calculated to be >30 per 1 000 live births in 11 of the 18 included countries.
Socioeconomic and demographic characteristics of
study samples
The distribution of study samples according to socioeconomic Table 2. Percentage distribution of selected child and maternal characteristics according to women’s household position, as
obtained from demographic and health survey data across 18 sub-Saharan African countries
Characteristics Total sample,* % (n) Low household position, % High household position, %
Child’s sex
Male 50.5 (41 768) 50.3 50.7
Female 49.5 (40 862) 49.8 49.3
Birth order†
First birth 16.4 (13 544) 15.5 16.9
Second to fourth 48.4 (40 014) 45.6 49.9
Fifth or later 35.2 (29 072) 38.9 33.3
Birth interval, months†
First birth 16.6 (13 714) 15.7 17.1
<24 14.8 (12 218) 16.6 14.0
24 - 35 30.3 (25 008) 32.4 29.1
>35 38.4 (31 690) 35.5 39.8
Birth size (as rated by mother)†
Large 39.9 (32 279) 40.8 39.5
Average 45.1 (36 480) 43.2 46.2
Small 14.9 (12 076) 16.1 14.4
Number of births
Singleton 96.1 (79 419) 96.3 96.0
Multiple 3.9 (3 211) 3.7 4.0
Maternal age, years†
15 - 24 21.7 (17 948) 24.1 20.5
25 - 34 52.3 (43 192) 50.7 53.1
≥35 26.0 (21 490) 25.2 26.4
Maternal education†
None 44.2 (36 502) 57.4 37.3
Primary 33.5 (27 692) 28.5 36.1
Secondary or higher 22.3 (18 421) 14.1 26.6
Religion‡
Islam 32.9 (27 143) 50.2 23.8
Christianity 55.3 (45 701) 38.0 64.3
Others§ 11.8 (9 786) 11.8 11.9
Wealth index†¶
Poorest 19.9 (16 446) 23.9 17.8
Poorer 20.3 (16 807) 24.0 18.4
Middle 19.7 (16 282) 20.1 19.5
Richer 20.2 (16 724) 18.6 21.1
Richest 19.8 (16 371) 13.5 23.1
Place of residence†
Urban 30.9 (25 516) 24.3 34.3
Rural 69.1 (57 114) 75.7 65.7
Place of delivery†
Home 42.2 (34 863) 51.6 37.3
Health facility 55.3 (45 653) 45.1 60.5
Other 2.6 (2 114) 3.3 2.2
Antenatal care†
No 42.4 (35 065) 48.5 39.3
Yes 57.6 (47 565) 51.5 60.7
*N=82 630 owing to cases with missing values being excluded. †p<0.05, ‡p<0.01
ARTICLE
and demographic characteristics is presented in Table 2. A large proportion of the study samples were children who were born second, third or fourth in a family (48.4%) and more than 35 months after the previous child (38.4%), had an average size at birth (45.1%) and were singletons (96.1%). The majority of the study samples were children of mothers aged 25 - 34 years (52.3%), without any formal education (44.2%), mothers who associated with Christianity (55.3%) and those who lived in rural areas (69.1%). Furthermore, 42.4% of the sampled mothers did not receive antenatal care and 44.8% of the children were not delivered at a health facility.
Table 2 further expresses the selected characteristics according to women’s household position. In the majority of cases, women without formal education (57.4%), those who ascribed to the Islamic faith (50.2%), those from poor households (24.0%), and those who lived in rural areas (75.7%) or delivered their children at home (51.6%) had a low position in the household.
Women’s household position, background
characteristics and neonatal mortality: A survival
analysis
Model 1 showed that a high position in the conjugal unit protected against neonatal mortality (HR 0.84; CI 0.76 - 0.93) (Table 3). The model also revealed a lower neonatal mortality risk among female children (HR 0.71; CI 0.67 - 0.76), those born second, third or fourth in the family (HR 0.65; CI 0.60 - 0.71), those born more than 35 months after the previous child (HR 0.55; CI 0.50 - 60), and whose mothers were between 25 and 34 years of age (HR 0.74, CI 0.68 - 0.80), had secondary or higher education (HR 0.88; CI 0.79 - 0.98), came from the highest household wealth category (HR 0.85; CI 0.75 - 0.96) and had received antenatal care (HR 0.42; CI 0.40 - 0.45). Model 1 further identified significantly elevated hazards of neonatal mortality for children who were born <24 months after the previous child (HR 1.12; CI 1.02 - 1.24), were small at birth (HR 2.05; CI 1.86 - 2.25) and whose families resided in rural areas (HR 1.11; CI 1.02 - 1.21).
Model 2 showed that a woman’s high position in the household continued to protect against neonatal mortality (HR 0.82; CI 0.74 - 0.92) (Table 3), even when child-relevant variables were adjusted for. Similarly, being a female child and born after a longer interval remained significantly associated with a lower risk of neonatal death compared with children in the reference categories (p<0.05).
Model 3 confirmed that a high position in the household protected against neonatal mortality (HR 0.87; CI 0.78 - 0.97). It also indicated intermediate maternal age, secondary or higher education and a high wealth index as protective against neonatal mortality in the selected countries.
The effect of a woman’s household position on neonatal survival decreased when the model was adjusted for only maternity care variables (Model 4). However, Model 5, which adjusted for the effects of all the selected variables, indicated a woman’s household position as a significant predictor of neonatal mortality (HR 0.85; CI 0.76 - 0.95). In this model, being a female child, being born after a longer birth interval and the mother’s uptake of antenatal care were associated with a protective effect against neonatal mortality. Conversely, a higher birth order, small birth size and multiple births were associated with significantly higher neonatal mortality risk than the reference categories.
Discussion
This study provides interesting insights regarding the influence of women’s household position on neonatal mortality in SSA. Neonatal mortality currently accounts for the largest proportion of under-five mortality in the region[19] and understanding the associated risk factors is important if the sustainable development goal (SDG) for child health is to be achieved.
Previous studies have established that women’s position in the household has a significant effect on maternal healthcare utilisation,[14,15] child health,[20] fertility intention,[21] and contraceptive use.[16] Our study therefore contributes to the existing literature by examining the relationship between women’s household position and neonatal mortality. We found that children of mothers with a low household position had a higher risk of dying in the first month of life. Adjusted models consistently indicated a significant association between low household position and high risk of neonatal mortality. There are a number of plausible explanations for this finding. First, results from our descriptive analysis indicate that women with low household positions were more likely not to have formal education and to come from rural areas or poor households. In these circumstances, women have limited socioeconomic resources and hence lack capability to adequately invest in their children’s health.
Second, women with a low household position tend to participate less in household decision-making, have limited spousal communication and are unable to take prompt decisions regarding their own health and that of their children. In some cases, women cannot seek medical attention until permission is sought from their partners.[15] Male dominance and women’s subjection to spatial constraints remain issues of concern in many SSA countries.[22]
Third, most SSA countries have patriarchal societies[22] and the problem of gender inequality appears to be worsened by women’s low socioeconomic position. As a result, many women have limited autonomy and choices. This has implications for seeking healthcare. It has been established that most maternal and newborn deaths occurring within 24 hours of hospital admission are due to a delay in seeking, reaching or accessing healthcare services.[23] Delays in seeking care, late referral or poor quality of care remain issues of concern in many SSA countries. Moreover, limited uptake of antenatal care was established as a major contributor to high neonatal mortality in the selected countries in our study. Our findings suggest that the majority of women could not access quality maternity care. We contend that women who are socioeconomically empowered would invariably be able to afford quality maternity care at facilities that offer lifesaving services for newborns.
In addition, this study revealed other important determinants of neonatal mortality in the selected countries. For example, children who are small at birth, have a higher birth order and of multiple births had significantly higher risks of neonatal mortality, and thus require special care and attention to increase their survival chances.
Study limitations
This study has some limitations. First, using indicators of women’s involvement in household decision-making as proxy measures for household position may have introduced some bias. Second, simple binary categorisations such as high or low positions may not accurately describe the spousal or familial relationship. Third, excluding unmarried or single women may have biased the estimates because both categories are likely to be associated with a low household position. Cause–effect relationships also could not be explored in this study. Despite these limitations, our study contributes to the literature by highlighting the need for enhancing women’s household position as part of strategies to reduce neonatal mortality in SSA.
Conclusion
ARTICLE
Table 3. Cox proportional hazard model examining the effects of women’s household position and selected control variables on neonatal mortality
Characteristics
Model 1: Unadjusted, HR (95% CI)
Model 2: Adjusted for child-relevant variables, HR (95% CI)
Model 3: Adjusted for maternal variables, HR (95% CI)
Model 4: Adjusted for maternity characteristics, HR (95% CI)
Model 5: All variables adjusted for, HR (95% CI) Women’s household position
Low 1.0 1.0 1.0 1.0 1.0
High 0.84* (0.76 - 0.93) 0.82* (0.74 - 0.92) 0.87* (0.78 - 0.97) 0.91 (0.82 - 1.01) 0.85* (0.76 - 0.95) Child’s sex
Male 1.0 1.0 - - 1.0
Female 0.71* (0.67 - 0.76) 0.76* (0.68 - 0.84) - - 0.76* (0.69 - 0.85)
Birth order
First birth 1.0 1.0 - - 1.0
Second to fourth 0.65* (0.60 - 0.71) 1.14 (0.76 - 1.70) - - 1.59* (1.07 - 2.35)
Fifth or later 0.82* (0.75 - 0.89) 1.39 (0.92 - 2.11) - - 1.77* (1.17 - 2.67)
Birth interval, months
First birth 1.0 1.0 - - 1.0
<24 1.12* (1.02 - 1.24) 1.00 (0.66 - 1.51) - - 0.74 (0.49 - 1.10)
24 - 35 0.59* (0.54 - 0.65) 0.54* (0.35 - 0.81) - - 0.41* (0.26 - 0.61)
>35 0.55* (0.50 - 0.60) 0.50* (0.33 - 0.76) - - 0.40* (0.26 - 0.59)
Self-rated birth size
Large 1.0 1.0 - - 1.0
Average 0.98 (0.90 - 1.07) 0.90 (0.80 - 1.02) - - 0.91 (0.80 - 1.03)
Small 2.05* (1.86 - 2.25) 1.74* (1.51 - 2.01) - - 1.69* (1.47 - 1.96)
Number of births
Singleton 1.0 - - 1.0
Multiple 5.83* (5.26 - 6.46) - - 4.72* (4.02 - 5.54)
Maternal age, years
15 - 24 1.0 1.0 - 1.0
25 - 34 0.74* (0.68 - 0.80) 0.82* (0.73 - 0.94) - 0.88 (0.76 - 1.02)
≥35 0.98 (0.89 - 1.07) 1.08 (0.94 - 1.24) - 1.17 (0.97 - 1.42)
Maternal education
None 1.0 1.0 - 1.0
Primary 0.99 (0.91 - 1.07) 1.08 (0.95 - 1.23) - 1.17* (1.02 - 1.34)
Secondary or higher 0.88* (0.79 - 0.98) 0.82* (0.69 - 0.98) - 0.87 (0.73 - 1.05)
Religion
Christianity 1.0 1.0 - 1.0
Islam 0.88* (0.81 - 0.96) 0.98 (0.86 - 1.12) - 1.05 (0.91 - 1.21)
Other 0.77* (0.68 - 0.86) 0.68* (0.56 - 0.84) - 0.67*(0.54 - 0.84)
Wealth index
Poorest 1.0 1.0 - 1.0
Poorer 0.96 (0.87 - 1.06) 0.86 (0.74 - 1.00) - 0.85* (0.73 - 1.00)
Middle 0.87* (0.78 - 0.96) 0.83* (0.71 - 0.97) - 0.90 (0.76 - 1.06)
Richer 0.89* (0.79 - 0.99) 0.87 (0.75 - 1.05) - 0.96 (0.80 - 1.16)
Richest 0.85* (0.75 - 0.96) 0.89 (0.73 - 1.09) - 0.99 (0.79 - 1.23)
Place of residence
Rural 1.0 1.0 - 1.0
Urban 1.11* (1.02 - 1.21) 1.02 (0.88 - 1.17) - 1.01 (0.86 - 1.17)
Place of delivery
Home 1.0 - 1.0 1.0
Health facility 0.94 (0.87 - 1.01) - 1.11 (0.99 - 1.24) 0.99 (0.87 - 1.13)
Other 1.85 (1.59 - 2.15) - 2.31* (1.84 - 2.90) 1.21 (0.84 - 1.75)
Antenatal care
No 1.0 - 1.0 1.0
Yes 0.42* (0.40 - 0.45) - 0.44* (0.40 - 0.49) 0.56* (0.50 - 0.62)
*p<0.05.
ARTICLE
women will help to improve women’s status, which can contribute to healthy communication and relationships in the household. Including such measures in strategies for reducing neonatal mortality in the post-2015 development era is recommended.
Acknowledgements. The authors would like to thank ICF International
and its implementing partners for permission to use DHS data of selected countries. The comments of anonymous reviewers are also gratefully acknowledged.
Author contributions. SAA conceptualised the research idea, reviewed the
literature, extracted and analysed the data, and drafted the paper. JOA participated in data analysis and writing up the results. SOW contributed to preparing the study background and discussion of the manuscript. All authors reviewed and approved the final version of the paper.
Funding. None.
Conflicts of interest. None.
1. Alexander GR, Kogan M, Bader D, Carlo W, Allen M, Mor J. US birth weight/ gestational age-specific neonatal mortality: 1995–1997 rates for Whites, Hispanics, and Blacks. Pediatrics 2003;111:e61-e66. https://doi.org/10.1542/ peds.111.1.e61
2. Armstrong CE, Magoma M, Ronsmans C. Magnitude of maternal and neonatal mortality in Tanzania: A systematic review. Int J Gynaecol Obstet 2015;130(1):98-110. https://doi.org/10.1016/j.ijgo.2015.04.021
3. Walker N, Yenokyan G, Friberg IK, Bryce J. Patterns in coverage of maternal, newborn, and child health interventions: Projections of neonatal and under-5 mortality to 2035. Lancet 2015;382:1029-1038. https://doi.org/10.1016/s0140-6736(13)61748-1
4. World Health Organization. Global Health Observatory (GHO) data: Under-five mortality. http://www.who.int/gho/child_health/mortality/mortality_ under_five_text/en/ (accessed 02 April 2016).
5. Adedini SA, Odimegwu C. Polygynous family system, neighbourhood contexts and under-five mortality in sub-Saharan Africa. Dev South Afr 2017;34(6):704-720. https://doi.org/10.1080/0376835x.2017.1310030
6. Arunda M, Emmelin A, Asamoah BO. Effectiveness of antenatal care services in reducing neonatal mortality in Kenya: Analysis of national survey data. Glob Health Action 2017;10(1):1328796. https://doi.org/10.1080/16549716.2017.1328796 7. Avoka JA, Adanu RM, Wombeogo M, Seidu I, Dun-Dery EJ. Maternal and
neonatal characteristics that influence very early neonatal mortality in the Eastern Regional Hospital of Ghana, Koforidua: A retrospective review. BMC Res Notes 2018;11(1):91. https://doi.org/10.1186/s13104-018-3196-x
8. Dandona R, Kochar P, Kumar GA, Dandona L. Use of antiseptic for cord care and its association with neonatal mortality in a population-based assessment in Bihar State, India. BMJ Open 2017;7(1):e012436. https://doi.org/10.1136/ bmjopen-2016-012436
9. Lawn JE, Kinney MV, Black RE, et al. Newborn survival: A multi-country analysis of a decade of change. Health Policy Plan 2012;27 Suppl 3:iii6-iii28. https://doi.org/10.1093/heapol/czs053
10. Mwaniki MK, Talbert AW, Mturi FN, et al. Congenital and neonatal malaria in a rural Kenyan district hospital: An eight-year analysis. Malar J 2010;9:313. https://doi.org/10.1186/1475-2875-9-313
11. Phibbs CS, Lorch SA. Choice of hospital as a source of racial/ethnic disparities in neonatal mortality and morbidity rates. JAMA Pediatr 2018;172(3):221-223. https://doi.org/10.1001/jamapediatrics.2017.4917
12. Jones G, Steketee RW, Black RE, et al. How many child deaths can we prevent this year? Lancet 2003;362:65-71. https://doi.org/10.1016/s0140-6736(03)13811-1 13. Acharya DR, Bell JS, Simkhada P, Van Teijlingen ER, Regmi PR. Women’s
autonomy in household decision-making: A demographic study in Nepal. Reprod Health 2010;7:15. https://doi.org/10.1186/1742-4755-7-15
14. Furuta M, Salway S. Women’s position within the household as a determinant of maternal health care use in Nepal. Int Fam Plan Perspect 2006;32(1):17-27. https://doi.org/10.1363/3201706
15. Adedini SA, Somefun DO, Odimegwu C. Gender inequality and maternal and child healthcare utilization in sub-Saharan Africa. Gender Behav 2014;12(4):5964-5983.
16. Bamiwuye SO, De Wet N, Adedini SA. Linkages between autonomy, poverty and contraceptive use in two sub-Saharan African countries. Etude Popul Afr 2013;27(2):164-173. https://doi.org/10.11564/27-2-438
17. Doss C. Intrahousehold bargaining and resource allocation in developing countries. World Bank Res Obs 2013;28(1):52-78. https://doi.org/10.1093/ wbro/lkt001
18. Heger Boyle E, King M, Sobek M. IPUMS Demographic and Health Surveys, Version 6 [dataset]. IPUMS and ICF, 2018. https://doi.org/10.18128/D080.V6 19. Namazzi G, WaiswaP, Nakakeeto VK, et al. Strengthening health facilities for
maternal and newborn care: Experiences from rural eastern Uganda. Glob Health Action 2015;8:24271. https://doi.org/10.3402/gha.v8.24271
20. Adedini SA, Odimegwu C, Imasiku EN, Ononokpono DN, Ibisomi L. Regional variations in infant and child mortality in Nigeria: A multilevel analysis. J Biosoc Sci 2015;47(2):165-187. https://doi.org/10.1017/s0021932013000734 21. Odimegwu C, Adedini SA. Gender equity and fertility intention in selected
sub-Saharan African countries. Gender Behav 2014;12(4):5843-5862. 22. Wall LL. Dead mothers and injured wives: The social context of maternal
morbidity and mortality among the Hausa of northern Nigeria. Stud Fam Plann 1998;29(4):341-359. https://doi.org/10.2307/172248
23. Bukar M, Kunmanda V, Moruppa JY, Ehalaiye B, Takai UI, Ndonya DN. Maternal mortality at Federal Medical Centre Yola, Adamawa State: A five-year review. Ann Med Health Sci Res 2013;3(4):568-571. https://doi. org/10.4103/2141-9248.122112