- 1 -
Criminal Justice System: Scoping
document
March 2008
UK Centre for the Measurement of
Government Activity
1. Executive
Summary
1.1.
This article is part of an ongoing series of articles on public service output and productivity published by the Office for National Statistics (ONS). It is the first in a series of articles that will explore the inputs, outputs and productivity of the Criminal Justice System (CJS) within the context of National Accounts (NA).1.2.
While significant developments have been made in measuring other areas of public sector productivity such as Education and Health, little work has been done in the area of Criminal Justice.1.3.
Productivity of the CJS is defined as the ratio of CJS outputs to CJS inputs, after separating out the effect of pay and price increases. Ideally, a measure of CJS productivity would take into account the attributable incremental contribution of government spending on the CJS to CJS outcomes such as the reduction of crime and fear of crime. However, not all such improvements, even where they can be measured, are directly attributable to the CJS; they may also depend upon changes in other factors such as the economy, the demographic makeup of the country and the education system. Consequently, proxies for outcomes are used instead: outputs, activities or deflated inputs.1.4.
This article describes current methods for measuring CJS output in NA and reviews a number of options for improving the current methodology in NA. The short term priority is to develop the existing NA methodology for the measurement of CJS outputs, creating or updating a measure of input, output and productivity for each individual CJS agency: Police, Legal Services Commission, Crown Prosecution Service, Criminal Courts and Prison and Probation Services. Recent data developments in the criminal justice arena should allow significant improvements to be made in each area.1.5.
In the longer term it is hoped that progress will be made on two different approaches to the measurement of CJS output and productivity. The first, the Administration of Justice approach, recognises the interdependencies between CJS agencies in contrast to the current method used by ONS. The second, an outcome based model, uses an econometric model of crime to gauge the impact of the CJS and other factors on levels of crime.2
1.6.
This article also recognises the limitations of the existing measuresof CJS inputs and several options for improvement in this area are discussed. Alternative sources of data for the composition of more specific pay and price deflators for labour, goods and services, and capital consumption will be explored. Sources of data for the development of direct measures of labour inputs will be investigated.
3
2. UKCeMGA and the Analysis of Public Service
Productivity
2.1.
In 2003 the National Statistician commissioned Sir Tony Atkinson to conduct an independent review of the measurement of government output in NA. The aim of the review was to establish the future strategic direction for the measurement of government output, productivity and associated price indices in the context of NA. In January 2005 a final set of recommendations was published (Atkinson, 2005). The report included general principles for the measurement of government output as well as specific considerations for four main areas of public spending: Health, Education, Public Order and Safety, and Social Protection - four of the ten broad functions identified in the international Classification of the Functions of Government (COFOG).2.2.
The UK Centre for the Measurement of Government Activity (UKCeMGA) was launched in July 2005 to take forward the Atkinson agenda. One of our primary aims is to develop, with government departments, devolved administrations and other stakeholders, better measures of government input, output and productivity.2.3.
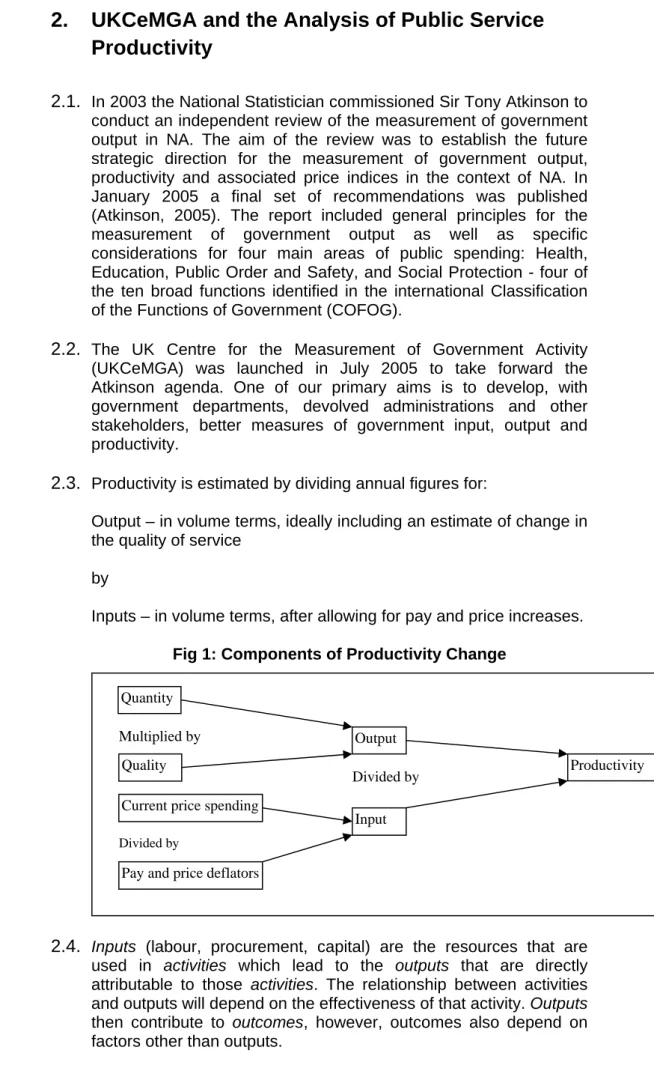
Productivity is estimated by dividing annual figures for:Output – in volume terms, ideally including an estimate of change in the quality of service
by
Inputs – in volume terms, after allowing for pay and price increases.
Fig 1: Components of Productivity Change
Output
Current price spending
Input Productivity Quantity Multiplied by Divided by Divided by
Pay and price deflators Quality
2.4.
Inputs (labour, procurement, capital) are the resources that are used in activities which lead to the outputs that are directly attributable to those activities. The relationship between activities and outputs will depend on the effectiveness of that activity. Outputsthen contribute to outcomes, however, outcomes also depend on factors other than outputs.
4
2.5.
It is important to carefully consider what the ‘unit of output’ for aservice actually is. Ideally, the output of the government sector should be measured in a way that takes account of the attributable incremental contribution of the service to the outcome (Atkinson, 2005). Units of output should be defined in a way that reflects movements in outcomes. This can be complex in areas like criminal justice (and also health care) where the most desirable state of society is ‘very little activity required’. Thus, if good policing could prevent crime, there would be very little need for prosecution, court and offender management services. It is therefore tempting to argue that an increase in an activity like prosecutions or prison nights shows a worsening outcome for society and so should be seen as reduced output, rather than increased. This takes the concern with outcomes rather too far, in this context. If the state of society (and the nature of the statute book) requires arrests, prosecutions and incarceration, then these are genuine outputs, matching the resources spent as inputs. But care is needed to avoid defining outputs in artificial ways (e.g. individual court appearances by prosecutors) which are not end-products. A more productive system might reach ‘conviction or acquittal’ with fewer separate court appearances than an inefficient system.
2.6.
Output should ideally be measured in a way that takes account of the quality of service. In July 2007 UKCeMGA published a strategy (ONS, 2007) for measuring quality as part of public service output. It suggests two dimensions of quality that should be captured in the measurement of government output:• The extent to which the service succeeds in delivering intended outcomes;
• The extent to which the service is responsive to users’ needs. (ONS, 2007:1)
The strategy also discusses the case for using ‘value’ weights instead of ‘cost’ weights for use in weighting output indices. The argument is that weighting output measures according to the cost of producing each unit of output, the traditional ONS approach, may not reflect the value of public services to users. For example, the costs of bringing an offender to justice for robbery and burglary may be the same, but society may value the detection of a robbery, which involves violence or the threat of violence, more highly than that of a burglary.
Eurostat Guidance
2.7.
Eurostat (2001: 4) set out criteria for assessing proposed methods. “A methods are the methods that approximate the ideal as closely as possible. B methods are acceptable alternatives: they are further away from the ideal but still provide an acceptable approximation. C methods are too far away from the ideal to be acceptable. They would generate too great a bias or would simply measure the wrong thing.”2.8.
For individual services (i.e. those that are consumed by individual households):5
2.8.1. An output indicator is an A-method if the following criteriaare satisfied:
• All services that are provided to users are covered.
• The outputs are weighted by the costs of each type of output in the base year.
• The indicator is defined in as much detail as possible.
• The indicator is quality-adjusted.
2.8.2. If these criteria are not fully satisfied the method becomes a B method.
2.8.3. Methods which simply assume inputs are equal to outputs are C methods.
2.8.4. A volume indicator is also a C method if it is not representative or does not really measure output but rather input, activity or outcome (note that outcome measures are C methods because they generally are not directly attributable to the activities measured).
2.9.
For collective services (i.e. those that are provided simultaneously to the society as a whole):2.9.1. Classification of methods is broadly the same as for individual services with the following exceptions:
• Methods which simply assume inputs are equal to outputs are B methods for collective services.
• The use of volume indicators of activity is a B method.
Application to Criminal Justice System
2.10.
The function of Public Order and Safety (POS) is classified as a collective service. However, the distinction between collective and individual services is not always straightforward. Some services within the POS function combine elements of both collective and individual services. For example, the aim of the police service is to provide the public with universal and continuous protection. But, in the event of a failure of this protection, the police also provide a service in clearing up crime, and this is delivered to the individual victims (Atkinson, 2005). Within limited resources, services dedicated to one victim are not available for another victim of a different crime. It is also meaningful to consider the quality of the service to a particular victim (whether their call received prompt attention, whether the offender was brought to justice, whether the victim was kept informed of progress and given other support).2.11.
For National Accounts, as POS is classified as a collective service, the output = input method satisfies European requirements at the6
‘B’ level, but it is still valid to seek out direct output measures for at least some parts of the service. In other cases (e.g. counter-terrorism), it may never be possible to do more than measure output by deflated inputs. Given that productivity is defined as the ratio of the volume of outputs to the volume of inputs, the consequence of following the output = input convention is that change in productivity would be assumed to be zero over time. Also, as Atkinson states ‘there is an intrinsic case based on public accountability for seeking to measure what is achieved by spending on public services’ (Atkinson, 2005: 182).2.12.
It would be very difficult to capture the CJS’ attributable incremental contribution of government spending on the CJS to outcomes such as the reduction of crime. Other factors will undoubtedly have an effect on these outcomes, for example changes in the economy, the demographic makeup of the country and the education system. Going one step further, we would also like to measure the value of crime prevented by CJS intervention. Measuring this would be extremely difficult as it essentially requires testing the counterfactual i.e. what would happen in the absence of a CJS.2.13.
Some approaches to measurement of CJS inputs, activities, outputs and outcomes are set out in Figure 2.7
Fig. 2 Possible Measures for CJS
Inputs
e.g. Expenditure on solicitors e.g. Number of prison staff e.g. Police Officer time
Resources used in carrying out activities
Activities
e.g. Number of prison nights
e.g. Case preparation by prosecutors
e.g. Time spent in court on sentence/trial/committal
Lead to outputs that are directly attributable to those activities
Outputs
e.g. Detections e.g. Disposals
e.g. Completed sentence/trial/committal
The direct product of activities. Contribute to outcomes
Outcomes
e.g. Reduction in re-offending e.g. Reduction in the fear of crime
e.g. Increase in the number of crimes for which an offender is brought to justice.
The anticipated or actual effects of activities/outputs.
2.14.
The aim is to find output measures which take account of impact on outcomes, probably through explicit quality adjustment.2.15.
This paper is concerned with the measurement of productivity for the CJS. The next section will set out the CJS as it stands, in England and Wales. The paper will then discuss the specific issues regarding the measurement of outputs and inputs for CJS productivity analysis and will introduce the future directions UKCeMGA will take in improving current measures.8
3. Public Order and Safety
Introduction
3.1.
The function of Public Order and Safety is a level one classification under the international Classifications of Functions of Government (COFOG) used in NA. It has six subsections:• Police Services
• Fire-protection services
• Law courts (including Probation Service, Crown Prosecution Service and Legal Services Commission)
• Prisons
• Research and Development in Public order and Safety
•
Public Order and Safety not elsewhere classified3.2.
The POS function is broad, covering civil justice, criminal justice, and fire-protection services. For example, both the civil and criminal courts fall under the subsection ‘law courts’. The focus of this paper is on criminal justice services only. That is, only agencies involved in dealing with crime will be considered. Other services falling under POS, such as fire-protection and civil justice services will be discussed in separate papers.Government departments
3.3.
Fig. 3 (see below) shows how the different components of the CJS fit together under the overarching government departments.3.4.
Three government departments in England and Wales currently take principal responsibility for the CJS.• Home Office
• Ministry of Justice
• Attorney General’s Office
Home Office
3.4.1. The Home Office (HO) is the government department responsible for leading the national effort to protect the public from terrorism, crime and anti-social behaviour. In terms of the POS COFOG it is responsible for the Police Services.
9
Ministry of Justice
3.4.2. As of May 2007, responsibility for probation, prisons and preventing re-offending moved from HO to the new Ministry of Justice (MoJ). MoJ is responsible for policy on the overall criminal, civil, family and administrative justice system, including sentencing policy, as well as being responsible for the courts, tribunals, youth justice, legal aid and constitutional reform. MoJ is host to the Office for Criminal Justice Reform (OCJR), which, however, remains trilateral, reporting to the Secretary of State for Justice, the Home Secretary and the Attorney General. In terms of the POS COFOG MoJ is responsible for Prisons, the criminal courts, the Legal Services Commission and the Probation Service (the latter three falling under the subsection ‘Law courts’).
Attorney General’s Office
3.4.3. The Attorney General and Solicitor General (the Law Officers) are the chief legal advisers to the Government and are responsible for all crown litigation. They have overall responsibility for the work of the Treasury Solicitor’s Department, the Crown Prosecution Service, the Serious Fraud Office (SFO), the Revenue and Customs Prosecution Office (RCPO) and HM Crown Prosecution Service Inspectorate (HMCPSI). In terms of the POS COFOG it is responsible for the Crown Prosecution Service, under the subsection ‘law courts’.
Criminal Justice across the UK
3.4.4. It is important to note that the Criminal Justice Systems of Scotland and Northern Ireland differ from that in England and Wales. The differences are not set out in this document, but the broad approach described below will also be taken forward in developing work to measure output for Scotland and Northern Ireland, to build up to measurement of productivity of the CJS for the UK as a whole.
10
Fig. 3 The Criminal justice System following re-structure
Office of the Attorney General Probation Service Home Office Prison Service Tribunals Service Youth Justice Board Judiciary and Magistracy Court Service Legal Services Commission Legal Aid – Cost of defence Lawyers In criminal Cases Court of Appeal Crown Court Magistrates Crown Prosecution Service Serious Fraud Office Treasury Solicitor Local Police Authority 43 Local Forces
Office for Criminal Justice Reform* Ministry Of Justice
National Offender Management Service
* MoJ is host to the Office for Criminal Justice Reform, which, however, remains trilateral, reporting to the Secretary of State for Justice, the Home Secretary and the Attorney General
11
Criminal Justice Agencies
3.5.
Criminal justice services are provided by a variety of agencies.The Police
3.5.1. There are 43 police forces in England and Wales. There is a tripartite structure for governing the Police. Chief police officers have responsibility for operational matters while Police Authorities (made up of local magistrates, councillors and community representatives) ensure local forces operate efficiently and effectively. HO have overall responsibility as overseer and coordinator, responsible for national planning and financing. In addition, all regional forces are monitored by HM Inspectorate of Constabulary (HMIC) to ensure they achieve and maintain agreed standards and improve performance. The finances and performance of Police Authorities and their forces are also monitored by the National Audit Office (NAO) and HO. 3.5.2. On 1 April 2007 the National Policing Improvement
Agency (NPIA) became operational. It was set up to support police forces in improving the way they work. It is a police owned and led agency that provides expertise in areas as diverse as information and communications technology, support to information and intelligence sharing, core police processes, managing change and recruiting, developing and deploying people.
3.5.3. The Police are funded by HO (via the Police Authority) and in addition a charge is levied by the Police Authority to the local community via council tax.
Correctional Services
3.5.4. Correctional Services cover HM Prison Service, the National Probation Service and the Youth Justice Board, and are responsible for providing community and custodial penalties. In 2004 a new department, the National Offender Management Service (NOMS), was created by HO with the aim of properly punishing offenders, reducing re-offending and protecting the public. At the heart of the NOMS' vision is better alignment of organisations that provide services for offenders. By 2010 NOMS aims to have made a significant reduction in re-offending rates by introducing a system of end-to-end offender management both in custody and the community. The two main public service providers for offender management are HM Prison Service and the National Probation Service.
12
The Prison Service3.5.5. There are approximately 140 prisons in England and Wales, ranging from young offender institutes to Categories A, B C and D, where Category A prisons hold the most serious offenders.
3.5.6. The main objectives of the Prison Service are ‘to protect the public and provide what commissioners want to purchase by: holding prisoners securely, reducing the risk of prisoners re-offending and providing safe and well-ordered establishments in which prisoners are treated humanely, decently and lawfully.’ (HMP).
3.5.7. The Prison Service is regulated by the Independent Monitoring Board and HM Chief Inspector of Prisons (HMCIP) for England and Wales. They monitor the welfare of staff and prisoners and the condition of the prison premises.
3.5.8. Privately managed prisons were introduced to the UK in the 1990s. At present there are 11 private prisons contractually managed by private companies such as GSL, Serco and G4S. HMCIP inspect these prisons in the same way as public sector prisons.
The National Probation Service
3.5.9. The National Probation Service (NPS) is responsible for 42 separate probation areas, divided into 10 regions across England and Wales. The NPS is a law enforcement agency which supervises offenders in the community – those subject to a court order and those released on licence from prison. The NPS also provide pre-sentence reports (PSRs) to assist magistrates and judges in their sentencing decisions. The NPS aims to protect the public, reduce re-offending, ensure proper punishment of offenders in the community and ensure offenders’ awareness of the effects of crime on victims of crime and the public. The performance of the NPS is assessed regularly by HM Inspectorate of Probation (HMIP), an independent Inspectorate, funded by MoJ and reporting directly to the Secretary of State.
The Crown Prosecution Service
3.5.10. The Crown Prosecution Service (CPS) is the government department responsible for prosecuting criminal cases investigated by the police in England and Wales. As the principal prosecuting authority in England and Wales, they are responsible for advising the police on cases for possible prosecution, reviewing cases submitted by the police, determining the charge in all but minor cases, preparing cases for court and the presentation of cases at court.
13
Criminal Courts3.5.11. Her Majesty's Courts Service (HMCS) is an executive agency of MoJ. It is responsible for managing the Magistrates', Crown, County and High Courts and the Court of Appeal in England and Wales.
Magistrates’ courts
3.5.12. A Magistrates’ Court is the lowest level of court in England and Wales. It is presided over by a tribunal, often referred to as the Bench, consisting of two or more justices of the peace (lay Magistrates) or by a professional District Judge, and dispenses summary justice, under powers usually limited by statute.
3.5.13. Magistrates' Courts deal with the least serious criminal offences (summary offences). These are offences that merit a short term of imprisonment and/or a fine (generally a maximum of six months/£5000). A defendant may opt for a trial in a Magistrates’ Court if charged with an offence that is triable either way (that is, one which may be heard by a Magistrates’ or Crown Court). In these cases Magistrates can either accept or reject jurisdiction (i.e. they can try, or commit to Crown Court for trial). If an offender is found guilty a Magistrates’ Court can either sentence or commit them to Crown Court for sentencing.
Crown Courts
3.5.14. Her Majesty’s Crown Court sits in around 90 locations, divided into eight regions, in England and Wales. High Court Judges, Circuit Judges and Recorders normally sit in the Crown Court. Circuit Judges are the same Judges who sit in the County Court. Recorders are Barristers or Solicitors in private practice, who sit part time as Judges. The most serious cases (murder, rape etc.) are allocated to High Court and Senior Circuit Judges. Circuit Judges and Recorders deal with the remainder, although the latter usually handles the less serious work.
3.5.15. The Crown Court carries out three different types of activity: appeals from decisions of Magistrates’, sentencing of defendants committed from Magistrates’ courts, and trials of all indictable only offences (the more serious offences) and of triable either way offences that have been committed from Magistrates’ Courts. A jury of twelve people decide all trials.
Legal Services Commission
3.5.16. The 1999 Access to Justice Act replaced the Legal Aid Board with a Legal Services Commission (LSC) for England and Wales. The LSC is responsible for funding the Criminal Defence Service (CDS) which provides
14
advice and legal representation for persons facing criminal charges. The services covered range from advice in the police station, to representation in the Magistrates’ Courts, through to representation in the Crown Courts. Free legal representation is only granted to those who need it most. Two tests, the Interests of Justice test and a means test, are used to assess a defendant’s eligibility. The CDS is linked to the Public Defender Service (PDS) which is the first provider of salaried criminal defence (solicitors and accredited representatives).General Government Final Consumption Expenditure
1,
UK, 2003
3.6.
The chart below shows the weights currently used in the National Accounts to calculate total General Government Final Consumption Expenditure. They reflect the relative spend on each individual criminal justice agency for 2003.Agency Police Prisons Legal Aid Probation Criminal Courts CPS
% 4.4 1.1 1.0 0.3 0.3 0.2
1
General Government Final Consumption is the amount spent by government on compensation of employees, procurement and consumption of fixed capital. It excludes transfer payments (e.g. social security payments to individuals).
15
4. The Current Approach to the Measurement of
CJS Outputs in National Accounts
4.1.
Until 1998 ONS measured CJS output using the convention that the value of outputs is equal to the value of the inputs used to produce the outputs. This convention is unsatisfactory for the reasons outlined in Chapter 2.4.2.
In 1998 ONS began to implement a new method of estimating the volume measure of government non-market output. Reflecting new international guidance, this attempted to directly measure the volume of outputs produced by government. These direct estimates of government output were then incorporated into the UK National Accounts and now cover some 60% of total General Government Final Consumption and 60% within the Public Order and Safety COFOG.4.3.
In the UK National Accounts, all Public Order and Safety output, except for Police, is currently estimated using activity indicators, without quality adjustment, which are used as proxies for outputs. Graphs showing the current output series in the NA for each criminal justice agency2 have been provided in Annex A for reference, however, it is important to note that any interpretation of these graphs is problematic given the limitations of the measures, as discussed below.4.4.
For each CJS agency except the Police, a cost weighted activity index (CWAI) is constructed. This involves the following steps:• Produce a list of activities that are considered to cover all or most of the work of that agency.
• For each activity, find a volume measure that describes how the amount of work involved in that activity is changing over time e.g. a count of the number of incidents or cases in each time period.
• Apply appropriate cost weights to the volume measures of the activities to reflect the differing levels of resource required for the different activities.
• Convert the cost weighted volume measure into an index number using 100 as the base year.
Police
4.5.
Police output is currently measured using deflated expenditure. More details on this can be found in Chapter 6.4.6.
The obvious flaw in using the outputs = inputs convention to measure police service output is that change in police productivity is2
A graph showing the volume output for the police is not currently available in the National Accounts as it is integrated within a measure of ‘other’ local government and central government output.
16
simply assumed to be zero. As previously discussed, using deflated inputs to measure output may be acceptable by international standards but UKCeMGA would like to go further than this. It views measuring productivity as a goal in its own right.Legal Services Commission
4.7.
Output for the LSC is measured directly using a measure of cases in which legal aid is administered. Initially cases were broken down into ten categories. However, in 2001/02 some of the series were discontinued. Data are now only available broken down into the following categories:• Lower Standard Fees
• Higher Standard Fees
• Non Standard Fees + Exempt
4.8.
For each category annual data on the number of cases for which legal aid is granted are available with approximately 80%, 15% and 5% of cases falling into each category respectively. These are then weighted together using base year expenditure weights (currently year 2000). The weights are the actual total expenditure on legal aid for each type of case.4.9.
Ideally, only the cost of administering the legal aid would be used as weights (i.e. excluding payments, as these are transfer payments rather than final expenditure). However, a breakdown of administration costs was not available at the time. In addition, it is now normal practice to chain link the cost weighted activity series for NA and UKCeMGA productivity articles, rather than using fixed base year weights.Crown Prosecution Service
4.10.
CPS output is measured in NA using a direct volume measure of output. The output of the CPS is taken to be the ‘number of defendants for which the CPS provides prosecutors’. These are divided between cases in the Magistrates’ and Crown Courts, and are weighted together according to expenditure in the base year (currently year 2000). Expenditure weights are calculated by the product of the total number of defendants for which the CPS provide prosecutors and the average cost of a case in the base year. Data on the number of defendants for which the CPS provide prosecutors is up to date. However, unit cost data has not been updated since 2003/04.4.11.
It would be desirable to have activities and unit costs further sub-divided, e.g. between guilty and non-guilty pleas, in ways which reflect variations between relatively cheap and relatively expensive cases.17
Criminal Courts
4.12.
The outputs of the criminal courts are currently estimated using direct output methods. The output of the Magistrates’ and Crown Courts are measured separately.Crown Courts
4.13.
Data are provided on the number of Crown Court cases broken down into the following categories:• Committals for Trial : Actuals
• Cases for Sentence : Actuals
• Appeals : Actuals
4.14.
Using base year expenditure weights, the three series are then weighted together to form one index. Base year expenditure weights are calculated by the product of the total number of cases of a particular type and the average cost of a case in the base year.Magistrates’ Courts
4.15.
For the Magistrates’ Courts a 'weighted caseload' is available from which an output index can be calculated. Completed proceedings are counted in 14 case types (see below). Weightings are then applied to each case type, to provide an overall unitary value of caseload. The weights are calculated from large samples of cases and reflect the average time required to complete each type of case.• Indictable Adult indictable and triable either way offences
• Breaches All breaches and revocations of sentences
• Nonmotor Summary non-motoring offences
• Motoring Summary motoring offences
• Youth All youth crime, indictable and summary, including breaches
• Section 8 Children Act section 8 orders (private law)
• EPOs Children Act emergency protection orders
• Care Proceedings Children Act care proceedings (public law)
• Other Family/Child All other family proceedings and Children Act cases, e.g. adoptions, financial etc.
• Licence Sessions Licensing applications heard by licensing committees
18
• Licence Petty Licensing applications heard by magistrates in petty sessions
• Other Civil work Any other civil complaints, made to obtain an order, e.g. dangerous dogs.
• Means enquiries All means enquires with defendant present
• Legal Aid All applications for legal aid granted or refused
The weighted caseload measure currently used includes both civil and criminal work, as both are required for NA. However, it should be possible to reconstruct the index to use only those items relevant to criminal justice.
Probation
4.16.
Probation output is (in a sense) currently estimated using direct output methods. The NA make use of work in the late 1990s, working with the Probation Service, to develop a cost-weighted activity index, based on the following activities:• Probation starts
• Community service
• Combination orders
• Licences
• Numbers of pre-sentence reports (PSRs) completed
• A measure of probation work done in the family court
4.17.
The measure uses weighted implied workload hours for the above activities. The data are based on activity sampling exercises carried out in 1997 and 1998. No new data have been used for NA since 1998/99. The current index is extrapolated from a short time series, and takes no account of major changes in offender management in the last ten years.Prisons
4.18.
Prison service output is measured directly. It is currently measured using a simple count of the number of nights spent in prison. Data are available disaggregated by prisoners on remand, prisoners under sentence, non-criminal prisoners, and prisoners in police cells.4.19.
The current measure is very basic and is not weighted in any way. Using this measure, output is bound to increase if the number of prisoners increase. The measure takes no account of the change in the mix of outputs or the effect of a change in the quality of outputs.19
Overcrowding, re-offending, any reduction in drug dependence, increase in literacy or other achievements during incarceration are some of the factors that could be taken into account.Summary
4.20.
The current NA methods, despite clear limitations, have some advantages as a starting point:• Direct output measures are used for all Criminal Justice agencies, apart from the Police, though each needs review to ensure the ‘unit of output’ is well chosen and that the range of expenditure covered by the output measures is reasonably complete.
• Inputs and outputs can be linked for each agency, so allowing for the calculation of productivity estimates for each individual component of the CJS.
• There are some prospects of retrospective time series on a consistent basis, though it is clear that there are problems on data flows and it is likely that legal or other changes will make it hard to track output and unit costs consistently, year on year.
• Outputs can be clearly associated with inputs in a particular time period (annual, and potentially quarterly which would also improve the NA measures). This would be much more challenging on the alternative models (discussed later).
4.21.
Reviewing and updating these measures would improve NA. As well as improving the completeness and relevance of data, the method should be revised to follow chain linking rather than a fixed base year index. In order for a methodological change3 to be accepted as part of NA it must go through a consistent and rigorous quality assurance process to ensure the new method is fit for purpose. The process is described in more detail in Robinson and Obuwa (2006). In some cases, methods which are not adopted for NA might still be used by UKCeMGA in productivity articles.3
The definition of a ‘methodological’ change is a change in sources or calculation used to produce an output (Robinson and Obuwa, 2006).
20
5. Future Methods for the Measurement of
Government Output and Productivity
Quantity
5.1.
In May 2007 a Criminal Justice Steering group was set up, attended by ONS, HO, MoJ, OCJR, CPS, the Scottish Government, the Welsh Assembly Government and academic representatives. Options were discussed for improving the current methodology for measuring CJS output and productivity. Several approaches were considered:Option 1: Develop existing ONS methodology, estimating the individual output of the different CJS agencies, and then aggregate them.
Option 2: An Administration of Justice Framework.
Option 3: An econometric approach to measuring the effects of the activities of the CJS on crime rates – an outcome based model developed by HO.
The three approaches are discussed below.
Option1: Develop existing ONS methodology
5.2.
The first option for improving the current methodology for measuring CJS output and productivity is to develop the existing ONS methodology.5.3.
Police - Activity Based Costing5.3.1. In 2003/04 the production of Activity-Based Costing (ABC) became mandatory for all Police Forces in England and Wales. Broadly, ABC is a widely used costing system that seeks to place an accurate cost on what an organisation produces by reporting data associated with relevant activities. In the police service it has been developed as a method of calculating the costs of policing activities (HO, 2006a). There are a standard set of activity codes for all forces to collect data and report against. Activities can be split into Crime Incidents (e.g. robbery, burglary), Non-Crime Incidents (e.g. public disorder, road traffic collisions) and Incident-Linked activities (e.g. searches, observations, paperwork). The model is based on applying activity data (gathered through activity sampling and management information) to the total staff costs of a group of staff within a defined Cost Centre. Costs per activity are produced in this way. These costs can then be summarised into four operational Domains which align with the Policing Performance Assessment Framework (PPAF) domains4:
4
ABC data will be expected to align with the new Assessment of Policing and Community Safety (APACS) which will replace PPAF in the future.
21
• Reducing Crime (proactive -preventing and reducing crime)
• Investigating Crime (reactive – bringing offenders to justice)
• Promoting Public Safety (proactive – raising awareness and reassurance)
• Providing Assistance (reactive – dealing with public when asked for assistance)
5.3.2. Three years of ABC data are now available for analysis. There is potential to use this data source to produce a direct measure of police output. This has been attempted in the past, but was criticized for data quality reasons as cost weights were derived from activity sampling carried out on a single Police Force. However, ABC data are now much more advanced, in the form of a mandatory annual national survey, meaning there is a possibility of creating a much more robust CWAI.
5.3.3. The recent review of policing conducted by Sir Ronnie Flanagan (Flanagan, 2008) was critical of the police ABC system recommending that:
“The Home Office should urgently examine its requirement for each force to undertake Activity Based Costing with a view to this requirement being replaced with an alternative which costs less, is easier to use and has greater impact on productivity” (Flanagan, 2008: 24)
5.3.4. It also discussed an alternative methodology for analysis of costs by objective, which is currently being led by West Midlands Police:
“Objective analysis breaks the costs down by function and, if this were implemented for the police forces in a consistent and mandated format, would provide, for the first time, a basis of comparison between forces that would allow an informed debate to take place about future costs, staffing numbers and performance, in each of the major policing functions.” (Flanagan, 2008: 25)
Such analysis could provide useful data for developing a CWAI to improve the measurement of Police output in the future. The Flanagan Review recommended that HO support the development of objective analysis across forces and UKCeMGA will continue to monitor progress in this area.
5.4.
Police - National Standards for Incident Reporting5.4.1. A limitation of the national ABC survey is that non-criminal incidents are aggregated at a high level. Therefore, its use in capturing activity and cost information on police activity not related to the investigation of crime is limited. In 2003
22
the HO began work on a National Standard for Incident Reporting (NSIR). A review of crime and non-notifiable crime incidents had found that the most commonly used closure code for incidents in the police was ‘miscellaneous’ or ‘other’ (over 50% in a number of forces) (Audit Commission, 2006). NSIR, implemented in response to this, aims to provide a standardised method of recording non-crime incidents reported to the police (e.g. lower level anti-social behaviour incidents, missing persons, etc.). It is equivalent to the National Crime Recording Standard (NCRS) for criminal incidents. Non-criminal incidents take up a significant amount of police time and so it is vital they are captured in any output measure. The first full year of data was for 2006/07. There is potential to use these data to develop a CWAI to cover non-crime incidents in the future.5.4.2. If ABC and NSIR data cannot be used to develop a direct measure of police output the option of improving the current indirect measure of using deflated police expenditure remains (inputs equals outputs approach). There are several ways in which this measure could be improved, namely through improving deflators. More information on this can be found in Chapter 6.
5.5.
CPS output5.5.1. As mentioned earlier, using the ‘number of defendants for which the CPS provide prosecutors’ as a measure of CPS output is limited. It would be better to use a disaggregated measure matching a range of unit costs. Data on the number of ‘defendants finalised’ disaggregated by outcome are also available which may, provided appropriate unit costs are also available, offer a solution to the problem that CPS resources vary considerably by outcome.
5.6.
NOMS5.6.1. The current output measures for the Prison and Probation Services are limited. The former is extremely basic and the latter is now out of date.
5.6.2. Prison Service output is currently measured using a simple count of the number of nights spent in prison. The development of a CWAI for NOMS would provide a better measure. A number of projects are underway which may provide an opportunity to achieve this.
5.6.3. Several streams of work developing unit costs for NOMS have been, and continue to be, carried out in MoJ and within the Prison and Probation Services. It is understood that the Prison Service is undertaking an activity costing exercise to develop some top level annual prison place cost estimates, broken down by category of prison.
23
5.6.4. The Probation Service has developed some unit costs ofNOMS interventions. These estimates consist of simple top-down unit costs for interventions (budget/volume), broken down by region. They are looking to take this forward in the future through taking a bottom-up approach to producing unit costs.
5.6.5. MoJ have also been working on this area. They have developed some bottom-up unit costs for certain NOMS interventions. Unfortunately, the scope of the project is limited with only costs of interventions over and above the standard prison costs (i.e. that every prisoner receives) included. Furthermore, only certain accredited interventions are included.
5.6.6. MoJ are taking this work forward over the next few years through co-ordinating an extensive NOMS unit costs project. They plan to broaden the work done previously by increasing the coverage of both type of costs and interventions. They aim to produce some bottom-up, end-to-end unit costs for a broad range of NOMS interventions. Results are expected in 2010.
Option 2: The Administration of Justice Approach
5.7.
The second option for improving the current methodology for measuring CJS output and productivity is to implement a new method called the Administration of Justice approach (AoJ). This attempts to address some of the limitations with the current methodology outlined in Chapter 4, for example, that repeat offenders raise output, not reduce it.5.8.
Option 1 is based on the output of individual agencies and neglects the inter-relationships between the criminal justice agencies and the fact that the quantity and quality of output from one agency can affect those of another. For example, CPS output is very much affected by the efficiency and effectiveness of both the Police and the Criminal Courts.5.9.
In 2004 the HO, working with the Atkinson Team, began work on the Atkinson agenda in relation to Public Order and Safety. Working with CPS, OCJR and the then Department for Constitutional Affairs (now MoJ) they developed a new framework for measuring the input, output and productivity of the CJS. In 2005 a technical paper (HO, 2005) was published setting out their recommendations in the form of a new conceptual framework – the AoJ framework.‘The framework is one that recognises the interdependencies between CJS agencies…in contrast to the current method used by the Office for National Statistics (ONS) that focuses on individual CJS agencies, where it is difficult to assess final outputs, and to disentangle which agency is responsible for changes in output and ultimate productivity’’ (HO, 2005: iv)
5.10.
The HO technical paper describes the AoJ framework in detail. But, in brief, the AoJ approach comprises two main stages. The first24
stage recognises that the work of the Police, LSC, CPS and Criminal Courts is inter-related and that they all work together to produce a desirable end point – bringing an offender to justice either through a conviction or an acquittal. The second stage captures the combined output of the correctional services (i.e. offender management and interventions). NOMS (Prison and Probation services) administer the sentences imposed by the courts and so are viewed as having separate outputs from those produced by the Police, LSC, CPS and the Criminal Courts.5.11.
The AoJ model considers the joint output of the Police, LSC, CPS and Criminal Courts to be CJS disposals which are delivered by the system as a whole (e.g. acquittal, caution, fine, custodial sentence). The intermediate outputs of the individual agencies are ignored; the model is concerned only with the output of the entire system.5.12.
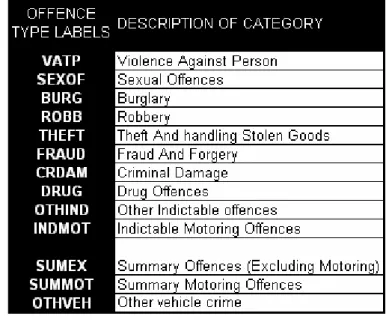
To show how various offences flow through the system it was decided to relate each crime type to its observed frequency of receiving the corresponding sanction. A matrix has been constructed (Fig. 6), with rows representing the different crime types (Fig. 4) and columns representing the disposals (Fig. 5). The pairs capture something of the homogeneity of individual cases, for which expenditure weights can be calculated (though there is a case for value weights).25
Fig. 4 The range of crimes covered by the AOJ matrix
26
Fig. 6 Crime/Disposal Matrix
5.13.
The AoJ approach considers the outputs of the correctional services (NOMS) to be separate from those of the police, LSC, CPS and Criminal Courts. It is not as appropriate to measure the endpoint of the offender management process as it is to measure the endpoint of offenders going through the sentencing process. Value is accrued each day that an offender is undergoing some form of offender management, whether it be incarceration or supervision in the community. Therefore, although the AoJ model treats offender management as a single entity (NOMS), it measures its output separately in the traditional National Accounts way.5.14.
Therefore, in summary, the output of the CJS would be calculated through taking the joint output of the Police, LSC, CPS and the Criminal Courts and adding it to the output of NOMS.5.15.
The AoJ framework also envisages other areas within the CJS being incorporated into the model such as anti-social behaviour related activities.Costing the AoJ Approach
5.16.
To implement the AoJ approach it will be necessary to obtain average unit cost weights for each crime/disposal pair in the AoJ matrix– covering the activities of the Police, LSC, CPS and Criminal Courts. There are several sources available including the HO Flows and Costs Model and the HO Economic and Social Costs of Crime work. Further details on these models can be found in HO research papers (Harries, 1999; Brand & Price, 2000; Dubourg, Hamed &27
Thorns, 2005). OCJR have also recently started a programme of work developing standardised unit costs across the CJS which may prove useful in the future.Limitations of the AoJ Approach
5.17.
AoJ still has limitations:• Unlike the current National Accounts methodology, this method will not provide individual measures of output for the different CJS agencies. This is problematic as it may not be possible to attribute a change in productivity to a particular agency and to target work to improve the output of an agency if needed.
• Individual cases will often straddle years, with costs of police investigation in one year, and costs of prosecution and court hearing falling one or more years later: the methodology would have to cope with this.
• The AoJ approach, as it stands, makes no attempt to measure activity other than that related to the investigation of crime.
• As with the individual agency approach this method does not measure the change in outcomes attributable to CJS activities (though it would support links with other evidence, for example on the re-offending rates for offenders by crime and disposal).
• The AoJ model, as proposed, makes no change to Probation and Prison Service output methods and thus the same problems would remain with these output measures.
• The AoJ approach may not be introduced for some time, and it seems unlikely that it would then be possible to construct a retrospective time series. This means that current methods would in any case be needed to cover the recent past and future, and that care would be needed in moving from one basis to another.
Option 3: Outcome based model (econometric model)
5.18.
The two approaches discussed above use measures of activities or outputs and not outcomes. The existing approach gives no consideration to the attributable incremental contribution of government spending on the CJS to CJS outcomes (e.g. reducing crime and re-offending).5.19.
A third option for improving the current methodology is to use an econometric model of crime developed by the HO to gauge the impact of the CJS on crime. The model, called the Trends in Crime (TIC) model, is an outcome based approach to the measurement of CJS output and productivity. The basics of the model will be explained in brief here. For a more detailed explanation see HO technical paper (HO, 2005; appendix).28
5.20.
The TIC model derives an estimation of the level of crime, both withand without a CJS. The difference between the two estimates represents the level of crime ‘prevented’ which can then be used as a proxy for outcome of the CJS. The level of outcome can then be compared with the inputs to the CJS to derive a productivity measure (HO, 2005). In simple terms, the TIC model attempts to measure changes in total recorded crime using a number of economic, demographic and criminal justice explanatory variables.
5.21.
The model is currently under development and therefore does not offer a solution to the measurement of CJS output and productivity in the short term. For National Accounts purposes, the model may never be accepted as a suitable methodology.Quality
5.22.
The Atkinson Review and the Eurostat Handbook on Price and Volume Measurement recommend that public service output be measured in a way that adjusts for quality change (European Commission, 2001).5.23.
The current measures of CJS output in National Accounts are not quality adjusted in any way. Steps need to be taken to address this limitation.5.24.
Ideally, a measure of quality would capture the progress of the CJS in achieving its outcomes such as reducing crime and the fear of crime, but only that progress that is attributable to the CJS. In addition, there should be measures of whether the services are responsive to users’ needs.5.25.
There are a variety of data sources available to us that could potentially be used in developing quality measures. Below are just two examples:• Data from both the British Crime Survey (BCS) and the Witness & Victim Experience Survey (WAVES), which collect data on the experiences of the general population as well as victims and witnesses involved in criminal cases, could be used in the development of a quality adjustment for police output.
• Data are available on prisoner category, offender risk, achievements during incarceration such as educational attainments and drug treatment programmes. These are all variables that could potentially be used to quality adjust a measure of NOMS output.
5.26.
UKCeMGA will explore sources of data that could be used in developing quality measures and will seek to incorporate the recommendations of Eurostat and the UKCeMGA Quality Strategy (ONS, 2007) in any output measures that are produced.29
Recommendations
5.27.
To summarise, the immediate priority for UKCeMGA is to update the existing ONS methodology.5.28.
The AoJ approach is not currently robust enough to be used as a method for the measurement of CJS output. We are some way off being able to fully populate the AoJ model with the cost/value weights required. However, a more robust method may result from the work presently being carried out in this area by OCJR. UKCeMGA will continue to monitor developments in this area and to review its progress in terms of being implemented as a method of measuring CJS output in the future.5.29.
The Econometric model is currently still under development by HO. As with the AoJ approach, UKCeMGA will continue to monitor developments in this area.5.30.
Alongside any development of CJS output measures UKCeMGA will explore methods of taking account of any change in the quality of service.30
6. Measuring CJS Inputs for Productivity Analysis
Measuring input for productivity analysis
6.1.
“Input is the collective term that defines all resources used to produce the output” (ONS, 2007a:129). Inputs can be roughly split into three categories: labour, procurement and capital. In the case of the CJS examples of inputs are as follows:• Labour – Police staff, prison staff, probation officers.
• Procurement – Uniforms for prison staff, fuel for police vehicles.
• Capital – Prison buildings, police cars.
6.2.
In order to analyse productivity we require a volume measure of inputs. There are two approaches to obtaining volume measures of input: direct and indirect measures of input.6.3.
Volume measures of input can be obtained directly for some inputs. For example, a direct measure of police labour input could be a headcount of all police staff, weighted by grade. However, in some cases it is not possible to directly measure input and in these case indirect methods can be applied in which current price expenditure data is deflated to give a volume measure.6.4.
An increase in expenditure on inputs between any two years could be the result of purchasing more inputs or of an increase in the price of those inputs. In reality it is more likely that there will be a combination of these two factors resulting in a change of input expenditure (ONS, 2003). It is, therefore, essential that volume measures of inputs are used in productivity analysis in order to remove the effect of pay and price increases. Indirect measures of input involve converting current price expenditure data into constant prices to remove the effect of pay or price increases. When using indirect measures we require accurate deflators to convert current price expenditure data into constant prices. The Atkinson Review listed a number of criteria against which the quality of deflators could be assessed (Atkinson, 2005). Indirect measures of input for productivity analysis are measured as follows:31
Fig. 7 Components of an Indirect Input Measure6.5.
As mentioned earlier, productivity of public services is analysed by dividing volume measures of output by volume measures of input. It is, therefore, important that accurate measures of input are used. This is particularly important for components of the CJS where output is measured using the output = input convention (i.e. Police) (Atkinson, 2005).6.6.
The Atkinson Review put forward two key principles for the measurement of inputs for public service productivity analysis: Atkinson Review Principle F:The measurement of inputs should be as comprehensive as possible, and in particular should include capital services; labour inputs should be compiled using both direct and indirect methods, compared and reconciled.
Atkinson Review Principle G:
Criteria should be established for the quality of pay and price deflators to be applied to the input spending series; they should be sufficiently disaggregated to take account of changes in the mix of inputs and should reflect full and actual costs.
Measuring labour input
6.7.
In Recommendation 5.8 Atkinson stated that: ONS should continue to develop its estimates of labour inputs using both the direct and indirect approaches, exploring issues on data availability and interpretation in the light of comparisons between the results of both methods.6.8.
Direct measures include number of hours worked weighted by different skill categories. Indirect measures include pay deflated by a labour cost index. In order to produce accurate measures of productivity we need to understand the merits and demerits of each approach (Atkinson, 2005).6.9.
For the direct approach, it is recommended that ONS should expand the analysis by function, introduce a public/private split and incorporate information on changes in skill mix. For the indirect approach, ONS should improve the quality of deflators used for public spending on labour services (Atkinson, 2005).32
Direct Measures6.9.1. The simplest direct measure of labour input would be a headcount of employees but this approach is problematic as it will hide changes in average hours worked and will mask differences in quality of labour. ‘Hours actually worked’ is the most appropriate variable for labour input in productivity measurement because it bears a closer relation to the amount of productive services provided by workers. However, measurement of hours actually worked can be difficult and so hours paid and full-time equivalent persons can provide reasonable alternatives. Methodologies underlying the construction of full-time equivalent persons can, however, be very crude, e.g. two part-time people = one full-time equivalent.
Indirect Measures
6.9.2. Indirect approaches to the measurement of labour input involve deflating current price expenditure on labour by pay indices. Indirect measures may be easier to calculate, with no need for additional data, provided that appropriate deflators exist. However, suitable deflators are not always available (OECD, 2001).
6.9.3. Current price expenditure on compensation of employees reflects not only employee wages and salaries but any supplements to these such as actual employers’ pension contribution. As such it is important for accurate deflators to be used which take into account both changes in wages and salaries and changes in levels of other employer contributions such as pensions and National Insurance. This will enable us to deflate current price expenditure to obtain an accurate measure of the volume of labour input.
Quality
6.10.
Because there may be differences between workers in terms of their skills, education, health and professional experience, one hour worked by one person does not necessarily constitute the same amount of labour input as one hour worked by another person. For the estimation of changes in productivity the question is whether, over time, the composition of labour force changes, e.g. whether there is an increase/decrease in the average quality of labour input (OECD, 2001). For the police, the introduction of police community support officers has added to numbers of staff, with relatively lower skills (and pay) than police constables.6.11.
In the literature and in statistical practice there have been different approaches to explicit differentiation of labour input. Differences between these approaches are closely linked to how “skills” are measured. One possibility is to assume a direct relation between skills and occupations.6.12.
Successful quality adjustment is tantamount to measuring labour in constant-quality units. This would be beneficial as it would provide a33
more accurate indication of the contribution of labour production and could shift the appreciation of sources of growth from externalities or spill-overs captured by the productivity residual to the effects of investment in human capital (OECD, 2001).6.13.
UKCeMGA will work towards a quality adjusted measure of labour input.Measuring procurement input
6.14.
Procurement involves the purchase of goods and services that are used up in the production process, for example fuel for police cars and uniforms for prison staff.6.15.
Changes in the quantity of procurement are calculated by deflating the total current price expenditure figures, using suitable deflators.6.16.
Total procurement expenditure can be broken down into categories that can be matched to comparable elements in the various indices produced by ONS, such as the retail price index (RPI) and producer price index (PPI), in order to produce deflators (Atkinson, 2005).Measuring capital input
6.17.
Capital can be distinguished from procurement by the fact that capital goods and services can be used repeatedly or continuously over the longer term, for example prisons and police vehicles, and so contribute in a different way to the production of outputs.6.18.
Including the entire value of capital investment in the year in which the item was purchased would not reflect the contribution to output over the item’s lifetime. To account for this measures of capital inputs known as ‘Capital services’ and ‘Capital Consumption’ have been developed.Capital Services
6.18.1. Atkinson suggests that Capital Services is the most appropriate measure of capital input for production and productivity analysis. Capital services reflect the flow of productive services, which aid production, from the cumulative stock of past, and current, capital investments. For example, the service flows of a prison include the containment of prisoners and protection from the elements that this building provides throughout its lifetime.
6.18.2. The price of capital services is measured as their rental price. If there were complete markets for capital services, rental prices could be directly observed. As there is no market transaction recorded when capital assets deliver this flow of services these transactions need to be imputed. Measurement of these implicit transactions, whose prices are the rental prices of capital, is one of the challenges of capital measurement for productivity analysis (OECD, 2001).
34
6.18.3. ONS have developed experimental estimates of capitalservices for the whole economy for 1950 to 2005. However, this analysis did not disaggregate to the level necessary to produce a specific capital service measure for the CJS, which is currently categorised as ‘public administration and defence’ (Wallis, 2007). It may not be possible to disaggregate to the COFOG levels as there may not be sufficient sector level information on constant price investment in capital.
6.18.4. Recommendation 5.5 of the Atkinson Review recommends that ONS should continue to develop estimates of capital services, aiming to increase the level of detail presented to distinguish between functions and public and private sectors, to assist in analysis of productivity of public service spending.
Capital Consumption
6.18.5. Due to the lack of data on capital services capital input is often measured by capital consumption. “Capital consumption is described as the reduction in the value of the stock of fixed assets used in the production of goods and services, such as wear and tear, normal obsolescence or normal accidental damage” (Atkinson, 2005: 68). For National Accounts purposes, capital consumption estimates are produced by ONS using the Perpetual Inventory Model (PIM).
6.18.6. In order to improve the current consumption measure, use should be made of the data supplied to the Treasury (HMT) by individual government bodies as part of the system of Whole of Government Accounts (WGA). WGA are based on UK Generally Accepted Accounting Principles (GAAP). However, it is important to remember that while this may improve on the current measure the new data will not provide a history of the government assets in terms of capital consumption and there are several data classification issues where existing WGA data do not directly meet the needs of the National Accounts (Atkinson, 2005).
6.18.7. Recommendation 5.6 of the Atkinson Review endorses the ONS decision to move towards use of the accounts of departments and other public bodies as a basis for estimating capital consumption, rather than its own Perpetual Inventory Model (PIM), and recommend that transition should continue, as technical issues resolve. 6.18.8. The Atkinson Review noted that “price deflators are
needed for Public Order and Safety capital consumption which are specific to the capital expenditure in these areas, which may be very specialised, rather than to rely on a general public sector capital deflator” (Atkinson, 2005: 156). The ONS currently use Central Government
35
and Local Government deflators for public administration, non-military capital consumption. With the move away from PIM to WGA it may be possible to produce deflators at a more detailed level.Issues
6.18.9. One of the main areas in which there are inconsistencies in terms of classification of services is in regards to computer software. Software can be split into two categories, bought-in and own account. Following the European guidelines and definitions, National Accounts were under-estimating the value of own-account computer software, which would add to the value of capital input. This may be particularly relevant for the police service as advancements in specialist own account software may have a significant impact on investigations and consequently on outputs.
6.18.10. Recommendation 5.7 of the Atkinson Review suggests that ONS should continue work to clarify why there is a divergence between the amount of capitalised ICT software in the UK National Accounts compared with other countries, with particular reference to public sector spending, and should publish revised estimates and commentary when available.
6.18.11. Capital input for all CJS agencies is currently measured as capital consumption for public administration and defence, using the PIM. As discussed above, it may be possible to improve this measure by using data from WGA rather than using PIM.
6.18.12. A measure of capital services should also be investigated; however, this is again at the level of public administration and defence and cannot be split by COFOG or by CJS agency.
6.18.13. The fact that CJS capital services cannot be split may be particularly problematic in the case of the police and the prison service as capital in these two cases is unique in terms of the role of police vehicles and prison buildings in producing output.
Availability of expenditure data and deflators
6.19.
This section will set out the expenditure data that we currently have available in NA and the deflation techniques that are currently used. The following section will propose improvements for the deflation of current price expenditure data and explore other areas of development.Local Government
6.19.1. Current price expenditure data, broken down into pay, procurement and capital, for the 43 local police forces