Flexible Service Desk?
Commissioned by Numara SoftwarePublished by:
Dr. Cherry Taylor (BSc, PhD)
Dynamic Markets Limited PO Box 19 Abergavenny NP7 8YF UK Tel: +44 870 7076767
W H I T E P A P E R
1) Executive Summary
Making the right choice?
True total cost of ownership (TOC): [Sections 1.1 & 1.2]
98% of IT managers in large UK organizations with a service desk or help desk have incurred some form of extra cost in addition to the basic purchase/ticket price after they had purchased their current solution. Furthermore, 60% of IT managers who experienced such extra costs say at least some of them were unexpected and only realized after the initial purchase price was agreed with the vendor.
The most common unexpected extra cost has been for professional fees to cover subsequent modification to the service desk system where over 1 in 2 of those who had to pay for this item (53%) were not expecting to do so when they agreed the initial price with the vendor.
Consequences: [Sections 1.3 & 1.4]
44% of IT managers who incurred unexpected extra costs say they added up to 25% of the original ticket price to the overall cost of the solution.
A significant and additional 37% say it added as much as 50% on to the originally agreed price.
An unlucky 10% say the extras added up to 75% of the original fee and the fee was doubled for another 5%.
Among those who incurred unexpected extra costs, more than 1 in 2 (53%) feel their organization was not given adequate and complete information about the true overall cost of the service desk solution prior to making its decision to purchase – and this figure is even higher among the CIOs/IT directors in the sample (63%).
Buying decisions: [Section 1.5]
IT managers were asked about the Top 3 buying criteria they employed when buying their current service desk solution.
Product features (52%) was top of the list for these UK IT managers – and this leads by some way.
Aside from this, IT managers’ Top 3 buying criteria lists are actually very varied with little consensus among them.
This is followed by those who unexpectedly had to pay professional fees to have their service desk solution integrated with other systems – 45% of those that encountered this extra cost were not expecting to do so.
Similarly, professional fees for installation of the service desk solution were a surprise for 36% of those that experienced this as an extra cost item.
In-house administration costs were later discovered by 33% of people that encountered the extra cost and 32% of people who encountered the extra cost of maintenance contracts were not expecting to do so.
That said, the next most common criterion is low purchase/ticket price (37%).
Speed comes in third on the overall list (31%) – but this seems especially important to the CIOs /IT directors and senior managers in the sample (39%), compared to middle /junior managers (13%). This is followed by product flexibility (30%) and the quality of vendor
support (28%).
But fewer than 1 in 3 (27%) factor in the cost of ongoing administration into their Top 3 buying criteria and fewer still give such consideration to the cost of professional fees to support the system (15%).
The least important buying criterion among large companies is compatibility, with only 14% of IT managers putting this as a Top 3 consideration.
Table 1.1: Extra costs for service desk solutions over and above the basic ticket price.
Cost item Extras: (% of all IT managers) Unexpected extras: (% of those who encountered the extra cost)
Professional fees for subsequent modifications 49% 53%
Professional fees for integration with other systems 51% 45%
Professional fees for installation 53% 36%
The cost of day-to-day administration 61% 33%
Living with the wrong choice:
More nasty surprises? [Section 1.6]
When it comes to the service desk systems these IT managers currently have in place, 89% find at least some aspect of them difficult and time-consuming to deal with.
Top of the list as the most common problem encountered is customizing the system to suit the evolving needs of the business (44%), and another 1 in 3 IT managers (35%) have problems tweaking the system without consulting the vendor.
38% of the solutions in place are difficult and time-consuming to integrate with other systems.
But everyday functions also seem to be difficult and time-consuming for many:
– 41% struggle to get meaningful management information and reports
– 30% have problems carrying out basic functions, like problem tracking
– 23% have problems with the day-to-day management of the system by IT staff
– 22% have issues with their system handling remote working – 22% have issues managing multiple sites
– 21% struggle to meet service level agreements they have in place – 14% find managing multiple languages to be a problem But there is a close correlation between how easy the systems are to
use and manipulate, and how they appear to have been sold in the first place.
Indeed, the research shows that IT managers who encountered unexpected extra costs find more of these aspects of their systems to be time-consuming and difficult to manage, compared to those who have not encountered unexpected extra costs.
Indeed, all of the IT managers who incurred unexpected extra costs now find at least some aspect of their service desk solution difficult and time-consuming to deal with, compared to those who did not encounter any unexpected extra costs (73%).
Feeling negative? [Section 1.7]
Among all the IT managers in the sample, 68% have a negative attitude towards their service desk solution and/or vendor – and such negativity is more common among CIOs/IT directors and senior IT managers (74%), compared to middle/junior IT managers (53%).
Considering the abundant problems that appear to exist, it is not surprising that 46% either feel lumbered with their systems and/or feel they cannot afford to change vendors at this stage, and almost 1 in 5 (18%) say if they could turn back the clock they would not purchase the same system again today.
When it comes to the vendors of the systems in place, 28% think they are generally slow to respond and 17% have a strained relationship with their vendor – but almost 1 in 10 IT managers (9%) say they lack trust in their service desk vendor.
It is also no surprise to find a correlation between how people feel about their systems and vendors, and whether or not they have incurred extra costs: specifically, twice as many with bad experiences over cost feel negative in some way (86%), compared to those who have not had cost issues (41%).
In more detail:
– More (61%) either feel lumbered with their systems and/or cannot afford to change vendors now (compared to 24%) – More (32%) say their service desk vendor delivers poor support
(compared to 5%)
– More (25%) have a strained relationship with their vendor (compared to 5%)
– Finally, more (39%) think their vendor is generally slow to respond (compared to 12%)
Making the most of the budget:
IT funding in the last 12 months? [Section 1.8]
In the last 12 months, IT funding within large UK organizations with service desk solutions in place has been affected in some way in 86% of cases.
More than 1 in 2 organizations (53%) say their IT budgets have been curbed during this time, while 31% say new IT projects have been refused funding.
But even where money may not have been withdrawn, in 38% of organizations, the decision making process is reported to have slowed down, and 27% of IT managers say more senior people are involved in sign-off of IT expenditure.
In contrast, just 12% of IT managers in large UK organizations with service desk solutions say they have not witnessed any such changes to the funding of IT.
Once again, there is a correlation between those who have encountered unexpected extra costs and the levels of impact they have experienced on IT funding in the last 12 months.
Specifically, more IT managers who later discovered unexpected extra costs (97%) say IT funding has been affected in some way, compared to just 71% of those who did not have cost issues; and more (41%) say new IT projects have been refused funding (compared to 17%); and more (47%) say the decision making process has slowed down (compared to 24%).
Keeping things ticking over or breaking new ground?
[Sections 1.9 & 1.10]
In large UK organizations where service desk solutions are in place, on average 38% of the IT budget goes towards the upkeep and maintenance of existing IT systems, and the median figure is close at 33%, but this expense ranges from 2% to a massive 90%.
There are two peaks: one at 11-30% and another at 41-50% of the IT budget, but 15% of organizations allocate more than 50% of the IT budget towards the upkeep and maintenance of their existing IT systems.
In contrast, while most organizations (98%) invest in technology designed to innovate and give the company competitive advantage, only 11% say this investment has continued full steam ahead in the last 6 months.
Considerably more (61%) say this sort of investment is continuing, but at a slower pace than originally planned. On the other hand, 21% have generally ceased such investment in the last 6 months: 17% say such projects have been stopped and postponed indefinitely, and another 4% say they have been cancelled completely.
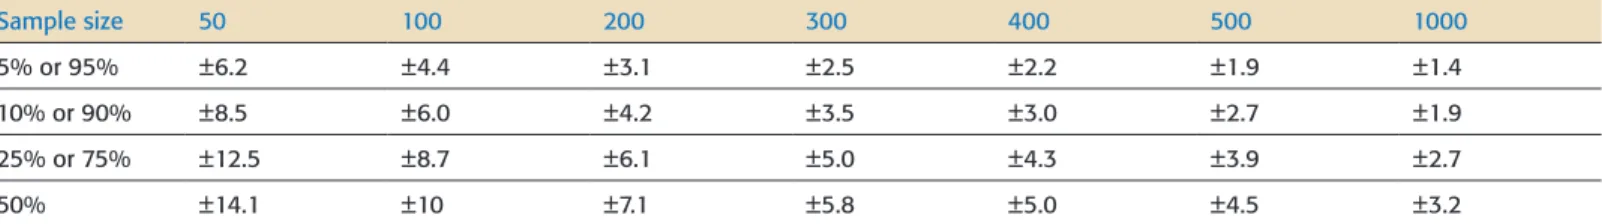
Table 2.1 shows the margin of error at a 95% confidence level and Table 2.2 shows the sub-sample sizes. These tables can be used to determine whether an observed difference between two sub-samples is a real difference or not; in other words, to see if the difference is statistically significant.
This means that for an observed percentage of 10% on a sub-sample of 50 respondents, the real percentage could be +/-8.5%, so the real percentage could be anywhere between 1.5% and 18.5%. This means that if the survey were repeated under exactly the same conditions, there is a 95% chance of getting a number anywhere between 1.5% and 18.5%.
It follows that if 5% of IT managers with unexpected extra costs selected a particular answer, compared to 15% of those who did not encounter such costs, from a statistical point of view the observed difference is NOT statistically valid at a 95% confidence level.
2) Research Methodology
2.1 Overview:
This report was commissioned by Numara® Software and details quantitative research with IT managers in large organizations in the UK.
2.2 Quantitative Research:
A sample of 100 interviews was collected with IT decision makers and influencers with knowledge of the organization’s service/help desk software solution. Therefore, all companies in the sample have such a solution in place. All respondents confirmed prior to interview that their organization employed 250 or more employees and that it used help desk or service desk software. They also confirmed that they were an IT professional with knowledge about and experience of managing their organization’s help/service desk solution. Finally, they also confirmed their level of seniority within the IT function: 13% operate at CIO/director level, whereas 57% are senior IT managers and 30% work at middle/junior IT manager level.
2.3 Comparative Analysis:
The findings of the survey have been analyzed and compared systematically according to whether or not the respondents encountered unexpected extra costs after initially purchasing their service desk software solution (as defined in Section 3.2).
Therefore, where any differences exist that are significant at a 95% confidence level, and are interesting and relevant to the overall findings, they are described accordingly in this report.
The interviews were conducted using GMI’s online research panel between 2nd and 6th February 2009. Before and during the interviews, respondents were not aware that Numara Software had commissioned the research. Throughout this report, where any numbers do not add up to 100%, it is either because respondents were allowed to select more than one tick-box option in the question, or because of minor rounding errors, which should be ignored.
Table 2.1: Margin of error at a 95% confidence level:
Sample size 50 100 200 300 400 500 1000
5% or 95% ±6.2 ±4.4 ±3.1 ±2.5 ±2.2 ±1.9 ±1.4
10% or 90% ±8.5 ±6.0 ±4.2 ±3.5 ±3.0 ±2.7 ±1.9
25% or 75% ±12.5 ±8.7 ±6.1 ±5.0 ±4.3 ±3.9 ±2.7
50% ±14.1 ±10 ±7.1 ±5.8 ±5.0 ±4.5 ±3.2
Table 2.2: Sub-sample sizes (n):
Unexpected extra costs n=
Yes – incurred some 59
3. Key Findings
3.1. In addition to the basic purchase/ticket price,
which of the following costs has your organization
incurred since it purchased its current service desk
solution?
Collectively, 98% of IT managers in large UK organizations have incurred some form of extra cost in addition to the basic purchase/ ticket price after they had purchased their current service desk solution. The most common extra is the cost of any maintenance contracts
(68%).
But 61% of organizations encountered extra costs from in-house administration, which includes things such as the day-to-day management of the system and applying minor tweaks to code. More than 1 in 2 (53%) incurred professional fees for installation as an
extra to their initial purchase price.
And almost as many (51%) had to pay extra for professional fees for integration with other systems.
Not far behind for just under 1 in 2 organizations (49%) has been professional fees for subsequent modifications to the service desk system since it was purchased.
In contrast, just 2% of organizations did not encounter any of these costs as extras.
More IT managers in large organizations who encountered unexpected extra costs (88%) have incurred 2 or more of these extra costs in addition to the basic purchase /ticket price after they had purchased their current service desk solution, compared to those who have not encountered unexpected extra costs (68%) [not shown].
Similarly, more IT managers who encountered unexpected extra costs (44%) have incurred 4 or more of these extra costs, compared to those in large organizations that have not (17%) [not shown]. In more detail, more IT managers who encountered unexpected extra
costs (66%) had to pay extra for professional fees for integration with other systems, compared to those who have not (29%).
And, more IT managers who encountered unexpected extra costs (64%) had to pay professional fees for subsequent modifications, compared to those who have not (27%).
3.2. [Just to those who experienced extra costs over
and above the purchase/ticket price] Which of these
were unexpected and/or extra costs that were only
realised after the initial purchase price was agreed
upon with the vendor?
Overall, 60% of IT managers who experienced extra costs say at least some of these were unexpected and only realized after the initial purchase was agreed with the vendor.
The most common unexpected extra cost is professional fees for subsequent modification to the service desk system where 26% of IT managers say their organization has encountered this cost when they were not expecting to – this means that 53% of those who have had to pay for later modifications were not expecting to do so when they agreed the initial price with the vendor.
This is followed by 23% of IT managers who unexpectedly had to pay professional fees to have their new service desk solution integrated with other systems – this means 45% of those that encountered this extra cost were not expecting to do so.
Maintenance contracts were a surprise for 22% of IT managers with service desk solutions, meaning 32% of people that encountered this as an extra cost were not expecting to do so.
20% had not expected the extra cost of in-house administration, such as the day-to-day management and applying minor tweaks to code – 33% of people that encountered this cost were not expecting to. Finally, professional fees for installation of the service desk solution
were a surprise for 19% of IT managers in the UK – equivalent to 36% of those that experienced this as an extra cost item.
In contrast, 36% of IT managers did not encounter any of these unexpected extra costs.
Another 3% are not sure which, if any were extra and unexpected costs.
3.3. [Just to those who encountered unexpected, extra
costs over and above the purchase/ticket price] What
has been the impact of these unexpected costs on the
original purchase price for your current service desk
software solution?
44% of IT managers who incurred unexpected extra costs say the extras added up to 25% of the original ticket price to the overall cost of the solution.
A significant and additional 37% say it added up to 50% on to the originally agreed price.
An unlucky 10% say the extras added up to 75% of the original fee and another 5% say the unexpected extras doubled what they originally set out to pay.
3.4. [Just to those who encountered unexpected, extra
costs over and above the purchase/ticket price] Do
you think your organization was given adequate and
complete information about the true overall cost of
your service desk solution prior to making its decision
to purchase?
Among those who incurred unexpected extra costs, 53% of them feel their organization was not given adequate and complete information about the true overall cost of the service desk solution prior to making its decision to purchase.
In contrast, 46% feel they were, and another 1% are unsure. Interestingly, 63% of CIOs/IT directors in the sample feel they were not
given adequate and complete information [not shown].
3.5. Which of the following were among your
organization’s Top 3 buying criteria when it came to
purchasing your current service desk solution
?Product features (52%) was top of the list for IT managers in the UK when it came to purchasing their existing service desk solution – this leads by some way.
Aside from this, IT managers’ Top 3 buying criteria lists are actually very varied with little consensus between these IT managers.
That said, the next most common criterion that has made IT managers’ Top 3 lists is low purchase/ticket price (37%).
Speed comes in third on the overall list with 31% of IT managers putting this in their Top 3 list.
Product flexibility is important to 30% and this is followed closely by the quality of vendor support (28%).
But fewer than 1 in 3 (27%) factor in the cost of ongoing administration into their Top 3 criteria.
Scalability (23%), buying from a well-known vendor (17%) and the cost of professional fees to support the system (15%) came into fewer IT managers’ Top 3 lists.
The least important buying criterion is compatibility with only 14% of IT managers putting this as a Top 3 consideration.
More CIOs/IT directors and senior managers (39%) place the speed of installation in their Top 3 list, compared to middle/junior managers (13%); while more of the latter group (40%) cite scalability as being in the Top 3 list for their company [not shown].
In contrast, 1% of IT managers say none of these make their Top 3 list of buying criteria and another 2% are unsure which of them, if any, do. More IT managers who encountered unexpected extra costs (22%) put
the cost of professional fees to support the system in the Top 3 buying criteria lists when it came to purchasing their existing service desk solution, compared to those who have not encountered unexpected extra costs (5%).
3.6. Which of the following aspects of your service
desk system do you find difficult and time-consuming
to deal with?
Collectively, 89% of UK IT managers with service desk solutions find at least some aspect of them difficult and time-consuming to deal with. Top of the list as the most common problem encountered is customising
the system to suit the evolving needs of the business (44%). This is followed by 41% of IT managers who find it difficult and
time-consuming to get meaningful management information and reports from their systems.
38% of the solutions in place are difficult and time-consuming to integrate with other systems.
Over 1 in 3 IT managers (35%) say they have problems with tweaking the syste without consulting the vendor.
Almost as many (30%) have problems with and find it time-consuming to carry out basic functions like problem tracking, and similarly, 23% have problems with the day-to-day management of the system by IT staff.
21% find it difficult and time-consuming to meet service level agreements they have in place.
But 22% have issues with their system handling remote working, and as many (22%) have the same with managing multiple sites – and 14% find managing multiple languages to be a problem.
In contrast, just 9% say they do not find these or any other aspects of their service desk to be difficult or time-consuming to manage – another 2% are unsure which, if any, fall into this category.
Overall, IT managers who encountered unexpected extra costs find more of these aspects of their systems to be time-consuming and difficult to manage, compared to those who have not encountered unexpected extra costs (i.e. length of bars in above chart).
Indeed, more IT managers who encountered unexpected extra costs (100%) find at least some aspect of their service desk solution difficult and time-consuming to deal with, compared to those who have not (73%) [not shown].
In more detail, more IT managers who encountered unexpected extra costs (31%) have problems with the day-to-day management of the system by IT staff, compared to those who have not (12%).
Similarly, more IT managers who encountered unexpected extra costs (32%) have problems with meeting service level agreements, compared to those who have not (5%).
Finally, more IT managers who encountered unexpected extra costs (47%) find the solution in place is difficult and time-consuming to integrate with other systems, compared to those who have not encountered unexpected extra costs (24%).
3.7. Which of the following statements reflect how
your organization feels about the service desk solution
it has in place and/or the vendor who you purchased
it from?
Collectively, 68% of IT managers with a service desk solution say at least 1 of these negative attitudes applies to how they feel about their service desk solution and/or vendor – and such negativity is more common among CIOs/IT directors and senior IT managers (74%), compared to middle/junior IT managers (53%) [not shown].
While 18% say if they could turn back the clock they would not purchase the same system again today, 30% say they cannot afford to change systems now, and 28% feel they are lumbered with their existing system.
Indeed, this means that collectively 46% of IT managers either feel lumbered with their systems and/or they can’t afford to change vendors now [not shown].
When it comes to the vendors of the systems in place, 28% of IT managers think they are generally slow to respond and 17% have a strained relationship with their vendor –almost 1 in 10 IT managers (9%) say they lack trust in their vendor.
In contrast, 29% of IT managers with service desk solutions in place do not think any of these apply to how they feel about their service desk solution and/or vendor and 3% are unsure which, if any, apply.
Overall, IT managers who encountered unexpected extra costs feel more of these negative attitudes towards their systems and/or vendor, compared to those who have not encountered unexpected extra costs (i.e. length of bars in the above chart).
Indeed, more IT managers who encountered unexpected extra costs (86%) say at least 1 of these negative attitudes applies to how they feel about their service desk solution and/or vendor, compared to those who have not encountered unexpected extra costs (41%) [not shown].
In more detail, more IT managers who encountered unexpected extra costs (39%) say they cannot afford to change systems now, compared to those who have not (17%).
And, more IT managers who encountered unexpected extra costs (37%) feel they are lumbered with their existing system, compared to those who have not (15%).
Indeed, collectively, more IT managers who encountered unexpected extra costs (61%) either feel lumbered with their systems and/or they cannot afford to change vendors now, compared to those who have not encountered unexpected extra costs (24%) [not shown]. Also, more IT managers who encountered unexpected extra costs
(32%) say their service desk vendor delivers poor support, compared to those who have not (5%).
Perhaps not surprisingly, more IT managers who encountered unexpected extra costs (25%) have a strained relationship with their vendor, compared to those who have not encountered unexpected extra costs (5%).
Finally, more IT managers who encountered unexpected extra costs (39%) think their vendor is generally slow to respond, compared to those who have not (12%).
3.8. Which of the following applies to funding of IT
within your organization?
In the last 12 months, IT funding within UK organizations with service desk solutions in place has been affected in some way in 86% of cases.
More than 1 in 2 organizations (53%) say their IT budgets have been curbed during this time.
31% say new IT projects have been refused funding.
But even where money may not have been withdrawn, in 38% of organizations, the decision making process is reported to have slowed down, and 27% of IT managers say more senior people are involved in sign-off of IT expenditure.
In contrast, 12% of IT managers with service desk solutions say they have not witnessed any such changes to the funding of IT – 2% are unsure.
Overall, IT managers who have encountered extra costs say more of these things have happened to the funding of IT in their organization, compared to those who did not experience unexpected extra costs for their service deck solution (i.e. length of bars in the above chart). Indeed, more IT managers who encountered unexpected extra costs
(97%) say IT funding has been affected in some way, compared to those who have not encountered unexpected extra costs (71%) In more detail, more IT managers who encountered unexpected extra
costs (41%) say new IT projects have been refused funding, compared to those who have not (17%).
And, more IT managers who encountered unexpected extra costs (47%) say the decision making process has slowed down, compared to those who have not (24%).
Conversely, more IT managers who did not encounter any unexpected extra costs (24%) say they have not witnessed any such changes to the funding of IT, compared to those who have encountered unexpected extra costs (3%).
3.9. What percentage of the current IT budget goes
towards the upkeep and maintenance of existing IT
systems?
In large UK organizations with service desk solutions in place, on average, 38% of the IT budget goes towards the upkeep and maintenance of existing IT systems [not shown].
The median figure is close at 33%, but this expense ranges from 2% to a massive 90% [not shown].
There are two peaks: one at 11-30% and another at 41-50% of the IT budget.
Collectively, 15% of these large organizations actually have to allocate more than 50% of the IT budget towards the upkeep and maintenance of their existing IT systems.
Only 2% of organizations say none of their budget goes towards this type of expense.
Three quarters of the 19% who say they do not know this figure are middle/junior IT managers [not shown].
IT managers who have not encountered any unexpected extra costs (32%) say they do not know what percentage of the IT budget goes towards the upkeep and maintenance of existing IT systems, compared to those who have (10%).
More IT managers who have not encountered any unexpected extra costs (32%) say they do not know what percentage of the IT budget goes towards the upkeep and maintenance of existing IT systems, compared to those who have (10%).
3.10. When it comes to investing in technology
designed to innovate and give the company
competitive advantage, in general, which of the
following approaches has your organization taken
in the last 6 months?
Collectively, 98% of IT managers say their organization invests in technology designed to innovate and give the company competitive advantage.
Indeed, collectively 72% of organizations have continued with such investment in the last 6 months: 11% say this investment is continuing full steam ahead, but considerably more (61%) say it is continuing, but at a slower pace than originally planned.
In contrast, 21% have generally ceased such investment in the last 6 months: 17% say such projects have been stopped and postponed indefinitely, and another 4% say they have been cancelled completely. 1% say none of these apply, 4% are unsure and another 2% say their
company does not invest in this way.
Statistically, there is no significant difference according to whether or not unexpected extra costs have been encountered and which of these approaches to investing in technology their organization has taken in the last 6 months.
4) Appendix A: Quantitative Questionnaire
Qualifying questions
A) Does your organization have at least 250 employees across all its offices and sites in the UK? [Select only 1]
Yes [Continue] No [Terminate]
A) Does your organization use help desk software? [Select only 1]
Yes [Continue] No [Terminate]
B) Are you an IT professional with knowledge about and experience of managing your organization’s help desk solution? [Select only 1]
Yes [Continue] No [Terminate]
C) At what level of seniority do you operate? [Select only 1]
CIO/IT director level [Continue] Senior IT manager [Continue] Middle/junior IT manager [Continue] Admin/clerical IT staff [Terminate]
Main questions
Introduction: For this research, the term “service desk” will be used synonymously with “help desk”.
1) In addition to the basic purchase/ticket price, which of the following costs has your organization incurred since it purchased its current service desk solution? [Select all that apply]
a) Professional fees for installation
b) Professional fees for integration with other systems c) Professional fees for subsequent modifications d) The cost of any maintenance contracts
e) The cost of in-house administration (e.g. day-to-day management and applying minor tweaks to code) f) None of these [Skip next 3 questions]
g) Don’t know [Skip next 3 questions]
2) [Just to those who experienced extra costs (a-e) at qu 1] Which of these were unexpected and/or extra cost that were only realized after the initial purchase price was agreed upon with the vendor? [ONLY SHOW INDIVIDUAL’S ANSWERS FROM QU 1 - Select all that apply]
a) Professional fees for installation
b) Professional fees for integration with other systems c) Professional fees for subsequent modifications d) The cost of any maintenance contracts
e) The cost of in-house administration (e.g. day-to-day management and applying minor tweaks to code) f) None of these [Skip next 2 questions]
g) Don’t know [Skip next 2 questions]
3) [Just to those who encountered unexpected, extra costs (a-e) at qu 2] What has been the impact of these unexpected costs on the original purchase price for your current service desk software solution? [Select only 1]
a) It added up to 25% b) It added up to 50% c) It added up to 75% d) It doubled it e) It tripled it
f) It more than tripled it g) Don’t know
4) [Just to those who encountered unexpected, extra costs (a-e) at qu 2] Do you think your organization was given adequate and complete information about the true overall cost of your service desk solution prior to making its decision to purchase? [Select only 1]
a) Yes b) No c) Don’t know
5) Which of the following were among your organization’s Top 3 buying criteria when it came to purchasing your current service desk solution? [Select up to 3 from the list below]
a) Low purchase/ticket price b) Speed of installation
c) Cost of ongoing administration
d) Cost of professional fees needed to support the system e) Buying from a well-known vendor
f) Quality of vendor support g) Product features h) Product flexibility i) Scalability j) Compatibility k) None of these l) Don’t know
6) Which of the following aspects of your service desk system do you find difficult and time consuming to deal with? [Select all that apply]
a) Day-to-day management by IT staff
b) Customizing the system to suit the evolving needs of the business c) Tweaking the system without consulting the vendor
d) Getting meaningful management information and reports e) Meeting service level agreements
f) Problem tracking
g) Integration with other systems
h) Working remotely, e.g. employees trying to log on and/or IT staff trying to fix problems
i) Managing multiple sites j) Managing multiple languages k) Other
l) None m) Don’t know
7) Which of the following statements reflect how your organization feels about the service desk solution it has in place and/or the vendor who you purchased it from? [Select all that apply]
a) If we could turn back the clock, we would not purchase the same system again today
b) We cannot afford to change systems now c) We are lumbered with the existing system d) Our service desk vendor delivers poor support e) We have a strained relationship with the vendor f) The vendor is generally slow to respond to our needs g) We lack trust in the vendor
h) None of these i) Don’t know
8) Which of the following applies to funding of IT within your organization? [Select all that apply]
a) IT budgets have been curbed in the last 12 months b) New IT projects have been refused funding c) The decision making process is slower d) More senior people are involved in sign-off e) None of these
f) Don’t know
9) What percentage of the current IT budget goes towards the upkeep and maintenance of existing IT systems? [Record a % figure]
a) __________ b) None c) Don’t know
10) When it comes to investing in technology designed to innovate and give the company competitive advantage, in general, which of the following approaches has your organization taken in the last 6 months? [Select only 1]
a) It is continuing to invest in such projects full steam ahead b) It is continuing to invest in such projects, but at a slower pace than
originally planned
c) Such projects have been stopped and postponed indefinitely d) Such projects have been cancelled completely
e) None of these f) Don’t know
Who are we?
Numara Software is a leading provider of integrated IT management solutions for Desktop Management, PC Lifecycle Management, Security & Compliance, Help Desk and Service Desk. Designed to optimize IT management, Numara FootPrints and Numara Track-it! collectively support more than 50,000 customer sites and nearly 20 million IT assets worldwide.