Journal of Industrial and Systems Engineering
Vol. 8, No. 3, pp 1-23 Summer 2015
Methodology based on MCDM for risk management in EPC
projects:
A Case Study of LPG Storage Tanks Construction
Mohammadreza Badalpur
1,Ashkan Hafezalkotob
2*1,2
Industrial Engineering College, Islamic Azad University, South Tehran Branch,
Tehran, Iran.
[email protected], [email protected]
Abstract
The most important aim of every project is on time completion, budget consideration and reaching the highest possible quality, based on contract. This paper suggests a methodology for risk management in engineering, procurement, and construction (EPC) projects. Risk management enables project teams to perform with minimum deviation from predetermined goals. The proposed methodology identifies and evaluates critical risks of EPC projects using multi criteria decision making (MCDM) techniques. Then, by the means of developed earned value management (EVM) technique and considering Project Risk index (PRI), this work will proceed to estimate the degree of risk effects on project objectives. The optimal control measures (CMs) to address the risks are found through a goal programming model. The methodology was implemented on a case study in oil and gas industry in Iran. Results of this study show the impact of critical risks on objectives of EPC projects.
KEYWORDS: Risk management in EPC projects; Critical risks; MCDM techniques; EVM method; Linear Programming; Control Measures.
*Corresponding author.
1- Introduction and Literature Review
Currently, EPC projects have become one of the most popular methods of project execution for owners and contractors in different industries such as commercial, energy and other industrial projects. Preference of the owners and their tendency to conclude a contract with contractors as a lump sum or fixed price contract increases the risk for contractors, which shows the importance of risk and risk management (RM). Thus, the goal of each organization is to complete her/his project on time and at the lowest possible cost to achieve more profit, based on design specifications. Therefore, in addition to time scheduling, budgeting and resource planning, a decision-maker (DM)/project manager must identify the critical risks and adopt a suitable decision accordingly.
There are some studies that propose different decision making models for RM problems. Sadaba et al. (2014) suggested a project management methodology for small businesses (SMEs) based on an extensive research with a large number of Spanish companies. They considered factors usually neglected by SMEs. The methodology based on project RM includes simple tools, templates and risk checklists with recommended actions and indicators. Zhang and Fan (2014) proposed an optimization method for selecting project risk response strategies in project RM. Their method is based on a resolution process and an integer programming model which integrates three critical elements namely cost, schedule and quality. The most desirable risk response strategies to cope with the risk events are obtained by solving their proposed model. Gang Hwang et al. (2014) investigated RM in small projects in terms of status, barriers and impact of RM on project performance. The results of the research reported a positive correlation between RM implementation and improvement in quality, cost and schedule performance of small projects. Rezaie et al. (2007) considered the relationship of major uncertainties of a project by using extended Monte Carlo simulation method for the improvement of RM. Tsaur (2011) proposed a new normalized method and risk attitude for analyzing technique of order performance by similarity to ideal solution (TOPSIS) with interval data. The results indicate considerable decisions for different decision makers with different risk attitudes. Changsoon Park et al. (2014) developed a method of risk measurement based on the expected utility and reference, prior to risk measuring. They proposed an expected utility and uncertainty decision making model under risk.
Some literature has recently emerged which developed some methodologies of RM. Peixoto et al. (2014) proposed a developed RM methodology for a pilot project in a Portuguese electric energy organization. Yanting and Liyun (2011) presented a number of specific recommendations and measures with actual situations of the RM of petroleum operations. Teymouri and Ashoori (2011) investigated the effects of IT on project RM, necessary for any industrial and business activity as a continuous process. They estimated the effects of using IT on 50 Iranian oil companies by analyzing the data provided through questionnaires. Sapori et al. (2014) proposed implementation of risk-based methodologies by process engineers to achieve a quantitative assessment of security management systems. They indicate how to analyze the system and how to integrate technological, human and procedural aspects by the flow charts. Then they describe how to manage threats, vulnerability and criticality of critical infrastructure subsystems; how to identify primary causes and top event consequences drawing fault trees and event trees; and finally how to calculate residual risk for security management systems. Rodrigues and Crispim (2014) proposed a theoretical framework to classify and associate those practices to each phase of the project life cycle and to each project RM process with the purpose of providing some guidelines for selection of the best practices with regard to the organizational maturity and project complexity. Taylan et al. (2014) suggested novel analytic tools to evaluate the construction projects and their overall risks under incomplete and uncertain situations. Moore (2013) examined the key elements of ANSI/API (American National Standards Institute/American Petroleum Institute 780) Security Risk Assessment process and discussed how leading organizations may use risk-based performance metrics to systematically analyze the status of security facilities. He could finally identify appropriately scaled and fiscally responsible
counter measures based on current and projected threats. Mohebi and Bislimi (2012) described “risk” as a potential deviation from predefined goals and studied the overall parameters affecting projects’ risks and analyzed different methodologies of the project RM. They develop a customized methodology applicable for Engineering, Procurement and Construction projects in oil and gas industries. Murphy et al. (2011) presented a methodology for extracting innovation constraints from building projects through stakeholders management competencies, failure mode and effect analysis (FMEA).
Oztas and okmen (2004) presented a literature survey on the issues of risk, RM, analysis and the design–build contract system, to propose a schedule and cost risk analysis model, and to address applicability of these models in scheduling and cost estimation of a fixed-price in design–build construction project. Liu and Pheng low (2009) suggested a conceptual framework to establish linking organizational learning with RM, focusing on the organizational behavior in Chinese construction firms. Mahamid (2011) identified the risk matrix for factors causing time delay in road construction projects. In total, 43 factors that might cause delay in road construction projects were defined through a detailed literature review and tabulated in a questionnaire form and analyzed in terms of impact and probability of occurrence. Adedokun et al. (2011) evaluated adoption of qualitative risk analysis techniques (QRAT) on construction projects in Nigeria with the aim of providing a better understanding on the state of these techniques through a questionnaire survey and an in-depth interview of required data for the study. Thus all the studies aim to employ appropriate tools and techniques to identify kind of risks that can affect the project objectives.
The rest of this paper is structured as follows. A brief introduction of RM and project risks is presented in Section 2. Section 3 explains application of the risk analysis in RM processes. In Section 4 a graphical framework of the methodology is provided to contribute the project team entering the RM processes. Afterwards, the tools for implementing the proposed methodology will be explained step by step. In Section 5 the results of the proposed methodology are reported with a case study. Section 6 presents the main conclusions and directions for future research.
2- Risk Management and Project Risk
“Risk management” has been widely applied in various fields such as economics, insurance, and many other industries. RM is a structured process for managing uncertainty through risk assessment (Costa et al., 2009). “Project risk” is an uncertain event or condition that, upon occurrence, has an effect on, at least, some project objectives (scope, schedule, cost and quality) (PMBOK, 2013). Therefore, “project Risk Management” is composed of a systematic process by which the risk elements or conditions may be identified, evaluated and avoided, mitigated or eliminated to preserve achievement of the project goals regarding cost, schedule, and quality (Kris and Nilson, 2006).
3- Risk Analysis
Risk analysis is performed after risk identification. In fact, risk analysis techniques are to show what happens if the project does not proceed according to plan due to potential risks and warns the decision-maker or the project manager about necessary measures to cope with the risks, which can be either qualitative or quantitative (Oztas and Okmen, 2004).In other words, risk analysis is the key in identifying, addressing, and handling risks before they become threats to success (Guo, 2004). Car and Tah (2001) employed a fuzzy approach to construction risk assessment and analysis. They present a hierarchical risk breakdown structure (RBS) for representing a formal model for qualitative risk assessment. Chan et al.
(2010) developed a fuzzy risk assessment model for construction projects, procured with target cost contracts (TCC) and guaranteed maximum price (GMP) contracts. Du and Li (2008) proposed a comprehensive approach to valuation of an infrastructure concession right and quantitative RM projects in the People’s Republic of China. Ghezavati et al. (2013) employed a systematic method of linear programming model to select the best strategies for responding to project risk. Odeyinka et al. (2012) developed regression models to assess the impact of identified risks on baseline forecast at the in-progress stage of a construction project.
Based on research performed in the context of RM, a comprehensive methodology is still needed in EPC projects in order to estimate the risk effects on the project objectives (time, cost, quality). This paper attempts to identify and analyze the risks and effects on the objectives of EPC projects by studying the problems occurred in a real EPC projects, using project management tools and techniques which are well known by the managers.
4- Research Methodology
Fig. 1 shows the research methodology proposed for this study through the following steps:
1.
Definition and prioritization of risk through in-depth interviews with experts and preparing questionnaires and use of fuzzy DEMATEL technique and thereby identifying the critical risks.2.
Quantitative risk analysis done for critical risks using risk quantity index (RQI), PRI and developed EVM. The rest of the work is as follows: defining CMS proportional to the risks, along with the cost required to implement them for response to risk. Meanwhile the impact of each Control Measure (CM) on project objectives in reducing risk loss should be specified. This is done by Analytical Hierarchy Process (AHP) technique with experts’ ideas taking into account project objectives and priorities (time, cost and quality).Thereby EVM indices and RQI quantity will be recalculated with regard to the CMS.3.
Risk control stage in which the optimal CMS will be specified using linear programming model and predefined goals.4.
Risk monitoring will be carried out through implementation of CMS during the course of the project, calculating the project performance and repeating of all steps during reporting of the project.Fig. 1. The framework of RM methodology
4-1- Fuzzy Set Theory and triangular Fuzzy Numbers
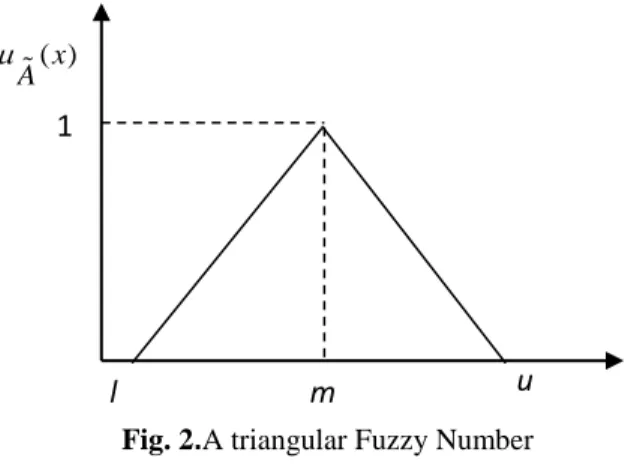
Fuzzy set theory (FST) is based on the context of membership function and taking linguistic variables into account. As stated by (Zadeh, 1965) FST is an approach to convert the qualitative variables in to quantitative variables by means of linguistic variables. Values of linguistic variables are defined in accordance with human expression and statement. It is notable that the theory considers uncertain data in an uncertain environment based on people’s thoughts and ideas. The linguistic terms can be represented through different fuzzy-shaped numbers. The triangular and trapezoidal fuzzy numbers are often used as fuzzy linguistic variables. In this study, the triangular fuzzy numbers are employed as a triplet number (l, m, u) and shown in Fig. 2 .The membership function is shown in Eq. (1).
(1)
Risk Identifying
and Prioritizing
Quantitative Risk Analyzing
Risk Control
Risk Monitoring
Critical Risk analyzing
Linear Programming
Model Fuzzy
DEMATEL
Developed EVM, Control measures
Definition
Goal Programming with
Interval Goals Definition
0 , ( 1)
, ( )
( )
, 0 ,
x l x
l x m m l
x
A u x
m x u u m
x u
µ
< −
≤ ≤ −
=
−
≤ ≤ −
>
The pair-wise comparisons between any two determinants can be expressed by integer scores ranging from 0 to 4 and representing no influence (0), very low influence (1), low influence (2), high influence (3) and very high influence (4) respectively. These crisp scores are translated as fuzzy numbers based on Fig. 3and Table.1.
Table 1. The assigned fuzzy numbers to each linguistic term of Fig.3.
fuzzy triangular number
Linguistic term
[0,0,0.25] No influence
[0,0.25,0.5] Very low influence
[0.25,0.5,0.75] Low influence
[0.5,0.75,1] High influence
[0.75,1,1] Very high influence
In many projects especially in EPC projects, risk factors come from various areas of political, economic, social, technological and geographical environments. Since the nature of risk incorporates a situation of vagueness, the fuzzy set theory seems to be a suitable method for this situation.
m u
l 1
( )x A µ
Y
X VH
H L
VL NO
0 0.25 0.5 0.75 1
Fig. 2.A triangular Fuzzy Number
4-2- DEMATEL and Fuzzy DEMATEL Methods
Decision Making Trial and Evaluation Laboratory (DEMATEL), is a decision making method based on a pair-wise comparison that was presented by Fontela & Gabus between 1972 and 1976. This technique was presented for solving complicated problems (Fontela and Gabus, 1974). DEMATEL was developed with the belief that pioneering and appropriate use of scientific research methods could improve understanding of the specific obstructive, intertwined problems, and also contribute to identification of workable solutions by a hierarchical structure (Tzeng and Huang, 2011).The fuzzy DEMATEL method has been successfully applied in many fields. For the first time in the construction of risk assessment, Samani (2012) successfully applied crisp DEMATEL as a tool for risk assessment in Iranian oil and gas projects and produced logical results. Recently, the Fuzzy DEMATEL method was found to be a better approach for real problems. The DEMATEL method, whether crisp or fuzzy, is a better service for larger projects than smaller ones due to the fact that risks raised from various areas and levels in the larger projects have more inter-relationships, and DEMATEL has the ability to take that into account. Since phases of EPC project are highly inter-dependent, one should take a proper technique that is able to show this dependency. An advantage of the DEMATEL method is that it not only identifies the critical determinants, but also has the capacity of revealing the relationships between determinants, thereby providing more valuable information for deciding on a problem with complex interdependencies. The structure model of DEMATEL and fuzzy DEMATEL method are as follows (Tzeng and Huang, 2011).
4-2-1- DEMATEL
1.
Definition of pair-wise comparison fuzzy numbers such that of Table 1.2.
Constituting that the initial direct-relation matrix is a matrix obtained by pair-wise comparisons in terms of influences and directions between criteria, in which is denoted as the degree to which criterion i affects criterion j.3.
Constituting the normalized direct-relation matrix which can be obtained through Eq. (2) in which all principal diagonal elements are equal to zero.(2)
(3)
(4)
4.
Constituting the total relation-matrix can be acquired by employing Eq. (5) in which isdenoted as the identity matrix.
(5)
5.
The sum of rows and columns are separately denoted as vector d and vector r within the total-relation matrix T through the following formula.(6)
z
n n
∗
ij
z X
. X =S Z
1 1
1
n
j
S
MA X zij i n = =
≤ ≤
∑
1 1
min
1 ,1
n n
j i
S MA X zij MA X zij i n = j n = =
≤ ≤ ≤ ≤
∑
∑
T I
(
)
1T =X I −X −
( )
(7)
(8)
6.
A casual diagram can be obtained by mapping dataset of , where the horizontal axis is and the vertical axis is .4-2-2- Fuzzy DEMATEL
All steps in Fuzzy DEMATEL are similar to crisp DEMATEL with this difference that a triangular fuzzy number such as is defined and experts make sets of pair-wise comparisons matrix.
Acquiring and aggregating the assessments of decision makers with number of experts make sets of pair-wise comparisons matrix in terms of influences and directions between the criteria. For aggregating the results of these assessments, Eq. (9) which is based on representation of an additional operation can be utilized (see Eqs. (2) - (4)). Eq. (10) can be used for de-fuzzification. The initial direct-relation matrix can be obtained later, in which
is denoted as the degree to which criterion i affects criterion j.
(9) Where,
(10)
4-3- Combination Earned Value Management and Risk
Recently, with development of scientific methods and with regard to complexity of large-scale projects, the necessity of applying some techniques to aid the project managers was properly sensed. The earned value is a leading technique for monitoring and analyzing project performance and project progress (Aliverdi et al., 2013). EVM is a project management technique that measures project progress in an objective manner, and provides an early warning of the performance issues, if any (PMI, 2004). EVM measures the project performance and progress by an integrated management of three most important elements in a project, namely cost, schedule and scope. Although it allows exact measurement of the project progress, it can reflect unreal deviations of project aims with traditional indices. A developed earned value technique is followed here which can show the most real deviations of the plan and contribute to management in order to make better decisions for achieving project goals. The models adopted for estimation based on literature (Alam Tabriz et al. (2013), Vendevoorde and Vanhouke (2006), Badiru and Omitaomu (2011)) are as follows:
(
)
1 )
, , , (
1
n
j
d d dn where di tij
=
= … =
∑
1
( ,1 , ), ( )
n
i
wher
r r rn e rj tij =
= … =
∑
(
d
i+
r d
i,
i−
r
i)
i i
d
+
r
d
i−
r
i(
ij,
ij,
ij)
Z
=
I
m u
PP
1 2
(Z ,Z ,...,ZP)
[ ij]n n
Z = z ×
ij
z
1 1 2
[ (Z Z ... ZP)]
Z n n
P
= ⊕ ⊕ ⊕ ×
1
1 2 1 1 1
(Z Z ... Z ) [ (l 4 ... l 4 )]
6
P P P P
m u m u n n
ij ij ij ij ij ij
⊕ ⊕ ⊕ = + + + + + + ×
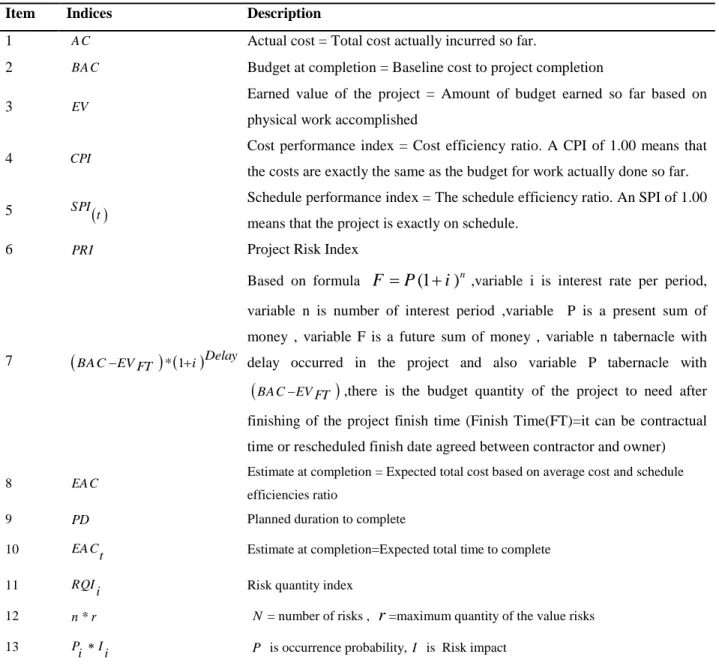
Table 2. Definition of EVM indices
Item Indices Description
1 Actual cost = Total cost actually incurred so far.
2 Budget at completion = Baseline cost to project completion
3 Earned value of the project = Amount of budget earned so far based on
physical work accomplished
4 Cost performance index = Cost efficiency ratio. A CPI of 1.00 means that
the costs are exactly the same as the budget for work actually done so far.
5 Schedule performance index = The schedule efficiency ratio. An SPI of 1.00
means that the project is exactly on schedule.
6 Project Risk Index
7
Based on formula ,variable i is interest rate per period,
variable n is number of interest period ,variable P is a present sum of money , variable F is a future sum of money , variable n tabernacle with delay occurred in the project and also variable P tabernacle with ,there is the budget quantity of the project to need after
finishing of the project finish time (Finish Time(FT)=it can be contractual time or rescheduled finish date agreed between contractor and owner)
8 Estimate at completion = Expected total cost based on average cost and schedule efficiencies ratio
9 Planned duration to complete
10 Estimate at completion=Expected total time to complete 11 Risk quantity index
12 = number of risks , =maximum quantity of the value risks 13 is occurrence probability, is Risk impact
The equation (7) has been proposed in this paper.
(11)
A C BA C EV
CPI
( )
SPI t PRI
(
BA C EV− FT)
* 1( +i)Delay(1
)
nF
=
P
+
i
(
BA C EV FT−)
EA C PD EA Ct RQI
i
*
n r N r
P I
i ∗ i P I
P
RQI I
(12)
(13)
(14)
First, by using Eq. (11), the experts will proceed to estimate RQI quantity which is equal to occurrence probability multiplied by the impact of each risk on objectives. Then PRI is calculated based on Eq. (12) and finally using Eqs. (13) and (14), the finishing time and budget of the project is calculated at project completion.
4-4- Goal Programming
Goal programming is one of the most important and significant methods in solving the multi-objective problems which was first used by (Charnes et al., 1995). General form of goal programming is as follows. Based on the model, is priority of the goals, is the weight of the deviation variables of the goals, is the decision variable , are the deviation variables, is the right hand side parameter, is technical variable, is factors of variable in goal. (15)
(16)
(17)
(18)
Now, based on the general form of goal programming model, we propose our described model. In the proposed model, , are weights of deviation variables, are deviation variables, are risk quantity index of risk i if occurred, and risk quantity index of risk i by employing CM j, respectively. Variable is the decision variable that if risk i is controlled by CM j, it will take 1, otherwise it takes 0. denote cost control before and after risk happened, respectively which is rapidly controlled. are the lost costs if the risk i happens and after employing CM j, respectively. represent the increasing time of the project, after risk i happened and time increasing of the
( )
( * ) 1 RQIi PRI n r − = +( )
* PD EAC t =SPI t PRI(
)
( )
(
)
* 1( )
* 2 BAC EV Delay EAC AC BAC EVFT i CPI SPI t PRI − = + + + − + kp
k
thw
ik j x di−,di+b
i rj a ciji
thj
th 1 1(
)
q m k ik i ik i k iMin Z
p w
−d
−w
+d
+ = ==
∑∑
+
(
)
1. :
1, 2,
,
n ij j i i i jS t
C X
d
−d
+b
i
m
=+
+
=
=
…
∑
(
)
11, 2,
,
n rj j r ja X
b
r
s
=≤
=
…
∑
(
)
,
,
0
1,
,
j i i
X
d
−d
+≥
j
= …
n
i
λ
µ
i di ,di ,ei ,ei− + + − , i ij RQI RQI ij S , ij ij
C C′
,
i ij
L L′
,
i ij
t t′
project by employing of CM j, respectively. The goal levels for total risk quantity, total budget for CM, lost cost of risk, and planned schedule of the project are indicated by , , and , respectively. The goal programming model for RM is as follows:
(19)
(20)
(21)
(22)
(23)
(24)
(25)
(26)
(27)
(28)
(29)
(30)
(31)
The main objective of the problem is to minimize deviation variables of the goals. The constraint (20) shows that the risk quantity index should be minimized and based on constraints (24) and (25) the best mode is achieved when the entire CMS are used. The constraint (21) indicates the required budget for using of CMS and based on constraints (26) and (27) the best mode is when more funding is allocated for the use of CMS. The constraints (22) and (23) show that the lost cost of risk and the deviation from the planned schedule should be minimized, respectively. Based on constraints (28) to (31) this happens when the and are at a minimized mode.
5- Case Study of Construction of LPG Storage Tanks
Phase 13 of the South Pars Gas Field Project includes offshore drilling and facilities (platforms and sub-sea pipelines) and onshore refinery facilities for reservoir fluid processing. The South Pars Gas Field located in The Persian Gulf, 105 km south of Iranian Coast will be developed to produce high quantity reservoir fluid, and transport the fluids to mainland for further treatment. Liquid propane gas is one of the
goal
RQ
goalC
L
goalT
goal(
)
4 4
1 1
( )
k k k i k k
k k
Min Z
λ
d − d +µ
e − e += = =
∑
+ +∑
+(
)
1 1 1 1. : [ 1 )]
n m
goal
ij ij i ij
i j
S t RQI S RQI S d − d RQ
= = + − − − + =
∑∑
(
)
1 1 2 2 [ ] n m goal ij ij iji j
S C C d − d + C
= =
′
+ − + =
∑∑
(
)
3 31 1
[ 1 ]
n m
goal
i ij ij ij
i j
L S S L d − d + L
= = ′ − − − + =
∑∑
1 4 1 4[(1 ) )]
n m
goal ij i ij ij
i j
S t t S d − d + T
= =
′
− − − + =
∑∑
(
1 1)
goal goal
min
RQ − e−+e+ =RQ
goal goal goal
min max
RQ ≤RQ ≤RQ
(
2 2)
goal goal
min
C − e −+e + =C
goal goal goal
min max
C ≤C ≤C
(
3 3)
goal goal
min
L − e −+e + =L
goal goal goal
min max
L ≤L ≤L
(
4 4)
goal goal
min
T − e −+e + =T
goal goal goal
min max
T ≤T ≤T
goal
subsidiary productions of a refinery and it is wrought of propane (C3H8) and butane (C4H10) hydrocarbon. These products can be used in cars as a type of fuel along with other combustible mixtures; hence their production and use are increasing worldwide since they are less polluting. Moreover they can be utilized as consumable products in houses especially in Iran.
Liquid petroleum gas (LPG) storage tank is one of the refinery parts which is a place for storing the propane gas produced and plays the role of propane refrigerator. This project is transferred to a sub-contractor in an EPC contract format. The contract duration was 25 months from the start of the project and the actual progress of the project was 52% after 39 months. Later, the project was extended for another 25 months and also the amount of contract increased due to the new conditions. Now the project status is critical due to new agreements; the total amount price will not be increased under any circumstances. Therefore, proper management is vital in the current condition of the project and RM can be very important in this case. Seventy five risks were identified in top levels by experts and grouped in five phases including management (M), engineering (E), procurement (P), construction (C) and commissioning (COM). In the next step, pair-wise comparisons matrixes (PWCM) were prepared and distributed among experts, then the PWCM scores was gathered. With employing of Fuzzy DEMATEL, the total relation – matrix and casual digraphs of each phase was identified based on Eqs. (2) - (8). The results are shown in Fig.4.
Fig.4. Cause and effect diagraphs
Management phase Engineering phase
Procurement phase (Bulk material) procurement phase (long lead time)
The critical risks known and prepared for analysis by experts are shown in Table 5. Meanwhile, the fuzzy DEMATEL results including Tables 9 through 13 are illustrated in Appendix A. The occurrence probability of each risk will be determined by decision makers and experts based on Table 3.
Table 3. Guidance to identifying riskoccurrence probability
Level threat status
Item no.
1 This event is preventable
1
2 Usually this event is preventable
2
3 This event might be preventable but maybe excess activity is required
3
4 This event is not preventable but can be handled with other ways
4
5 This event is not preventable and it does not exist any ways
5
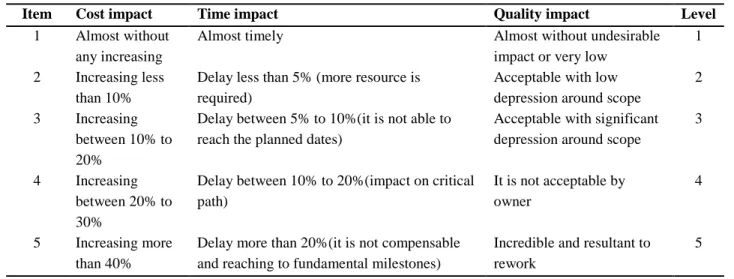
The risk impact on the project objectives is classified into five levels which will be determined by decision makers and experts based on Table 4. For example, if a risk does not incorporate the desirable impact on the project objectives, number 1 will be selected.
Table 4.Guidance to identifying risk impact on objectives
Level Quality impact
Time impact Cost impact
Item
1 Almost without undesirable impact or very low
Almost timely Almost without
any increasing 1
2 Acceptable with low
depression around scope Delay less than 5% (more resource is
required) Increasing less
than 10% 2
3 Acceptable with significant depression around scope Delay between 5% to 10%(it is not able to
reach the planned dates) Increasing
between 10% to 20%
3
4 It is not acceptable by
owner Delay between 10% to 20%(impact on critical
path) Increasing
between 20% to 30%
4
5 Incredible and resultant to rework
Delay more than 20%(it is not compensable and reaching to fundamental milestones) Increasing more
than 40% 5
Thus in accordance with Tables 3 and 4, and then along with are calculated for the critical risks based on Eqs. (12)-(14). Now it is possible to get the effect of each risk on the objectives based on its’ . In other words, quantities of and are calculated in this step, the results of which have been listed in Table 5.
i
RQI
PRI EA C EA C, (t)Table 5.Critical risk impacts on objectives
Risk Risk Description Phas
e
1 Inflation and unpredictable sway in prices M
3 1.8
7
24.1 0
2 6
2 Force major M
1 0.9
3
12.0 5
3 3
3 inaccessibility to engineering consultant to be confirmed
by owner E
3 1.8
7
24.1 0
2 6
4 Change in internal precept P
2 0.6
2 8.03
1 2
5 supplying of materials from vendors to be confirmed by
owner P
2 1.2
4
16.0 7
2 4
6 Transferring of Inefficiency information to vendors P
1 0.6
2 8.03
2 2
7 Delay in entry of material and equipment to site C
3 1.8
7
24.1 0
2 6
8 Lack of resources (material, labor, non-labor)
C 2 1.2
4 16.0
7
2 4
9 financial Infirmity of subcontractors C
2 1.2
4
16.0 7
2 4
10 Incoherence of executed part with designed drawings Com
.
2 1.2
4
16.0 7
2 4
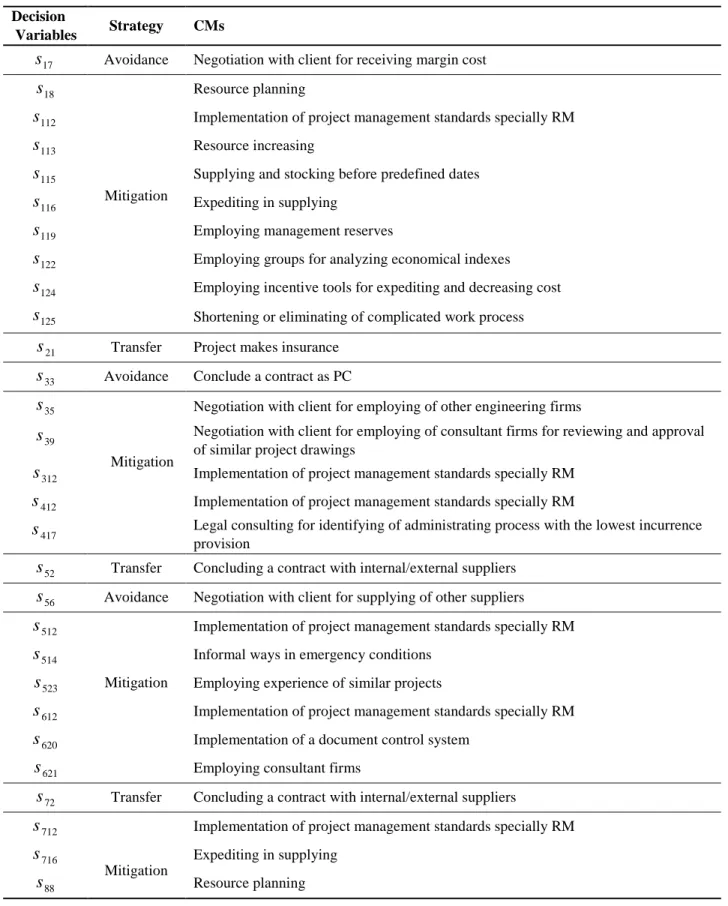
Based on EAC index, the added cost for completion of the project based on PRI is equal to 164.70 units of money and deviation from the planned schedule based on PRI obtained is equal to about 13 months. These quantities show that the project status is critical and the project manager takes the CMs for risks of the project. After determining the impact of critical risks on objectives, the CMs are identified (26 CMs identified by experts) and is estimated with proposing all CMs of each risk which has been allocated to it. The identified CMs have been shown in Table 6 allocated to the risks.
i Pi Ii
RQI = ∗
t
iL
i1
P RQI1 1
I 2
P RQI2
2
I 3
P RQI3
3
I 4
P RQI4
4
I 5
P RQI5
5
I 6
P RQI6
6
I 7
P RQI7
7
I 8
P RQI8
8
I 9
P RQI9
9
I 10
P RQI10 10
I
ij
Table 6.Control measures allocated to risks.
Decision
Variables Strategy CMs
Avoidance Negotiation with client for receiving margin cost
Mitigation
Resource planning
Implementation of project management standards specially RM Resource increasing
Supplying and stocking before predefined dates Expediting in supplying
Employing management reserves
Employing groups for analyzing economical indexes Employing incentive tools for expediting and decreasing cost
Shortening or eliminating of complicated work process
Transfer Project makes insurance
Avoidance Conclude a contract as PC
Negotiation with client for employing of other engineering firms
Mitigation
Negotiation with client for employing of consultant firms for reviewing and approval of similar project drawings
Implementation of project management standards specially RM Implementation of project management standards specially RM
Legal consulting for identifying of administrating process with the lowest incurrence provision
Transfer Concluding a contract with internal/external suppliers
Avoidance Negotiation with client for supplying of other suppliers
Mitigation
Implementation of project management standards specially RM Informal ways in emergency conditions
Employing experience of similar projects
Implementation of project management standards specially RM
Implementation of a document control system Employing consultant firms
Transfer Concluding a contract with internal/external suppliers
Mitigation
Implementation of project management standards specially RM
Expediting in supplying Resource planning 17
s
18s
112s
113s
115s
116s
119s
122s
124s
125s
21s
33s
35s
39s
312s
412s
417s
52s
56s
512s
514s
523s
612s
620s
621s
72s
712s
716s
88s
Decision
Variables Strategy CMs
--- --- ---
Mitigation
Implementation of project management standards specially RM
Increasing of resources
Negotiating and concluding a contract for financing of project with financers Implementation of project management standards specially RM
Expediting payment by owner
Avoidance Employing of more experience subcontractors
Mitigation
instruction of key personnel
Implementation of project management standards specially RM
Quality control improvement
Implementation of a document control system
Based on AHP technique the weight of each CM with regard to the impact on the objectives (time, cost and quality) is calculated and ranked. Afterwards, the impact of each CM in reducing can be determined. EVM indices with considering new PRI are calculated. We can calculate and quantities which are listed in Table 7.
So as mentioned, after identifying CMs and the weights and effects of each CM on reduction of the risk loss and the project completion time, one should estimate the cost requirements for employing the CMs. The results of which have been listed in Table 7.
912
s
913
s
910
s
912
s
926
s
104
s
1011
s
1012
s
1018
s
1020
s
i
RQI
ij
t′
Lij′
Table7.Critical risk impact on objectives taking CMs
Risk no. Risk Description
1 Inflation and unpredictable sway in prices 23,70 0,58 2 0.55 8.68
1 2
2 Force major 31,30 0 1 0.55 8.68
2 2
3 inaccessibility to engineering consultant that be
confirmed by owner 44,20 3
2
0.55 8.68
1 2
4 Change in internal precept 0,1 0,01
1
0.27 4.34
1 1
5 supplying of materials from vendors that be confirmed
by owner 10,03 6,08
1
0.27 4.34
1 1
6 Transferring of Inefficiency information to vendors 10,15 0
1
0.27 4.34
1 1
7 Delay in entry of material and equipment to site 10,13 0
1
0.27 4.34
1 1
8 Lack of resources(material, labor, non labor) 20,10 0 1 0.27 4.34
1 1
9 financial Infirmity of subcontractors 33,30 0 1 0.27 4.34
1 1
10 Incoherence of executed part with designed drawings 8,32 0 1 0.27 4.34
1 1
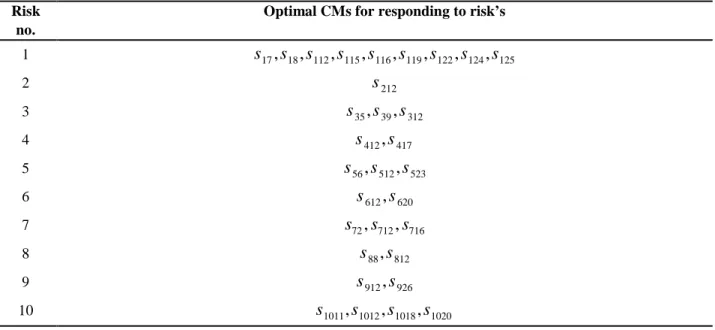
Having solved the goal programming model (19)-(31), the optimal solution was achieved as shown in Table 8. Therefore, any deviation from the goals is calculated easily and decision maker/project manager can view the results based on his/her predefined goals. There were some constraints for employing the CMs based on the organization and project conditions. Moreover, it is not necessary at this time to employ the 14th control measure for the 5th risk.
ij
c cij′ RQIi =Pi ∗Ii tij′ Lij′
1
P RQI1
1
I 2
P RQI2
2
I 3
P RQI3
3
I 4
P RQI4
4
I 5
P RQI5 5
I 6
P RQI6
6
I 7
P RQI7
7
I 8
P RQI8
8
I 9
P RQI9
9
I 10
P RQI10
10
Table 8.Optimal control measures for responding to risks
Optimal CMs for responding to risk’s Risk
no.
1 2 3
4 5 6
7 8
9 10
Table 9.Deviations predefined goals
%∆TV %LV
%RQIV Deviations of
goals
-36.81 -33.63
-32 Quantity (%)
The results of this study are summarized as follows. According to Table 8, the optimal CMs are discovered for each risk. As shown, the 12th CM is needed to respond to all critical risks which indicate the importance of implementing the project management standards specially RM in the project. The project manager must be aware, that the majority of CMs are strategies for mitigation of risk occurrence probability and risk loss to the project. Hence, the project team must always be ready to react properly in response to the risks.
Improvement of the project objectives is found significant as follows. In total, 65.73% of improvement can be achieved in the project cost based on EVM indices and 72% in the project completion time by using the entire CMs. However the following results are found based on the allocated budget. The improvement in time is equal to 45.49%, while the improvement in reduction of the risk loss is equal to 43.43% and finally the RQI quantity is increased to 46.43%. The proposed methodology is flexible in many types of EPC projects and by changing the risks, contractual objectives and organizational politics, the quantities and optimal CMs will also change. Moreover deviation from the goals has been shown in Table 9. Now the project manager must use all available tools and facilities for implementing the CMs in the risk monitoring stage and compare the results with the proposed model and take any required modifying action.
6- Conclusion and Future Research
Economic development in many countries requires implementation of large-scale projects and currently, the owners normally tend to conclude an EPC contract with the contractors to execute such projects.
17
,
18,
112,
115,
116,
119,
122,
124,
125s
s
s
s
s
s
s
s
s
212
s
35
,
39,
312s
s
s
412
,
417s
s
56
,
512,
523s
s
s
612
,
620s
s
72
,
712,
716s
s
s
88
,
812s
s
912
,
926s
s
1011
,
1012,
1018,
1020Actually the RM process which is one of the areas of project management can lead the project team to its goals. This research describes a methodology for identifying and analyzing the critical risks in a large-scale EPC project. It was a combination of MCDM and Earned value management techniques which is a well-known method for the project managers. By employing and solving a goal programming model, the most optimal responses to the risks were identified. In accordance with the findings of the present case study, in construction of LPG storage tanks, the critical risks may cause undesirable effects in the project objectives. In the EPC projects the least mistake and error can result in irrecoverable results. Hence, all the stakeholders have got to attend to risks during execution of the project and register, control, and update them as long as they do not endanger the project objectives. As a result, with the use of the proposed methodology, it was possible to select optimal solutions to respond to the risks.