Emerging Science Journal
Vol. 3, No. 3, June, 2019
2D-QSPR Study of Olfactive Thresholds for Pyrazine Derivatives
Using DFT and Statistical Methods
Assia Belhassan
a, b, Samir Chtita
a, Tahar Lakhlifi
a, Mohammed Bouachrine
a, b *a MCNS Laboratory, Faculty of Science, Moulay Ismail University, Meknes, Morocco
b Materials, Environment & Modeling Laboratory, (ESTM) High School of Technology, Moulay Ismail University, Meknes, Morocco
Abstract
In this study, we have established two-dimensional quantitative structure propriety relationships (2D-QSPR) model, for a group of 78 molecules based on pyrazine, these molecules were subjected to a 2D-QSPR analyze for their odors thresholds propriety using stepwise Multiple Linear Regression (MLR). The 35 parameters are calculated for the 78 studied compounds using the Gaussian 09W, ChemOffice and ChemSketch softwares. Quantum chemical calculations are used to calculate electronic and quantum chemical descriptors, using the density functional theory (B3LYP/6-31G (d) DFT) methods.
The model was used to predict the odors thresholds propriety of the test and training set compounds, and the statistical results exhibited high internal and external consistency as demonstrated by the validation methods.
Keywords:
Olfactive thresholds; Pyrazine;
Quantitative Structure Propriety Relationship; Density Functional Theory;
Multiple Linear Regression.
Article History:
Received: 08 March 2019
Accepted: 26 May 2019
1- Introduction
Pyrazine derivatives, a class of heterocyclic nitrogen-containing compounds, can be formed chemically or metabolically through different reaction processes [1, 2], and have been reported as important flavor ingredients and arouse great interest because of their high odor and flavor characteristics [3, 4].
The rapid development of computer science in relation to theoretical chemical studies makes it possible to obtain quickly and precisely the physico-chemical parameters (descriptors) of the molecules by calculation. These structural parameters introduce as variables used to construct models of the multidimensional quantitative structure activity / property relationship (QSAR / QSPR) can increase the interpretability and predict the activity / property of new organic compounds using statistical methods that relates these descriptors with a biological activity or a chemical property of molecules [5, 6]. The two-dimensional quantitative structure activity / property relationship (2D-QSAR / QSPR) is one of the most widely used calculation methods for predicting the activities and properties of existing or hypothetical molecules, and this is the goal of several studies [7-9].
Numerous studies on the structure-activity relationship of odor property of pyrazine derivatives suggest that variations in odor activities depend on the chemical structure of these molecules and more precisely on the type of substituent groups and the location of the substituents attached in the pyrazine ring. Mihara et al. showed that there is a good relationship between the odor thresholds of disubstituted pyrazines that have nut or brown notes [3, 10, 11]. Grosch et al. studied the odor thresholds of many alkylated pyrazine derivatives and found that the substituents at the 2, 3 and 5 positions in the pyrazine ring should play an important role in causing odor property, and predict this property afterwards for other molecules [12-16]. So the aroma quality can be done with QSAR/QSPR studies by a good prediction accuracy, built-in descriptor selection and a method for assessing the importance of each descriptor to the model [17-19].
*CONTACT: [email protected]
DOI:http://dx.doi.org/10.28991/esj-2019-01180
In this work, we developed two-dimensional quantitative structure property relationships (2D-QSPR) for a series of 78 pyrazine derivatives based odorant molecules, using 35 descriptors to construct a 2D-QSPR model. In addition, the statistical consistency of the developed model was evaluated on the basis of their correlation capability for the training set, as well as their predictive power for an external test set. Different sets of molecular descriptors were calculated to predict the studied property of the 78 pyrazine derivatives using multiple stepwise linear regression (MLR). We therefore propose quantitative models, and we try to interpret the property of the studied compounds from 2D-QSPR study [20, 21].
2- Material and Methods
2-1-Data Set
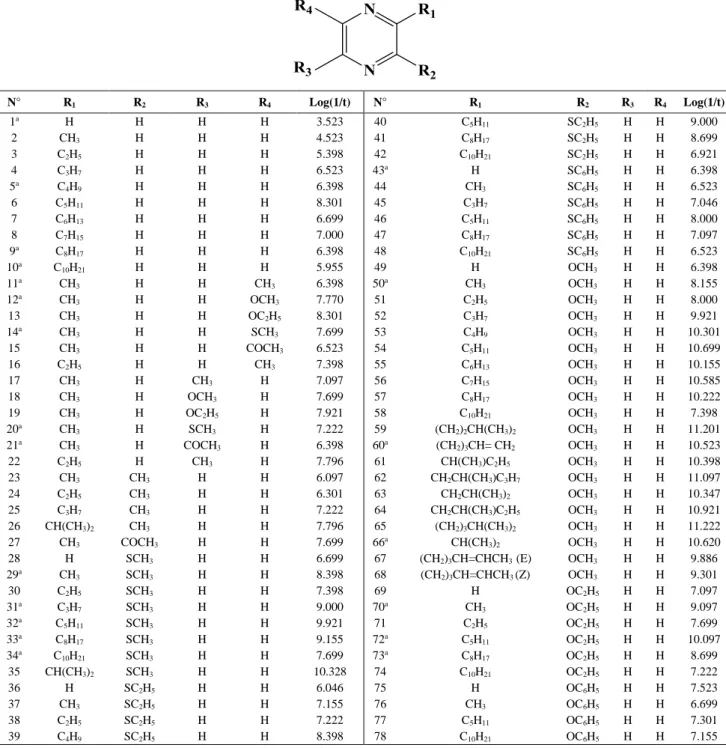
In the present study, a series of 78 selected pyrazine derivatives with reported odors threshold values (t) were taken from literature [22, 23], these molecules were considered to build the 2D-QSPR model, 57 compounds are selected to propose the quantitative model (training set), and 21 compounds have served to test the performance of the proposed model (test set). The Table 1 shows the chemical structures of studied compounds, and the experimental odor thresholds propriety values (in terms of log(1/t)).
Table 1. Chemical structures of pyrazine derivatives used in this study and their experimental odors thresholds propriety.
N° R1 R2 R3 R4 Log(1/t) N° R1 R2 R3 R4 Log(1/t)
1a H H H H 3.523 40 C
5H11 SC2H5 H H 9.000
2 CH3 H H H 4.523 41 C8H17 SC2H5 H H 8.699
3 C2H5 H H H 5.398 42 C10H21 SC2H5 H H 6.921
4 C3H7 H H H 6.523 43a H SC6H5 H H 6.398
5a C
4H9 H H H 6.398 44 CH3 SC6H5 H H 6.523
6 C5H11 H H H 8.301 45 C3H7 SC6H5 H H 7.046
7 C6H13 H H H 6.699 46 C5H11 SC6H5 H H 8.000
8 C7H15 H H H 7.000 47 C8H17 SC6H5 H H 7.097
9a C
8H17 H H H 6.398 48 C10H21 SC6H5 H H 6.523
10a C
10H21 H H H 5.955 49 H OCH3 H H 6.398
11a CH
3 H H CH3 6.398 50a CH3 OCH3 H H 8.155
12a CH
3 H H OCH3 7.770 51 C2H5 OCH3 H H 8.000
13 CH3 H H OC2H5 8.301 52 C3H7 OCH3 H H 9.921
14a CH
3 H H SCH3 7.699 53 C4H9 OCH3 H H 10.301
15 CH3 H H COCH3 6.523 54 C5H11 OCH3 H H 10.699
16 C2H5 H H CH3 7.398 55 C6H13 OCH3 H H 10.155
17 CH3 H CH3 H 7.097 56 C7H15 OCH3 H H 10.585
18 CH3 H OCH3 H 7.699 57 C8H17 OCH3 H H 10.222
19 CH3 H OC2H5 H 7.921 58 C10H21 OCH3 H H 7.398
20a CH
3 H SCH3 H 7.222 59 (CH2)2CH(CH3)2 OCH3 H H 11.201
21a CH
3 H COCH3 H 6.398 60a (CH2)3CH= CH2 OCH3 H H 10.523
22 C2H5 H CH3 H 7.796 61 CH(CH3)C2H5 OCH3 H H 10.398
23 CH3 CH3 H H 6.097 62 CH2CH(CH3)C3H7 OCH3 H H 11.097
24 C2H5 CH3 H H 6.301 63 CH2CH(CH3)2 OCH3 H H 10.347
25 C3H7 CH3 H H 7.222 64 CH2CH(CH3)C2H5 OCH3 H H 10.921
26 CH(CH3)2 CH3 H H 7.796 65 (CH2)3CH(CH3)2 OCH3 H H 11.222
27 CH3 COCH3 H H 7.699 66a CH(CH3)2 OCH3 H H 10.620
28 H SCH3 H H 6.699 67 (CH2)3CH=CHCH3 (E) OCH3 H H 9.886
29a CH
3 SCH3 H H 8.398 68 (CH2)3CH=CHCH3 (Z) OCH3 H H 9.301
30 C2H5 SCH3 H H 7.398 69 H OC2H5 H H 7.097
31a C
3H7 SCH3 H H 9.000 70a CH3 OC2H5 H H 9.097
32a C
5H11 SCH3 H H 9.921 71 C2H5 OC2H5 H H 7.699
33a C
8H17 SCH3 H H 9.155 72a C5H11 OC2H5 H H 10.097
34a C
10H21 SCH3 H H 7.699 73a C8H17 OC2H5 H H 8.699
35 CH(CH3)2 SCH3 H H 10.328 74 C10H21 OC2H5 H H 7.222
36 H SC2H5 H H 6.046 75 H OC6H5 H H 7.523
37 CH3 SC2H5 H H 7.155 76 CH3 OC6H5 H H 6.699
2-2- Computational Density Functional Theory Study (DFT)
To correlate the study property of these molecules with the physicochemical parameters, DFT (density functional theory) was used in this study. The 3D structures of the molecules were generated using the Gauss View 5.0 software [24], and all calculations were performed using Gaussian 09W software [25]. Geometry optimization of the 78 molecules was carried out using the Becke’s three parameter hybrid method and the Lee-Yang-Parr B3LYP functional [26] employing 6–31G (d) basis set [27]. The geometry of all species under investigation was determined by optimizing all geometrical variables without any symmetry constraints [28]. The quantum chemistry parameters were extracted from the DFT results [29].
2-3- Molecular Descriptors Generation
Molecular descriptors were generated using Gaussian 09W, ACD/ChemSketch and ChemOffice programs [30, 31], to predict the correlation between these parameters and their odors thresholds property by developing a linear model (multiple linear regression (MLR)) [32]. 35 descriptors are selected to calculate different types of molecular properties that can govern this property, assuming that a change of the molecular structure leads modifying in the odors thresholds property of pyrazine derivatives (Table 2).
Table 2. Descriptors selected and software packages used in the calculation of descriptors.
Softwares Descriptors
Gaussian 03
Highest Occupied Molecular Orbital energy 𝐸𝐻𝑂𝑀𝑂(𝑒𝑉) ; Lowest Unoccupied Molecular Orbital Energy 𝐸𝐿𝑈𝑀𝑂(𝑒𝑉) ;Hardness η(eV)=((ELUMO-EHOMO))/2; Electronegativity χ(eV) =-(ELUMO+EHOMO)/2; Electrophilicity Index ω(eV) =χ2/2η; Total energy E(eV); Dipole moment μ(Debye); Energy gap between 𝐸𝐻𝑂𝑀𝑂 and 𝐸𝐿𝑈𝑀𝑂values 𝐸𝐺𝑎𝑝(𝑒𝑉)
ChemOffice
Heat Of Formation H° (kJ mol-1); Gibbs Free Energy G (kJ mol-1); Ideal Gas Thermal Capacity IGTC (J mol-1 K-1)); Melting Point T (Kelvin); Critical Temperature CT (Kelvin); Boiling Point TB (Kelvin); Critical Pressure CP (Bar); Henry's Law Constant KH; Total Valence Connectivity TVC; Partition Coefficient PC; Molecular Topological Index MTI; Number of Rotatable Bonds NRB; Shape Coefficient I; Sum Of Valence Degrees SVD; Total Connectivity TC; Log P; Winner Index (W); Number of H-Bond Acceptors (NHA); Number of H-Bond Donors (NHD); Balaban Index (J); Polar Surface Area PSA (A°)2
ChemSketch Percent ratios of Nitrogen, Hydrogen, oxygen and Carbon atoms (H%; O%; C%); Surface Tension γ (dyne/cm);
Index of Refraction (n); Density (d)
2-4- Statistical Analysis
To construct the quantitative structure-property relationship model, the 35 calculated descriptors for the 78 studied compounds using the Gaussian 09W, ChemOffice and ChemSketch softwares were subjected to a stepwise multiple linear regression (MLR) available in the SPSS software [33].
The stepwise MLR statistical technique is used to study the relationship between a dependent variable (property) and several independent variables (descriptors). The stepwise MLR was generated to predict odor thresholds propriety values Log(1/t). The regression equation was validated by the correlation coefficient (r), the Mean Squared Error (MSE), the Fishers F-statistic (F), and the significance level (p-value) [24]. The p-value indicates that the regression relations are not a chance fit, but are a significant occurrence, it is determined from: p-value = Regression Mean Square/Residual Mean Square.
The final step in this QSPR study is statistical validation to evaluate the significance of the model and thus its ability to predict the property of other molecules. In this article, the model has been validated internally by Cross-validation and y-randomization methods.
In this work the Leave-One-Out is used, as Cross Validations method to validate the model internally, this procedure successively eliminates a compound of the training set containing 57 compounds. A QSPR model is built on a set of "56" compounds and the eliminated compound is predicted by the model. This procedure is repeated "57" times in order to predict the property of all compounds [35].
We also used a 100 y-randomization test for the stepwise MLR model. In this test, random QSPR models are generated by randomly mixing the dependent variable while keeping the independent variables as they are. New QSPR models expected to have significantly lower r2 and r2
3- Results and Discussions
3-1- Data Set for Analysis
A QSPR study was constructed for a series of 78 pyrazine derivatives, to build a quantitative relationship between the molecular structure of the studied compounds and their odors thresholds propriety values Log(1/t). The values of the 35 descriptors are shown in Table S1 and S2 (Supplementary material).
3-2- Stepwise Multiple Linear Regression MLR
In order to quantitatively evaluate the physicochemical effects of the substituent on the Log (1/t) of all the 78 studied compounds, we submitted the data matrix constituted from the 35 descriptors corresponding to the 57 molecules (training set), to a stepwise multiple linear regression (MLR). This procedure based on the forward-selection and backward elimination method (including the critical probability: p-value < 0.05 for all descriptors and for the model complete), was employed to determine the best equation.
The Variance Inflation Factor (VIF) was defined as 1/(1-r2) [36], models with VIF greater than 5 were unstable and
eliminated, models with VIF values between 1 and 4 can be accepted [36] (Table 3).
Table 3. Multicollinearity statistics.
H° TC J
Tolerance 0.721 0.898 0.530 0.681
VIF 1.386 1.114 1.887 1.469
The relationship obtained using this method corresponds to the linear combination of these descriptors (Table 3): Electronegativity (), Heat of Formation (H°), Total Connectivity (TC) and Balaban Index (J). The increase of all these descriptors decreases the property values (see the regression equation).
The stepwise MLR regression equation is represented as following:
𝑳𝒐𝒈(1/t) = 20.418 − 2.894 ×− 7.628 × 10⁻³ × H°− 27.664 × TC − 7.012 × 10⁻⁶× J
N = 56; r = 0.826; r2= 0.682; MSE = 0.926; F = 27.884; P < 0.0001.
In this equation, N is the number of compounds and r2 is the coefficient of determination.
The model is reliable because the correlation coefficient r is high and the mean squared error value (MSE) is low. A value of P much smaller than 0.05 indicates that the regression equation is statistically significant [37].
The calculated Log(1/t) values by the regression equation are given in Table 4 in comparison to the experimental values. The correlation between the calculated and experimental Log(1/t) is shown in Fig. 2.
3.5 4.5 5.5 6.5 7.5 8.5 9.5 10.5 11.5
3.5 4.5 5.5 6.5 7.5 8.5 9.5 10.5 11.5
Lo
g
(1
/t)
2D-QSPR correlates the property values with the physicochemical descriptors of data set. It has been used frequently to predict the properties of new molecules. So, the developed models can be used in the design of new pyrazine derivatives with the desired properties values (high or low values of Log(1/t)).
In this way, we can designed news compounds by adding suitable substituents and calculated their property using the stepwise MLR regression equation. The stepwise MLR equation indicated the negative correlation of the Electronegativity (), Heat of Formation (H°), Total Connectivity (TC) and Balaban Index (J).
The obtained results show that, to increase propriety of pyrazine derivatives, we will decrease descriptor values (,
H°, TC and J) of these molecules. Moreover, to decrease property, we will increase the descriptor values, by adding suitable substituents and calculated their property using the regression equation.
3-3- Internal Validation
a. Cross-Validation
The QSPR model constructed by the regression equation of the stepwise MLR method, is validated by its value of the cross-validation coefficient r2
CV determinated using the Leave-One-Out (LOO) procedure. Model with r2CV greater
than 0.5 can be accepted to validate a QSPR model.
For this study, the performance of the constructed model was good and was characterized by r2
CV value of 0.606 with
the descriptors proposed by the stepwise MLR (, TC, H° and J).
b. y-Randomization Test
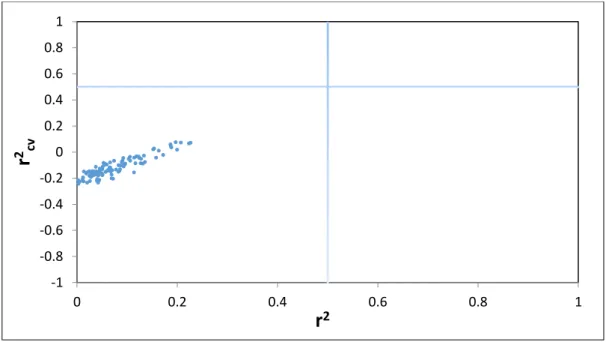
To verify that the developed QSPR model is robust and not randomly derived, the y-randomization test was performed on the data of the training set [38]. We used 100-y-randomization tests and observed that the values of r2 and
r2
CV were <0.5 for all the models (Fig. 3). This test confirms that the MLR model is robust and is not derived simply by
chance [39].
Figure 2. y-Randomization plot of stepwise MLR model.
3. 4. External Validation
To validate the predictive power of the stepwise MLR model, we need to use a set of molecules that have not been used in the training set to build the QSPR model. The model established in the calculation procedure using the pyrazine derivatives is used to predict the odor thresholds propriety values (Log(1/t)) of the test set.
The results obtained by the stepwise MLR model, are very sufficient to conclude the performance of the model; it is confirmed by the test carried out with the 21 compounds (rtest=0.820; r2test=0.672).
4- Conclusion
In this study, 2D-QSPR analyze was used to predict the odors thresholds propriety of a set of pyrazine derivatives.
The 2D-QSPR model gave good statistical results in terms of rCV and r values. The stepwise MLR model exhibited high
-1 -0.8 -0.6 -0.4 -0.2 0 0.2 0.4 0.6 0.8 1
0 0.2 0.4 0.6 0.8 1
r
2 cv
internal and external consistency as demonstrated by the several validation methods (internal and external validations). Moreover, the MLR model provided a detailed description of the molecular aspects underlying the odors thresholds propriety of the studied compounds. The stepwise MLR equation was able to identify physicochemical properties strongly correlated with the odors thresholds propriety of this series. So, these results can be explored in the design of new compounds with the desired odors thresholds propriety.
5- Acknowledgements
We are grateful to the “Association Marocaine des Chimistes Théoriciens” (AMCT) for its pertinent help concerning the programs.
6- Conflict of Interest
The authors declare no conflict of interest.
7- References
[1] Yagnam, Swetha, Adinarayana Murthy Akondi, Rajiv Trivedi, Balaji Rathod, Reddy Shetty Prakasham, and B. Sridhar. “Spirooxindole-Fused Pyrazolo Pyridine Derivatives: NiO–SiO2 Catalyzed One-Pot Synthesis and Antimicrobial Activities.” Synthetic Communications 48, no. 3 (January 8, 2018): 255–266. doi:10.1080/00397911.2017.1393687.
[2] Adams, An, Viviana Polizzi, Martinus van Boekel, and Norbert De Kimpe. “Formation of Pyrazines and a Novel Pyrrole in Maillard Model Systems of 1,3-Dihydroxyacetone and 2-Oxopropanal.” Journal of Agricultural and Food Chemistry 56, no. 6 (March 2008): 2147–2153. doi:10.1021/jf0726785.
[3] Miyazawa Y, Ohkubo Y, Haraguchi K, Takahashi M, Yoshida S. Flavor Modulator Having Pyridine Derivative or Salt Thereof As Active Ingredient. US Patent App. 15/712,381; 2018.
[4] Shimazaki, Kazuko, Takashi Inoue, Hiroki Shikata, and Kazuhisa Sakakibara. “Evaluation of the Odor Activity of Pyrazine Derivatives Using Structural and Electronic Parameters Derived from Conformational Study by Molecular Mechanics (MM3) and Ab Initio Calculations.” Journal of Molecular Structure 749, no. 1–3 (July 2005): 169–176. doi:10.1016/j.molstruc.2005.03.044.
[5] Deng, Baichuan, Hongrong Long, Tianyue Tang, Xiaojun Ni, Jialuo Chen, Guangming Yang, Fan Zhang, et al. “Quantitative Structure-Activity Relationship Study of Antioxidant Tripeptides Based on Model Population Analysis.” International Journal of Molecular Sciences 20, no. 4 (February 25, 2019): 995. doi:10.3390/ijms20040995.
[6] Chtita, Samir, Mounir Ghamali, Majdouline Larif, Rachid Hmamouchi, Mohammed Bouachrine, and Tahar Lakhlifi. “Quantitative Structure–Activity Relationship Studies of Anticancer Activity for Isatin (1H-Indole-2,3-Dione) Derivatives Based on Density Functional Theory.” International Journal of Quantitative Structure-Property Relationships 2, no. 2 (July 2017): 90– 115. doi:10.4018/ijqspr.2017070108.
[7] Baviskar, Bhushan A, Sharada L Deore, and Sagar Alone. “2D QSAR Study on Saponins of Pulsatilla Koreana as an Anticancer Agent.” Pharmacognosy Communications 9, no. 1 (January 15, 2019): 02–06. doi:10.5530/pc.2019.1.2.
[8] Wang, Tao, Xin-song Yuan, Mian-Bin Wu, Jian-Ping Lin, and Li-Rong Yang. “The Advancement of Multidimensional QSAR for Novel Drug Discovery - Where Are We Headed?” Expert Opinion on Drug Discovery (June 8, 2017): 1–16. doi:10.1080/17460441.2017.1336157.
[9] De Souza, Anacleto S., Leonardo G. Ferreira, and Adriano D. Andricopulo. “2D and 3D QSAR Studies on a Series of Antichagasic Fenarimol Derivatives.” International Journal of Quantitative Structure-Property Relationships 2, no. 1 (January 2017): 44–63. doi:10.4018/ijqspr.2017010104.
[10] Mihara, Satoru, Hideki Masuda, Hideki Tateba, and Tohru Tuda. “Olfactive Properties of 3-Substituted 5-Alkyl-2-Methylpyrazines.” Journal of Agricultural and Food Chemistry 39, no. 7 (July 1991): 1262–1264. doi:10.1021/jf00007a013. [11] Buchbauer, Gerhard, Christian Th. Klein, Bettina Wailzer, and Peter Wolschann. “Threshold-Based Structure−Activity
Relationships of Pyrazines with Bell-Pepper Flavor.” Journal of Agricultural and Food Chemistry 48, no. 9 (September 2000): 4273–4278. doi:10.1021/jf000192h.
[12] Wagner, R., M. Czerny, J. Bielohradsky, and W. Grosch. “Structure-Odour-Activity Relationships of Alkylpyrazines.” Zeitschrift Für Lebensmitteluntersuchung Und -Forschung A 208, no. 5–6 (May 3, 1999): 308–316. doi:10.1007/s002170050422. [13] Grosch, Werner, Michael Czerny, Robert Wagner, and Florian Mayer. “STUDIES ON THE AROMA OF ROASTED COFFEE.”
Flavour Science (1996): 200–205. doi:10.1533/9781845698232.4.200.
[15] Czerny, Michael, Robert Wagner, and Werner Grosch. “Detection of Odor-Active Ethenylalkylpyrazines in Roasted Coffee.” Journal of Agricultural and Food Chemistry 44, no. 10 (January 1996): 3268–3272. doi:10.1021/jf9600824.
[16] Zakarya, Driss, Lahbib Farhaoui, Mohammed Hamidi, and Mohammed Bouachrine. “Structure–olfactive Threshold Relationships for Pyrazine Derivatives.” Journal of Molecular Modeling 12, no. 6 (May 5, 2006): 985–989. doi:10.1007/s00894-006-0115-1.
[17] Rojas, Cristian, Pablo R. Duchowicz, Piercosimo Tripaldi, and Reinaldo Pis Diez. “Quantitative Structure–property Relationship Analysis for the Retention Index of Fragrance-Like Compounds on a Polar Stationary Phase.” Journal of Chromatography A 1422 (November 2015): 277–288. doi:10.1016/j.chroma.2015.10.028.
[18] Svetnik, Vladimir, Andy Liaw, Christopher Tong, J. Christopher Culberson, Robert P. Sheridan, and Bradley P. Feuston. “Random Forest: A Classification and Regression Tool for Compound Classification and QSAR Modeling.” Journal of Chemical Information and Computer Sciences 43, no. 6 (November 2003): 1947–1958. doi:10.1021/ci034160g.
[19] Rodgers, Sarah L., Andrew M. Davis, Nick P. Tomkinson, and Han van de Waterbeemd. “Predictivity of Simulated ADME AutoQSAR Models over Time.” Molecular Informatics 30, no. 2–3 (March 14, 2011): 256–266. doi:10.1002/minf.201000160. [20] Shukla, Aparna, Rekha Tyagi, Sanjeev Meena, Dipak Datta, Santosh Kumar Srivastava, and Feroz Khan. “2D- and 3D-QSAR Modelling, Molecular Docking and in Vitro Evaluation Studies on 18β-Glycyrrhetinic Acid Derivatives Against Triple-Negative Breast Cancer Cell Line.” Journal of Biomolecular Structure and Dynamics (January 28, 2019): 1–18. doi:10.1080/07391102.2019.1570868.
[21] Vaidya, Ankur, Sourabh Jain, Shweta Jain, Abhishek K. Jain, and Ram K. Agrawal. “Quantitative Structure-Activity Relationships: A Novel Approach of Drug Design and Discovery.” Journal of Pharmaceutical Sciences and Pharmacology 1, no. 3 (September 1, 2014): 219–232. doi:10.1166/jpsp.2014.1024.
[22] Masuda, Hideki, and Satoru Mihara. “Olfactive Properties of Alkylpyrazines and 3-Substituted 2-Alkylpyrazines.” Journal of Agricultural and Food Chemistry 36, no. 3 (May 1988): 584–587. doi:10.1021/jf00081a044.
[23] Mihara, Satoru, and Hideki Masuda. “Structure-Odor Relationships for Disubstituted Pyrazines.” Journal of Agricultural and Food Chemistry 36, no. 6 (November 1988): 1242–1247. doi:10.1021/jf00084a029.
[24] Dennington, Roy, Todd Keith, and John Millam. "GaussView, version 5." Semichem Inc.: Shawnee Mission, KS (2009). [25] Frisch MJ, Trucks GW, Schlegel HB, Scuseria GE, Robb MA, Cheeseman JR, et al. Gaussian 09 (Revision A. 1). Wallington,
CT, USA: Gaussian. Inc Google Scholar 2009.
[26] Lee, Chengteh, Weitao Yang, and Robert G. Parr. “Development of the Colle-Salvetti Correlation-Energy Formula into a Functional of the Electron Density.” Physical Review B 37, no. 2 (January 15, 1988): 785–789. doi:10.1103/physrevb.37.785. [27] Hariharan, P. C., and J. A. Pople. “The Influence of Polarization Functions on Molecular Orbital Hydrogenation Energies.”
Theoretica Chimica Acta 28, no. 3 (1973): 213–222. doi:10.1007/bf00533485.
[28] Chtita, Samir, Mounir Ghamali, Majdouline Larif, Azeddine Adad, R. Hmammouchi, Mohammed Bouachrine, and Tahar Lakhlifi. "Prediction of biological activity of imidazo [1, 2-a] pyrazine derivatives by combining DFT and QSAR results." IJIRSET 2, no. 12 (2013): 7962.
[29] Sarkar, U., J. Padmanabhan, R. Parthasarathi, V. Subramanian, and P. K. Chattaraj. "Toxicity analysis of polychlorinated dibenzofurans through global and local electrophilicities." Journal of Molecular Structure: THEOCHEM 758, no. 2-3 (2006): 119-125.
[30] Inc., Toronto, ON, Canada. ACDLABS 10 Advanced Chemistry Development 2015. [31] PerkinElmer Informatics. ChemBioOffice 2010.
[32] Belhassan, Assia, Samir Chtita, Tahar Lakhlifi, and Mohammed Bouachrine. “QSPR Study of the Retention/release Property of Odorant Molecules in Pectin Gels Using Statistical Methods.” Journal of Taibah University for Science 11, no. 6 (November 2017): 1030–1046. doi:10.1016/j.jtusci.2017.05.004.
[33] SPSS 19.0 n.d.
[34] Chtita, S., M. Larif, M. Ghamali, M. Bouachrine, and T. Lakhlifi. "DFT-based QSAR Studies of MK801 derivatives for non competitive antagonists of NMDA using electronic and topological descriptors." Journal of taibah university for chemistry 9, no. 2 (2014): 143-154.
[35] Gramatica, Paola. “Principles of QSAR Models Validation: Internal and External.” QSAR & Combinatorial Science 26, no. 5 (May 2007): 694–701. doi:10.1002/qsar.200610151.
[37] Chtita, Samir, Mounir Ghamali, Rachid Hmamouchi, Bouhya Elidrissi, Mohamed Bourass, Majdouline Larif, Mohammed Bouachrine, and Tahar Lakhlifi. “Investigation of Antileishmanial Activities of Acridines Derivatives Against Promastigotes and Amastigotes Form of Parasites Using Quantitative Structure Activity Relationship Analysis.” Advances in Physical Chemistry 2016 (November 22, 2016): 1–16. doi:10.1155/2016/5137289.
[38] Roy, Kunal, and Indrani Mitra. “On Various Metrics Used for Validation of Predictive QSAR Models with Applications in Virtual Screening and Focused Library Design.” Combinatorial Chemistry & High Throughput Screening 14, no. 6 (July 1, 2011): 450–474. doi:10.2174/138620711795767893.