Original Research Article
The comparison of apache II and apache IV score to predict mortality
in intensive care unit in a tertiary care hospital
Vidya S. Nagar, Basavaraj Sajjan*, Rudrarpan Chatterjee, Nitesh M. Parab
INTRODUCTION
The use of scoring system to predict risk of mortality and evaluating outcome in critically ill patients is important in modern evidence-based medicine. Prognostication of critically ill patients, in a systematic way, based on definite objective data is an integral part of the quality of care in ICU.1 Acute physiology and chronic health
evaluation (APACHE) scoring systems provide an
objective means of mortality prediction in ICU. An adequate scoring system should be able to define critically ill-patients, estimate prognosis, and set a benchmark for the maintenance of standards of care in the ICU.
A number of physiological based scoring systems have been developed over the years to achieve these goals. However, among many severity scoring systems, Department ofMedicine, Grant Government Medical College, Mumbai, Maharashtra, India
Received: 23 January 2019
Revised: 05 April 2019
Accepted: 011 April 2019
*Correspondence:
Dr. Basavaraj Sajjan,
E-mail: [email protected]
Copyright: © the author(s), publisher and licensee Medip Academy. This is an open-access article distributed under the terms of the Creative Commons Attribution Non-Commercial License, which permits unrestricted non-commercial use, distribution, and reproduction in any medium, provided the original work is properly cited.
ABSTRACT
Background: The prognostication of critically ill patients, in a systematic way, based on definite objective data is an integral part of the quality of care in Intensive Care Unit (ICU). Acute physiology and chronic health evaluation (APACHE) scoring systems provide an objective means of mortality prediction in Intensive Care Unit (ICU). The aims of this study were to compare the performance of APACHE II and APACHE IV in predicting mortality in our intensive care unit (ICU).
Methods: A prospective observational study was conducted in a 13 bedded intensive care unit (ICU) of a tertiary level teaching hospital. All the patients above the age of 12 years, irrespective of diagnosis managed in ICU for >24hours were enrolled. APACHE II and APACHE IV scores were calculated based on the worst values in the first 24hours of admission. All enrolled patients were followed up, and outcome was recorded as survivors or non survivors. Observed mortality rates were compared with predicted mortality rates for both the APACHE II and APACHE IV. Receiver operator characteristic curves (ROC) were used to compare accuracy of the two scores.
Results: APACHE II score of the patients ranged from 1 to 32 and APACHE IV score of the patients ranged from 25 to 142. There was good correlation between APACHE II and APACHE IV scores with the spearman’s rho value of 0.776 (P<0.01). Discrimination for APACHE II and APACHE IV models were good with area under ROC curve of 0.805 and 0.832 respectively. APACHE IV was more accurate than APACHE II in this regard. The cut-off point with best Youden index for APACHE II was 17 and for APACHE IV were 72 respectively for predicting mortality.
Conclusions: Discrimination was better for APACHE IV than APACHE II model however Calibration was better for APACHE II than APACHE IV model in present study. There was good correlation between the two models observed in present study.
Keywords: APACHE II, APACHE IV, ICU, Mortality prediction
APACHE scores are the most commonly used and deserve some understanding. The basic premise of these scores is that worst physiological derangement noted during first 24hours after admission in an ICU determines the chance of hospital survival as these define organ insufficiency.
APACHE-I was proposed in the year 1981.2 APACHE-I
considered 34 routinely collected physiological measurements in the hospitals. Each of these measurements was assigned a weight according to the severity of derangement; higher the score more is the chance of death. However, this was found too complex as it included the large number of variables.3
APACHE II scoring system developed in 1985 as a modification of the original APACHE score, consists of reduced acute physiology score (APS) variables from 34 to 12 with age points and chronic health points.4 The total
physiological derangement score is the sum of the individual scores (0-4) for each variable, except the Glasgow coma scale (GCS) where the score is 15 minus the GCS (0-12).5 The most deranged value in the first 24
hours of ICU admission is used as the scoring for each variable. The total physiological derangement score is added to a score of age (0-6) and a chronic health score for patients with severe organ insufficiency (2-5 depending upon admission status). A total score of 71 points is assigned which is used to relate to mortality in the ICU setting.4
APACHE-III scoring system developed between 1991 to 1998 in several different versions.6 The APACHE III
scores vary between 0 and 299 points, including up to 252 points for the 18 physiological variables, up to 24 points for age, and up to 23 points for the chronic health status. This model was chosen to minimize the amount of missing data and to increase the explanatory power of the model, but eventually there were pitfalls when the model was used to evaluate the performance of the ICU and APACHE III calculator was an expensive software, which became a major limitation to its clinical utility as well.
APACHE IV scoring system was introduced in 2006 as an improved and updated model for predicting hospital mortality among critically ill patients and is the most recent version of the APACHE scoring system. This model included the new predictor variables like- mechanical ventilation, thrombolysis, Pao2/fio2 ratio, impact of sedation on Glasgow Coma Scale, pre-ICU hospital length of stay, location prior to ICU admission and 116 disease specific subgroups in addition to the modifications introduced in the APACHE III.7
There are very few studies comparing the APACHE II and APACHE IV scoring systems in the ICU in an India setting.8 Thus, we designed a study to observe the
performance of APACHE II and APACHE IV scoring system in our ICU.
METHODS
After obtaining approval from institution review board, the study was prospectively conducted for 18 months duration in a 13 bedded intensive care unit (ICU) of a tertiary level teaching hospital.
All patients above12 years of age, irrespective of diagnosis, managed in the ICU for >24hours were enrolled. Authors excluded the patients who stayed in the ICU for <24hours, patients missing an acute physiology score on ICU day 1, patients not willing to give consent for enrolling in the study and patients with post-cardiac arrest status on admission.
APACHE II and APACHE IV scores were calculated based on the worst values for each variable in the first 24hours of admission. The scores were calculated from the online calculator.9,10
All enrolled patients were followed during their ICU stay and outcome was recorded as survivors or non survivors. Observed mortality rates were compared with predicted mortality rates for both scoring systems.
To validate each prognostic model, their discrimination and calibration were analyzed. Discrimination is defined as the ability of the model to separate survivors from non-survivors and was assessed using the area under the receiver operating characteristic curve.11 Calibration
assesses the degree of correspondence between the estimated probability of mortality and that actually observed. This was be tested using a goodness of fit test, the Hosmer-Lemeshow C statistic.12 When the predicted
mortality of the prognostic model differs significantly from the observed pattern, the calibration ability of this model is poor. The standardized mortality ratio (SMR) is the ratio between the observed and predicted number of deaths. And SMR=1 indicates that the number of observed mortalities equals that of predicted mortality.
Statistical analysis was performed using SPSS version 23.0, IBM Corp. Data were reported as mean ±standard deviation (SD) for continuous variables and percentages for categorical variables. Student’s t-test, Chi-square were used, depending on whether the variables were continuous or categorical.
P<0.05 was deemed to indicate statistical significance. Area under curve (AUC) was used to measure the discrimination for hospital mortality.
RESULTS
APACHE II score of the patients ranged from 1 to 32 and APACHE IV score of the patients ranged from 25 to 142. The mean APACHE II score of the patients was 16.71±6.92 and the mean APACHE IV score was 72.7±21.53.
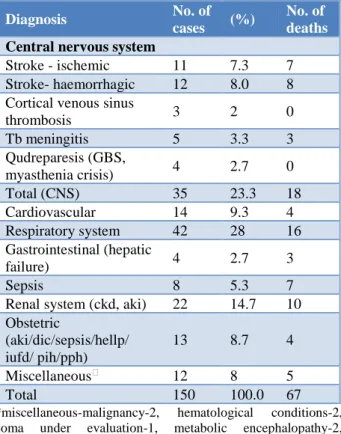
Table 1: Diagnosis of study subjects on admission and their outcome.
Diagnosis No. of
cases (%)
No. of deaths
Central nervous system
Stroke - ischemic 11 7.3 7 Stroke- haemorrhagic 12 8.0 8 Cortical venous sinus
thrombosis 3 2 0 Tb meningitis 5 3.3 3 Qudreparesis (GBS,
myasthenia crisis) 4 2.7 0 Total (CNS) 35 23.3 18 Cardiovascular 14 9.3 4 Respiratory system 42 28 16 Gastrointestinal (hepatic
failure) 4 2.7 3
Sepsis 8 5.3 7
Renal system (ckd, aki) 22 14.7 10 Obstetric
(aki/dic/sepsis/hellp/ iufd/ pih/pph)
13 8.7 4
Miscellaneous⁎ 12 8 5 Total 150 100.0 67
*miscellaneous-malignancy-2, hematological conditions-2, coma under evaluation-1, metabolic encephalopathy-2, unknown poisoning - 5.
Cause specific mortality is depicted in (Table 1). There was high mortality in those patients admitted with sepsis, stroke (hemorrhagic>ischemic), ARDS and hepatic failure (Table 1).
Figure 1: Case distribution as per APACHE II scores.
Patients were admitted at all levels of severity with APACHE II scores ranging from 1 to 32 in present study
(normal range of APACHE II score: from 0 to 71). Of the 150 patients enrolled, 75 (49.6%) had an APACHE II score between 11to20 (Figure 1).
APACHE IV score ranged from 25 to 142 in present study group (normal range APACHE IV score from 0 to 286). Of the total patients, 101 (67.3%) had an APACHE IV scores between 51 to 90. There are no patients between the scores of 0 to 20, 121 to 130 and above 151. Only two patients had APACHE IV score between 131 and 150 (Figure 2).
Figure 2: Case distribution as per APACHE IV scores.
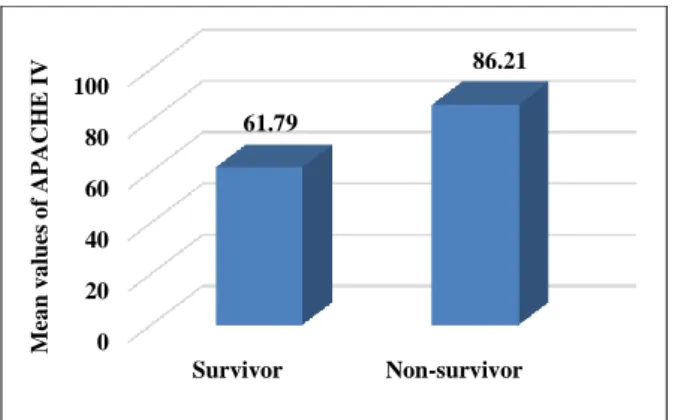
For APACHE II model, the mean score for survivors was 13.53±6.11, which was less compared to mean score of 20.64±5.75 for non-survivors (P<0.001). For APACHE IV model, the mean score for the survivors was 61.79±16.22, which was less compared with mean the score of 86.21±19.61 for non-survivors.
Figure 3: Difference in APACHE II scores between survivors and non survivors.
Both APACHE II and IV scores were significantly higher among non-survivors compared to survivors (Figures 3 and 4). Mortality increased with increasing APACHE II and APACHE IV score.
0 10 20 30 40
0 to 5 6 to 10
11 to 15
16 to 20
21 to 25
26 to 30
31 to 35
N
o
.
o
f
Pa
ti
en
ts
APACHE II Score
0 5 10 15 20 25 30
N
o
.
o
f
p
a
ti
en
ts
APACHE IV Scores
0 5 10 15 20 25
Survivor Non-survivor 13.53
20.64
M
ea
n
v
a
lu
es
o
f
A
PA
C
HE
II sc
o
Figure 4: Difference in APACHE IV scores between survivors and non survivors.
APACHE II and APACHE IV scores showed good correlation using spearman’s rank correlation coefficient with RHO value of 0.776 (P <0.01). R2 value of 0.599 demonstrated that there was not much variability between the two scores (Figure 5).
Figure 5: Correlation between APACHE II and APACHE IV scores.
Among 39 patients who required inotropic support, 14 were survivors and 25 were non-survivors. Patients on inotropic support had poor outcome than those without inotropic support.
Table 2: Comparison of Inotropic support and
mechanical ventilation in survivors and non-survivors.
Survivors Non -survivors P
N (%) N (%)
Inotropic support
Yes (39) 14 35.9 25 64.1
0.006 No (111) 68 61.3 43 38.7
Mechanical ventilation
Yes (107) 43 40.2 64 59.8
0.001 No (43) 40 93 03 7
Discrimination for APACHE II and APACHE IV models were good with area under ROC curve of 0.805(95%
confidence intervals 0.735-0.875) and 0.832(95% confidence intervals 0.768-0.897) respectively (Figure 6). This suggests good accuracy of both scores in predicting mortality. However, APACHE IV was statistically more accurate than APACHE II in this regard.
Figure 6: Receiver operating characteristic (ROC) curve.
The cut‑off point with best Youden index for APACHE II and APACHE IV were 17 and 72 respectively. Patients with APACHE II score ≥17 had poor outcome in comparison to patients with APACHE II score <17 (Pearsons chi square 43.92, p value<0.001). Patients with APACHE IV score ≥ 72 had poor outcome in comparison to patients with APACHE IV score < 72 (Pearsons chi square 38.74, p value<0.001).
The Hosmer-Lemeshow goodness of fit chi-square coefficient for APACHE II was 2.38 (p=0.969) and for APACHE IV was 5.26 (p = 0.729) in present study.
The mean predicted length of ICU stay by APACHE IV model was 5.79±2.1 and observed ICU length of stay was 5.27±3.1.
Standardized mortality ratio (SMR)
• Crude mortality rate: 44.66%,
• Mean predicted mortality for APACHE II score: 28.91,
• Mean predicted mortality for APACHE IV score: 27.02,
• SMR for APACHE II: 1.54,
• SMR for APACHE IV: 1.65.
The actual mortality rate (AMR) in this study was 44.66 % since, 67 out of the 150 study patients had expired. Mean of predicted mortality rate (PMR) for APACHE-II was 28.91 % and for APACHE-IV was 27.02 %. And SMR for APACHE II and APACHE IV were 1.54 and 1.65 respectively. In present study both APACHE II and APACHE IV scoring systems under-predicted overall mortality.
0 20 40 60 80 100
Survivor Non-survivor 61.79
86.21
M
ea
n
v
a
lu
es
o
f
A
PA
C
HE
IV
0 20 40 60 80 100 120 140 160
0 10 20 30 40
A
PA
C
HE
IV
S
co
re
DISCUSSION
ICU scoring systems were introduced many years ago with the goal of using physiologic data available at ICU admission to predict individual patient outcomes. Although these predictions have little utility for managing individual patients, they provide a mechanism to assess ICU performance by comparing actual outcomes in a given population to the outcomes observed in the reference population used to develop the prediction algorithms.13
Among 150 patients that were enrolled in the study. The mean age of present study population was 46.44±18.44. Majority of the study patients had respiratory illness followed by neurological emergencies, renal disease requiring intensive care, obstetric emergencies and sepsis. Present study population was similar to the study population of Dabhi AS et al, and Varghese YE et al.14,15
The non-survivors had a higher APACHE II score (20.64±5.75 vs 13.53±6.12) and a higher APACHE IV score (86.21±19.61 vs 61.79±16.217) compared to survivors. This was similar to mean APACHE IV scores reported by Varghese YE et al, (87.1±30 vs 53.1±22.5), Lee H et al, (77.1±22.2 vs 49±22.2).15,16
Present study observed a very good correlation between APACHE II and APACHE IV scoring systems with a Spearman’s rho correlation coefficient of 0.776 (P<0.001), which was similar to Varghese YE et al, and Parajuli BD et al, who also reported good correlation between APACHE II and APACHE IV, with Spearman’s correlation coefficient of 0.708 and 0.808 respectively.15,17
The mean predicted length of ICU stay by APACHE IV model was 5.79±2.1 and observed ICU length of stay was 5.27±3.1. There was linear relationship between predicted length of ICU stay by APACHE IV model and observed ICU length of stay in present study.
The discrimination of APACHE II as determined by area under curve (AUC) in present study was 0.805. This is similar to previously reported studies. However, the study by Ayazoglu TA et al, had AUC of 0.98 which was higher than all other reported literature.18 This was likely
due to the homogenous population of only stroke patients included in their study.
The AUC for APACHE IV in present study was found to be 0.832 indicating a better discriminating ability compared to APACHE II (0.805). Similar results were observed in the original internal validation study for APACHE IV done by Zimmerman JE et al, with AUC of 0.880.7
Authors observed that the APACHE IV model better predicted mortality than APACHE II scoring system in our ICU. The reason could probably be the consideration
of mechanical ventilation support, patient source prior to ICU admission, disease specific subgroup analysis and specific reason for ICU admission included in the APACHE IV model.
In present study the cut of point with best Youden index for APACHE II was 17 and APACHE IV was 72. Hence mortality of patients was significantly high when APACHE II score was ≥17 and APACHE IV score ≥72.
The Hosmer-Lemeshow goodness of fit chi-square coefficient for APACHE II was 2.38 (p = 0.969) and for APACHE IV was 5.26 (p = 0.729) in present study. As the Hosmer-Lemeshow statistic P value is greater than 0.05, the calibration is considered good. The P-value will be small in very large samples and the opposite in small samples leading to inappropriate estimation of the calibration as seen in present study. However, APACHE II had better calibration then APACHE IV model.19
The limitations for these scoring systems would be failure to compensate for lead time bias, requirement for a diagnosis immediately on admission, pre-ICU conditions and management, poor inter-observer reliability. Besides this, overall quality of ICU is affected by the bed occupancy ratio, lab facility, availability of trained man power, nurse to patient ratio and financial status of the patient’s care giver.20
Both APACHE models have shown good performance in the developed countries and other parts of the world. However, in the developing countries like ours, the performance of both models can be improved by considering separate points for lead time bias, financial status of the patient’s caretakers, nurse to patient ratio in ICU, availability of manpower and resources in the ICU.
Thus, more studies in multiple center involving larger patient population are needed to validate both the scoring systems in developing countries like ours and separate scoring systems that correct the pitfalls in resource limited environment need to be developed for good predictability.
CONCLUSION
In our ICU APACHE IV model showed better predicted mortality than APACHE II scoring system. And calibration of both the scoring systems was less than adequate. However, APACHE II showed better calibration than APACHE IV. Larger multicenter validation studies with customization for the Indian ICU population are needed before they can be applied in our setting.
Funding: No funding sources Conflict of interest: None declared
REFERENCES
1. Becker RB, Zimmerman JE. ICU scoring systems allow prediction of patient outcomes and comparison of ICU performance. Critical Care Clinic. 1996;12(3):503-14.
2. Knaus WA, Zimmerman JE, Wagner DP, Draper EA, Lawrence DE. APACHE-acute physiology and chronic health evaluation: a physiologically based classification system. Crit Care Med. 1981;9(8):591-7.
3. Wong DT, Knaus WA. Predicting outcome in critical care: the current status of the APACHE prognostic scoring system. Can J Anaesth. 1991;38(3):374-83.
4. Knaus WA, Draper EA, Wagner DP, Zimmerman JE. APACHE II: a severity of disease classification system. Crit Care Med. 1985;13(10):818-29. 5. Teasdale G, Jennett B. Assessment of coma and
impaired consciousness: A Practical Scale. Lancet. 1974;304(7872):81-4.
6. Zimmerman JE, Wagner DP, Draper EA, Wright L, Alzola C, Knaus WA. Evaluation of acute physiology and chronic health evaluation III predictions of hospital mortality in an independent database. Crit Care Med. 1998;26(8):1317-26. 7. Zimmerman JE, Kramer AA, McNair DS, Malila
FM. Acute physiology and chronic health evaluation (APACHE) IV: hospital mortality assessment for today’s critically ill patients. Crit Care Med. 2006;34(5):1297-310.
8. Gupta R, Arora VK. Performance evaluation of APACHE II score for an Indian patient with respiratory problems. Indian J Med Res. 2004;119(6):273-82.
9. Niskanen MI, Kari AA, Nikki PE, Iisalo EI, Kaukinen LI, Rauhala VU, et al. Acute physiology and chronic health evaluation (APACHE II) and Glasgow coma scores as predictors of outcome from intensive care after cardiac arrest. Critical Care Med. 1991;19(12):1465-73.
10. Apache IV Score. Available at: https://intensivecarenetwork.com/Calculators/Files/ Apache4.html.
11. Hanley JA, McNeil BJ. The meaning and use of the area under a receiver operating characteristic (ROC) curve. Radiol. 1982;143(1):29-36.
12. Lemeshow S, Hosmer DW. A review of goodness of fit statistics for use in the development of logistic
regression models. Am J Epidemiol. 1982;115(1):92-106.
13. Breslow MJ, Badawi O. Severity scoring in the critically Ill. Chest. 2012;141(1):245-52.
14. Dabhi AS, Khedekar SS, Mehalingam V. A prospective study of comparison of APACHE-IV and amp; SAPS-II scoring systems and calculation of standardised mortality rate in severe sepsis and septic shock patients. J Clin Diagn Res. 2014;8(10):09-13.
15. Varghese YE, Kalaiselvan MS, Renuka MK, Arunkumar AS. Comparison of acute physiology and chronic health evaluation II (APACHE II) and acute physiology and chronic health evaluation IV (APACHE IV) severity of illness scoring systems, in a multidisciplinary ICU. J Anaesthesiol Clin Pharmacol. 2018;33(2):248-53.
16. Lee H, Shon YJ, Kim H, Paik H, Park HP. Validation of the APACHE IV model and its comparison with the APACHE II, SAPS 3, and Korean SAPS 3 models for the prediction of hospital mortality in a Korean surgical intensive care unit. Korean J Anesthesiol. 2014;67(2):115. 17. Parajuli BD, Shrestha GS, Pradhan B, Amatya R.
Comparison of acute physiology and chronic health evaluation II and acute physiology and chronic health evaluation IV to predict intensive care unit mortality. Indian J Crit Care Med. 2015;19(2):87-91.
18. Ayazoglu TA. A comparison of APACHE II and APACHE IV scoring systems in predicting outcome in patients admitted with stroke to an intensive care unit. Anaesth Pain Intens Care. 2011;15(1):7-12. 19. Zhu BP, Lemeshow S, Hosmer DW, Klar J, Avrunin
J, Teres D. Factors affecting the performance of the models in the mortality probability model II system and strategies of customization: a simulation study. Crit Care Med. 1996;24(1):57-63.
20. Dünser MW, Baelani I, Ganbold L. A review and analysis of intensive care medicine in the least developed countries. Crit Care Med. 2006;34(4):1234-42.