S H O R T R E P O R T
Open Access
A pilot study to assess lead exposure from
routine consumption of coffee and tea
from ceramic mugs: comparison to
California Safe Harbor Levels
Grace L. Anderson
*, Lindsey Garnick, Mai S. Fung and Shannon H. Gaffney
Abstract
Background:Lead (Pb) is a pervasive metal that can be found in, and potentially leached from, ceramics, particularly into acidic foods and beverages. The purpose of this study was to investigate potential lead exposure from coffee and tea consumption, given that both are acidic and routinely consumed from ceramic mugs. We measured the concentration of lead in coffee and tea at two different time points brewed in five readily available mugs known to contain lead. Results were compared to EPA’s action level for drinking water and FDA’s allowable level for bottled water. The measured concentrations, along with consumption patterns, were also used to calculate potential daily lead doses, which were compared to California’s Safe Harbor Levels under Proposition 65. Additionally, we estimated changes in adult and fetal blood lead levels using EPA’s Adult Lead Methodology model. Findings:The results of this pilot study suggest that lead in ceramic mugs can leach into coffee and tea. The measured lead concentrations ranged from 0.2 to 8.6μg/L in coffee, and from <0.2 to 1.6μg/L in tea. No statistical differences were found between the measured concentrations in coffee, tea, or water within each cup, or in the measured concentrations between retention times within each cup. However, a statistically significant difference was observed in the lead concentrations measured between cups, indicating that the lead concentrations were dependent on the cup used, rather than on the beverage or retention time. The estimated daily dose of lead exceeded the California Maximum Allowable Dose Level of 0.5μg per day for one of the five mugs tested. Blood lead levels did not increase above regulatory or guidance values.
Conclusions:This preliminary investigation provides data on potential lead exposures from daily beverage
consumption among typical consumers, relevant to a substantial portion of the population, with particular implications for pregnant women.
Keywords:Lead, Coffee, Tea, Ceramics, Proposition 65, Leaching
Introduction
Lead (Pb) is a naturally occurring metal pervasive in the environment that can cause well-known adverse health effects in humans upon sufficient exposure (Brown and Margolis 2012; ATSDR 2007b). The primary target of lead toxicity in both children and adults is the nervous system, although children are more sensitive to lead’s neurotoxic effects. Moreover, children generally absorb more ingested lead into their blood than do adults.
Children absorb approximately 50% of ingested lead, while adults absorb approximately 10% (ATSDR 2007b, ATSDR 2007a; Philip and Gerson 1994). Lead exposure may beginin utero,as it can cross the placenta (Mason et al. 2014; Brown and Margolis 2012). Decreasing cognitive function has been observed with increasing lead exposure in both children and adults (Mason et al. 2014; Brown and Margolis 2012). IQ deficits of one to five points have been associated with blood lead level increases of 10μg/dL or less in children (ATSDR 2007a). At high levels of expos-ure, lead can cause fatal damage to the brain and kidney
* Correspondence:[email protected]
Cardno ChemRisk, 101 2nd Street, Suite 700, San Francisco, CA 94105, USA
in both adults and children (ATSDR 2007b). Moreover, the International Agency for Research on Cancer (IARC), the U.S. Department of Health and Human Services (DHHS), and the U.S. Environmental Protection Agency (EPA) have all considered lead or lead compounds as probably car-cinogenic in humans (ATSDR 2007b).
Historically, lead was used in gasoline, paint, plumb-ing, and various industrial processes (Levin et al. 2008). Because of concerns over lead’s human health effects, many of these uses have been limited or banned under regulatory actions in the U.S. For example, lead was phased out of gasoline beginning in 1973, residential lead-based paint was banned in 1978, and lead solder in food cans was banned in 1995 (Brown and Margolis 2012). While these efforts over the past several decades have significantly reduced the potential for lead exposure in the U.S., lead poisoning remains an appreciable health concern, especially for children.
In January 2012Consumer Reports published an article indicating that 25% of 88 juices tested exceeded the Food and Drug Administration (FDA) bottled water standard for lead of 5μg/L (CR 2012; USFDA 1995). More recently, the lead-contaminated drinking water in Flint, Michigan, has drawn the public eye to lead poisoning. Based on ele-vated blood lead levels, the President declared a state of emergency in Flint in early 2016 (The White House 2016). The Centers for Disease Control and Prevention (CDC) estimates that at least four million U.S. households con-tain children exposed to “high levels of lead” (CDC 2016b). In 2012, the CDC lowered the blood lead level at which it recommends public health action from 10 to 5 μg/dL for children. Though average blood lead levels have significantly declined in U.S. children since the 1970s, the CDC estimates that approximately half a million U.S. children between the ages of one and five have blood lead levels above 5μg/dL (CDC 2016b; CDC 1997).
The most common route of lead exposure is through in-gestion, and multiple regulatory and guidance values exist to limit lead ingestion in the U.S. (ATSDR 2007a). The Environmental Protection Agency (EPA) has set a lead ac-tion level of 15 ppb in drinking water, for example, and the FDA has set an allowable level for lead in bottled water of 5 ppb (EPA 1991; USFDA 1995). The World Health Organization (WHO) formerly set a provisional tolerable weekly intake (PTWI) of 25μg/kg/week for lead from food and water, but withdrew it in 2010. The WHO stated that it did not issue an updated PTWI because it was “not possible” to establish a value that would be “health protective” (WHO 2010). In California, lead is listed as a chemical known to cause cancer and re-productive toxicity under the Safe Drinking Water and Toxic Enforcement Act (Proposition 65). Accord-ingly, the California Office of Environmental Health Hazard Assessment (OEHHA) has set Safe Harbor Levels
for lead, consisting of a Maximum Allowable Dose Level (MADL) of 0.5 μg/day, based on reproductive toxicity, and a No Significant Risk Level (NSRL) of 15 μg/day based on lead’s potential carcinogenicity (OEHHA 2016b). There is currently a petition to lower the MADL to 0.2 μg/day (Cal/EPA 2015a; Cal/EPA 2015b).
Ceramics with lead-containing paint or glaze are one potential source of lead exposure (ATSDR 2007b). Sev-eral studies have suggested that lead may leach from such ceramics, particularly in acidic environments (Sheets 1997; Mohamed et al. 1995; Levin et al. 2008; Markowitz 2000; Gonzalez de Mejia and Craigmill 1996; Feldman et al. 1999). In fact, the FDA limits the amount of lead in cups and mugs to that which results in no more than 0.5 μg/mL lead in an acidic leaching solution (USFDA 2015). The purpose of the current pilot study, then, was to investigate potential lead exposure from coffee and tea consumption, given that both beverages are acidic and routinely consumed from ceramic mugs in the U.S. Specifically, we measured the concentration of lead in coffee and tea at two time points brewed in five commercial mugs known to contain lead.
Materials and methods
The five mugs chosen for this study were selected because they were found to contain lead in a screening-level as-sessment. Specifically, 24 mugs from the authors’ office were tested using an Olympus Innov-X Delta handheld X-Ray fluorescent (XRF) analyzer. Each mug was measured once with the XRF gun at its highest sensitivity setting, which required the tester to hold the analyzer over the mug for 45 s. The three mugs with the highest resulting lead concentrations (1,223 to 7,034 mg/kg) were selected for the present study. These mugs each had decorative elements and will be referred to by their predominant colors: Green Decorative, Yellow Decorative, and Red Decorative. In addition, two representative mugs were selected from the batch of office mugs baring the authors' company’s logo. These will be referred to as Black Logo1 and Black Logo2. All five mugs selected were in active use in the authors’San Francisco, California, office environment, and were typically washed daily in an automatic dish washer. Four of the five mugs were purchased in the U.S., and one was purchased in Europe (Red Decorative). The mugs all appeared to be in good condition, with no obvious signs of damage or wear.
after the tap had been used intermittently for several hours. Between each event, the cups and all utilized equip-ment were washed with dish soap and water and dried.
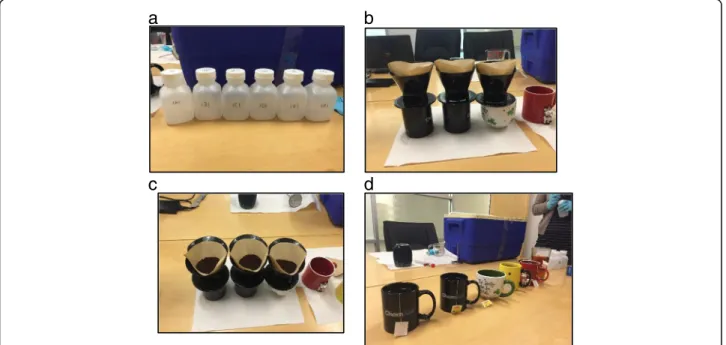
In each sampling situation, the“end temperature”of the beverage was measured immediately before pouring ap-proximately 250 mL of the beverage into a plastic sam-pling container. Samsam-pling containers are depicted in Fig.1a. Four control samples of tap water were also col-lected. All containers were shipped on ice to a laboratory accredited by the Environmental Laboratory Accreditation Program (ELAP), where they were analyzed for the pres-ence of lead using a Perkin Elmer inductively coupled plasma mass spectrometer (IC-PMS), according to EPA Method 200.8. As specified in Method 200.8, with each set of samples, the laboratory ran method calibration blanks and multiple laboratory control samples and dupli-cates to verify the instrument performance and determine instrument precision. A matrix spike of 50μg/L lead was utilized as a calibration procedure.
Water
Water was boiled in an electric kettle, and approximately 300 mL of water was poured into each of the six cups. After 30 min had elapsed, the water was stirred. After 60 min had elapsed, the water was stirred again, the temperature of the water was recorded, and the water was poured into the sample containers. The scenario was repeated for each of the six cups such that a total of 12 samples were collected.
Coffee
Coffee was brewed utilizing a single cup pour-over cone with a paper filter (Fig.1b, c). Approximately 300 mL
boiling water was poured over three teaspoons of a na-tionally available, freshly-ground, medium roast, 100% Arabica coffee for each of the six cups. Two scenarios were performed in duplicate: in the first, the coffee remained in the cup for 10 min, and in the second, the coffee remained in the cup for 60 min before being poured into the sample container. After 5 min had elapsed, the pour-over cone was removed, and the coffee was stirred in both scenarios. The 60-min samples were also stirred after 30 min, and all samples were stirred prior to transfer to the sampling containers.
Tea
Tea was prepared by pouring boiling water over one na-tionally available, 2 g black tea bag in each cup (Fig.1d). Water was boiled in an electric tea kettle, and 300 mL of water was poured into each cup. Two scenarios were performed in duplicate: in the first, the tea remained in the cup for 10 min, and in the second, the tea remained in the cup for 60 min before being poured into the sam-ple container. The tea bag was dunked in the water sev-eral times within 5 min of steeping in both scenarios. After 5 min of steeping, the tea bag was removed, and the tea was stirred. The 60-min samples were also stirred after 30 min, and all samples were stirred prior to transfer to the sampling containers.
Tap water controls
On a separate day from the beverage making scenarios, two samples of tap water that had been boiled and retained in the electric tea kettle for 60 min were col-lected. After boiling was reached, the water was allowed
a
b
c
d
to cool, was stirred inside the kettle at the 30 and 60-min marks, and then was poured into the sampling con-tainers. Two additional samples were collected directly from the tap.
Risk assessment: comparison to regulatory limits For simple comparison purposes, and to put our results in the context of regulatory limits, our measured con-centrations were compared to the EPA’s lead action level of 15 ppb in drinking water and the FDA’s allowable level for lead in bottled water of 5 ppb.
The sampling results were also utilized along with gen-eral assumptions to determine the level of lead exposure expected from daily consumption of coffee and tea from the cups. These estimated daily doses were compared to the current Safe Harbor Levels under Proposition 65 in
California (MADL: 0.5 μg/day, NSRL: 15 μg/day). The
EPA currently has no Reference Dose for lead.
The daily dose of lead was calculated simply as the amount of lead in a serving of the beverage from the study cups multiplied by the number of servings typic-ally consumed in one day, or:
Amount of LeadðμgÞ Beverage Serving Lð Þ
Beverage Servings Lð Þ Day
¼Amount of Lead Ingested per Dayðμg=dayÞ
Basing these calculations on typical coffee and tea con-sumption is appropriate, since Proposition 65 dictates that the MADL be calculated “using the reasonably an-ticipated rate of intake or exposure for average users of
the consumer product” (OEHHA 2016a). Note that our
estimate accounts only for lead exposure from drinking beverages from the subject cups, and ignores any other potential sources or routes of lead exposure.
Coffee
A 2009 survey by the National Coffee Association re-ported that the average consumption among coffee drinkers in the U.S. aged 18 and older was 3.3 eight-ounce cups per day (USFDA 2012). We thus assumed a daily consumption of 26.4 fluid ounces, or 0.78 L, of cof-fee per day in our risk assessment.
Tea
According to the most recent available data (2011–2012) from the National Health and Nutrition Examination Survey (NHANES), median tea consumption among U.S. tea drinkers age 18 to 80 is 355.2 g per day, or 12.01 fluid ounces per day (CDC 2014). We thus as-sumed a daily consumption of 12.01 fluid ounces, or 0.36 L, of tea per day in our risk assessment.
Estimation of blood lead levels following exposure to lead from mugs
As another point of comparison, we utilized our mea-sured concentration data to estimate changes in adult blood lead levels (BLLs) using the EPA’s Adult Lead Methodology (ALM) model. The ALM model has previ-ously been used to estimate BLLs as a result of exposure to lead from beverages and consumer products (Monnot et al. 2015). The average baseline BLL for adults was as-sumed to be 1.0μg/dL (ALM default value); however, we also ran the model assuming a baseline of 0 μg/dL in order to determine the contribution of lead from the beverages ingested in the lead-containing ceramic mugs. The gastrointestinal absorption for lead was assumed to be 12% in adults, the default for the model. Any inges-tion from soil and dust was assumed to be zero because of their irrelevance to beverage exposure. The average consumption of coffee per day (in g/day) was used be-cause average coffee consumption is higher than average tea consumption. We assumed an exposure frequency of 365 days/year, assuming that a person would drink the same amount of the beverage every day. The BLLs esti-mated from the model were compared to regulatory and guidance values for BLLs set by the CDC and EPA. Add-itionally, the model was used to estimate fetal blood lead concentrations in women exposed to lead from bever-ages contaminated by ceramic mugs.
Findings
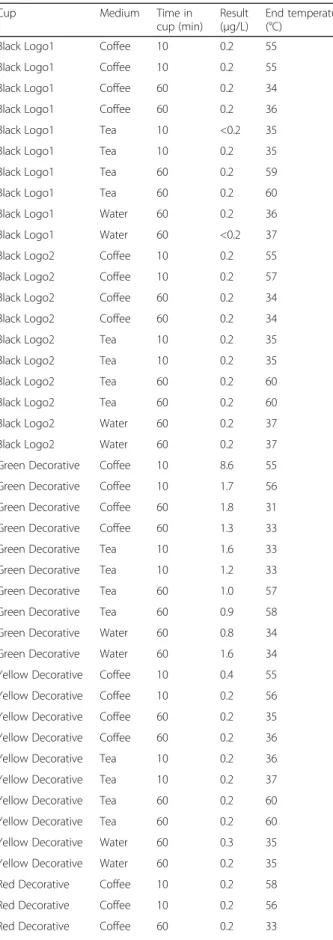
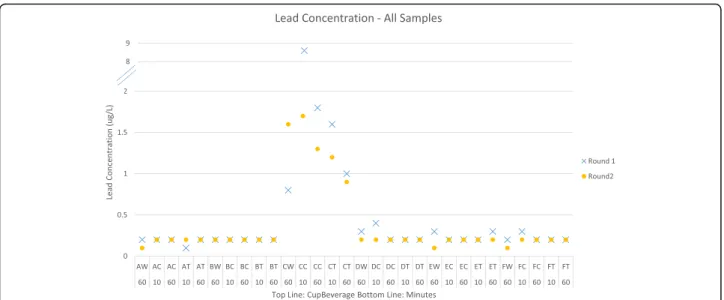
Lead was measured at levels at or above the limit of
de-tection (0.2 μg/L) in 56 out of 60 samples (93.33%)
(Table 1, Fig. 2). The percent recovery from quality con-trol samples ranged from 95.6 to 102%. The percent re-covery from matrix spikes ranged from 98.3 to 102%. Out of the four samples for which the lead concentra-tion was below the limit of detecconcentra-tion, three results were from 60 min water samples and one was from a 10 min tea sample. The total range of lead levels measured was <0.2 μg/L to 8.6 μg/L. The highest concentration of 8.6μg/L came from a 10 min coffee sample in the Green Decorative mug. The other lead concentrations mea-sured from the Green Decorative mug, though consist-ently higher than the measures for all other cups, did not exceed 1.8 μg/L. All four tap water control samples resulted in measurements below the limit of detection (<0.2μg/L) (Results not shown).
The Mann-Whitney Wilcoxon test was performed be-tween the coffee samples retained in the cups for 10 and 60 min, and between the tea samples retained in the cups for 10 and 60 min, respectively. No statistical sig-nificance was found for either test, indicating that there was no difference in lead concentrations measured de-pending on the amount of time the beverages were retained in the cups (coffee samples: p= 0.43; tea sam-ples:p= 0.60). As a result of this test, the 10 and 60 min samples for coffee and tea, respectively, were pooled from each cup to perform the Kruskal-Wallis test. This test was performed to determine if there was a difference in lead measured depending on the beverage in the cups. No statistical significance was found (p= 0.64). Finally, the Kruskal-Wallis test was performed on the samples from each cup to determine if there was a difference in lead concentrations measured depending on which cup was used. The Nemenyi multiple comparison test was utilized to determine statistical differences among the cups, and it found that samples from the Green Decora-tive mug were statistically significantly higher than sam-ples from all other cups (p= 0.0001–0.0125).
Risk assessment: comparison to regulatory limits Measured lead concentrations in the beverage samples from the six cups in this study ranged from <0.2 to 8.6 μg/L. Mean lead concentrations across all beverage
scenarios were 0.18 μg/L in the Black Logo1 mug,
0.2μg/L in the Black Logo2 mug, 2.05μg/L in the Green
Decorative mug, 0.23 μg/L in the Yellow Decorative
Table 1Measured lead concentrations by cup, beverage, and time
Cup Medium Time in
cup (min) Result (μg/L)
End temperature (°C)
Black Logo1 Coffee 10 0.2 55
Black Logo1 Coffee 10 0.2 55
Black Logo1 Coffee 60 0.2 34
Black Logo1 Coffee 60 0.2 36
Black Logo1 Tea 10 <0.2 35
Black Logo1 Tea 10 0.2 35
Black Logo1 Tea 60 0.2 59
Black Logo1 Tea 60 0.2 60
Black Logo1 Water 60 0.2 36
Black Logo1 Water 60 <0.2 37
Black Logo2 Coffee 10 0.2 55
Black Logo2 Coffee 10 0.2 57
Black Logo2 Coffee 60 0.2 34
Black Logo2 Coffee 60 0.2 34
Black Logo2 Tea 10 0.2 35
Black Logo2 Tea 10 0.2 35
Black Logo2 Tea 60 0.2 60
Black Logo2 Tea 60 0.2 60
Black Logo2 Water 60 0.2 37
Black Logo2 Water 60 0.2 37
Green Decorative Coffee 10 8.6 55
Green Decorative Coffee 10 1.7 56
Green Decorative Coffee 60 1.8 31
Green Decorative Coffee 60 1.3 33
Green Decorative Tea 10 1.6 33
Green Decorative Tea 10 1.2 33
Green Decorative Tea 60 1.0 57
Green Decorative Tea 60 0.9 58
Green Decorative Water 60 0.8 34
Green Decorative Water 60 1.6 34
Yellow Decorative Coffee 10 0.4 55
Yellow Decorative Coffee 10 0.2 56
Yellow Decorative Coffee 60 0.2 35
Yellow Decorative Coffee 60 0.2 36
Yellow Decorative Tea 10 0.2 36
Yellow Decorative Tea 10 0.2 37
Yellow Decorative Tea 60 0.2 60
Yellow Decorative Tea 60 0.2 60
Yellow Decorative Water 60 0.3 35
Yellow Decorative Water 60 0.2 35
Red Decorative Coffee 10 0.2 58
Red Decorative Coffee 10 0.2 56
Red Decorative Coffee 60 0.2 33
Table 1Measured lead concentrations by cup, beverage, and
time(Continued)
Red Decorative Coffee 60 0.2 36
Red Decorative Tea 10 0.2 35
Red Decorative Tea 10 0.2 35
Red Decorative Tea 60 0.3 60
Red Decorative Tea 60 0.2 60
Red Decorative Water 60 0.3 35
Red Decorative Water 60 <0.2 37
Glass Coffee 10 0.3 59
Glass Coffee 10 0.2 58
Glass Coffee 60 0.2 32
Glass Coffee 60 0.2 35
Glass Tea 10 0.2 35
Glass Tea 10 0.2 35
Glass Tea 60 0.2 57
Glass Tea 60 0.2 60
Glass Water 60 0.2 36
mug, 0.21μg/L in the Red Decorative mug, and 0.2μg/L in the glass cup (Table 2).
All measured lead concentrations were below the EPA’s lead action level of 15 ppb in drinking water. How-ever, the highest concentration measured from the
Green Decorative mug (8.6 μg/L or 8.6 ppb) exceeded
the FDA’s allowable level for lead in bottled water of 5 ppb. This simple comparison, although interesting, does not have clear health implications, since these EPA and FDA health - based values use water consumption rates, which are much higher than coffee or tea rates of consumption.
For comparison the to the California Proposition 65 Safe Harbor Levels, given that the samples from the Green Decorative mug were statistically different from samples from all other cups, we calculated daily lead in-take based on three values: 1) the mean lead concentra-tion from all cups excluding the Green Decorative mug
(0.2 μg/L); 2) the mean lead concentration from the Green Decorative mug (2.05μg/L); and 3) the maximum concentration measured from the Green Decorative mug (8.6 μg/L). These three values incorporate all beverage scenarios because, as described above, there was no stat-istical difference between beverages or retention time in the cups in this study.
Coffee
Using the mean lead concentration of 0.2 μg/L from all cups except the Green Decorative mug, and the average daily coffee intake among coffee drinkers of 0.78 L, the daily dose of lead from coffee consumption would be 0.156 μg. This dose is below both the current
Propos-ition 65 NSRL of 15 μg/day and the MADL of 0.5 μg/
day. Using the mean lead concentration of 2.05 μg/L
from the Green Decorative mug, the daily dose of lead for the average coffee drinker would be 1.60 μg, which exceeds the current MADL by over three fold. Using the
maximum measured lead concentration of 8.6 μg/L and
the same average daily coffee intake of 0.78 L, the daily dose of lead from coffee consumption is estimated to be
6.71 μg/day, which is 13.4 times the current MADL.
Even consuming one eight-ounce serving of coffee with this concentration of lead would exceed the MADL four-fold, resulting in a daily dose of lead of 2.03μg.
Tea
Using the mean lead concentration of 0.2 μg/L from all cups except the Green Decorative mug and the average daily tea intake among tea drinkers of 0.36 L, the daily dose of lead from tea consumption would be 0.071 μg,
Fig. 2Lead Concentration–All Samples. Measured lead concentrations by mug/cup, beverage and time. Cup A = Black Logo1 mug; Cup B = Black Logo2 mug; Cup C = Green Decorative mug; Cup D = Yellow Decorative mug; Cup E = Red Decorative mug; Cup F = Glass Cup. Beverage W = Water. Beverage C = Coffee. Beverage T = Tea. Samples below the limit of detection (<0.2μg/L) graphed at the limit of detection divided by the square root of two (0.1μg/L)
Table 2Range of measured lead concentrations by cup
Cup Name Lead Concentration (μg/L)
Min Max Mean Median
Black Logo1 <0.2 0.2 0.18 0.2
Black Logo2 0.2 0.2 0.2 0.2
Green Decorative 0.8 8.6 2.05 1.45
Yellow Decorative 0.2 0.4 0.23 0.2
Red Decorative <0.2 0.3 0.21 0.2
Glass <0.2 0.3 0.2 0.2
Concentrations reported to be below the limit of detection (<0.2μg/L) were
which is below both the current Proposition 65 NSRL
of 15 μg/day and the MADL of 0.5 μg/day. Using the
mean lead concentration of 2.05 μg/L from the Green
Decorative mug, the daily dose of lead for the average
tea drinker would be 0.728 μg, which exceeds the
current MADL. Using the maximum lead concentra-tion of 8.6 μg/L and the same average daily tea intake of 0.36 L, the daily dose of lead from tea consump-tion would be 3.05 μg/day, or approximately six times the current MADL.
BLLs resulting from exposure scenario
Table 3 represents the predicted BLLs for adults and fe-tuses based on the measured lead concentrations in this study. Two lead concentrations were used to estimate BLLs; one scenario used the maximum concentration of lead measured from all beverages (8.6 μg/L), and the other used the mean concentration of lead measured from all beverages, excluding results from the Green Decorative mug (0.2 μg/L). Based on the average con-sumption of coffee (0.78 L per day, or approximately 780 g assuming coffee has the same density as water), the predicted BLLs for adults ingesting coffee daily ranged from 0.0 to 1.3 μg/dL and from 0.0 to 1.2μg/dL in fe-tuses, assuming baseline BLLs of 0 and 1μg/dL, respect-ively. The contribution of lead, therefore, from coffee from the cups was estimated to increase BLLs above
background by a maximum of 0.3 μg/dL in adults and
by 0.2 μg/dL in fetuses. All of the estimated BLLs were
below the BLL of concern of 5 μg/dL set by the CDC
and 10 μg/dL set by EPA, and did not raise BLLs by
more than +1.0 μg/dL, which is California’s proposed
benchmark for risk assessment (Carlisle and Dowling 2007; CDC 2016a; EPA 2016).
Discussion
Lead was detected in over 90% of our beverage samples; most samples resulted in concentrations similar to the analytical limit of detection (0.2 μg/L). However, in one of the mugs tested (Green Decorative), the results ranged from 0.8 to 8.6 μg/L. This finding indicates that under the conditions of this study, lead may leach from mugs into hot beverages such as coffee and tea, or even hot water, and result in individual lead exposures well above maximum allowable dose levels set by the State of California. Although this finding only pertained to one of the five mugs tested, it was unexpected, given that these mugs were randomly selected from an office envir-onment, and that all but one were purchased in the U.S. From the small sample size of this study no conclusion can be drawn about the prevalence of mugs with leach-able lead in the U.S. market; however, the findings do in-dicate a need for further research with greater sample sizes (and thereby more robust statistical analyses) in this area. Regarding blood lead levels, we found that background lead exposure in the models primarily con-tributed to the BLLs for both adults and fetal exposures. As shown in Table 3, lead ingestion from coffee using the highest concentration measured in this study in-creased the BLL estimated in adults by 0.3μg/dL. Given the limitations of this study, these results should be con-sidered a screening-level assessment.
The U.S. FDA regulates lead content in ceramics used with foods, and in mugs specifically. In 1970, the FDA
Table 3Estimated blood lead levels following exposure to lead from mugs
Key
a
Chosen value for background
b
Default value from the ALM model
c
Maximum Pb concentration in beverages from results
d
conducted a survey of imported pottery and found“high
levels” of lead leaching from the products (USFDA
1979a, p. 51237). The FDA instituted a compliance pro-gram for domestic and international pottery in 1971, limiting the amount of lead that leached from pottery into a leaching solution to 7 μg/L (USFDA 1979a). In 1979, the FDA revised the guidelines for lead leached from ceramic foodware based on a recommended toler-able total lead intake value of 100μg/day for infants up to 6 months of age and of 150μg/day for children from 6 months to 2 years of age, based on the endpoint of al-tered heme synthesis (USFDA 1979b; USFDA 1989). In response to new data and updated international refer-ence values, in 1989 the FDA adopted a range of 6 to 18 μg/day as the provisional tolerable lead intake from food for a 10 kg child, and proposed that the guidelines for ceramic foodware again be lowered (USFDA 1989). The agency noted at that time that it was not possible to establish a threshold for lead toxicity (USFDA 1989).
In 1992, the lead release guidelines were amended to include levels specific to cups and mugs “because these articles are frequently used under conditions that may enhance lead leaching” (USFDA 1992, p. 29734). In par-ticular, the FDA noted that cups and mugs are“generally used to hold acidic beverages, such as…coffee or tea” (USFDA 1992, p. 29735). The FDA reported that the acidity in conjunction with the higher temperatures of these beverages enhances the lead leaching rate (USFDA 1992). According to the 1992 guidance, the FDA “may take enforcement action” when cups or mugs exceed a lead level of 0.5μg/mL in a 4% acetic acid leaching solu-tion in any of six mug or cup units examined (USFDA 1992, p. 29735). This limit currently is still in place for cups and mugs.
The FDA reported that based on its request for infor-mation and subsequent review, the amount of lead that will leach into a leaching solution is approximately 2.5 to 5 times the amount that will leach into “hot coffee during 15 to 30 min”(USFDA 1992, p. 29735). Applying this estimation to our results, we can estimate that 2 to
43 μg/L lead would leach from the Green Decorative
mug into leaching solution, which is 0.002 to 0.043μg/ mL, and well within the FDA’s limit of 0.5 μg/mL. Our results, then, suggest that mugs in compliance with federal regulatory limits for lead may still well-exceed California’s Safe Harbor Levels.
Furthermore, the State of California recently proposed reducing the lead MADL to 0.2μg/day based on model-ing of exposure levels that would result in maximum blood lead levels of 15 μg/dL (Cal/EPA 2015a; Cal/EPA 2015b). In 2015, the State clarified that the MADL is intended to be a daily exposure dose, but that alternative exposure doses (increased doses) are plausible within the law, if exposures can be determined not to occur daily
(Cal/EPA 2015a). Nonetheless, given the proposed MADL, and assuming mugs are used daily, coffee consumption from the four mugs with lower associated lead levels in this study (mean of 0.2μg/L, or daily intake of 0.156μg) nearly results in exposures above the proposed MADL. The lower MADL would also further widen the discrep-ancy between California and federal compliance levels.
Given the existing low MADL, and the fact that the proposed MADL for lead is less than half of the current MADL, understanding the implications for product test-ing is important. Many analytical methods are not sensi-tive enough to detect the presence of lead at meaningful concentrations in terms of exposure levels in compliance with the Safe Harbor Level. Inherent variability in mea-surements at such low levels of analytical detection also exists, which must be characterized and understood properly in order to rely on them for regulatory compli-ance. For example, the two 10 min coffee samples in the
Green Decorative mug were 1.7 and 8.6 μg/L, a
seem-ingly wide range. Also, coffee that had been in the glass cup for 10 min had a detected lead concentration of 0.3 μg/L, but the same coffee after 60 min in the glass resulted in a detected lead concentration of only 0.2μg/L. These ranges and “reductions” highlight the uncertainty and normal variations in the measurements.
In addition, definitively identifying and segregating the relative contributions of lead from different sources in this study is not possible. Lead is ubiquitous in our en-vironment, and its presence in glass, equipment, tea, cof-fee, and drinking water cannot be ruled out. Several studies, for example, have reported concentrations of lead in solid coffee beans or solid residues of coffee infu-sions ranging from 0.053 to 1.239 μg/g (Nędzarek et al. 2013; Onianwa et al. 1999; Federal Republic of Germany and Federal Länder unknown; Santos et al. 2004; Oth-man 2010). One study reported lead concentrations in
li-quid coffee of 2.37 and 2.57 μg/L (Ong 2014), and
These other highly variable potential sources of lead ex-posure must be considered when assessing total lead in-take; in this study, though, the beverage lead content appeared to be most strongly determined by the mug.
To our knowledge, ours is one of only a handful of stud-ies in the peer-reviewed literature to evaluate lead leaching into coffee or tea from lead-containing ceramics. In 1985, Wallace et al. tested Italian-originating coffee mugs found in a U.S. household. The authors reported that approxi-mately 4000μg of lead were leached into a 250 mL serving of coffee (16,000 μg/L) over 15 min at a temperature of 65 °C and a pH of 5.1 (Wallace et al. 1985). Wallace et al. stated that the mugs were “badly degraded,” and that a similar new cup released only 200μg of lead (800μg/L) in the same conditions (Wallace et al. 1985, p. 290). Ajmal et al. (1997) investigated lead leaching into tea from ceramic mugs in India. They reported that measured lead concen-trations in the tea were below the limit of detection (Ajmal et al. 1997). To our knowledge, then, the current study is the first to evaluate lead leaching into coffee and tea from ceramic mugs purchased in the 21st century in the U.S. (with the exception of the Red Decorative mug, which was purchased in Europe).
A greater number of studies have investigated lead leaching from ceramics associated with various other foods and beverages (Sheets 1997; Mohamed et al. 1995; Levin et al. 2008; Markowitz 2000; Gonzalez de Mejia and Craigmill 1996; Feldman et al. 1999; Belgaied 2003; Hight 1996; Valadez-Vega et al. 2011). In studies that measured lead concentrations leached from a variety of ceramics using 4% acetic acid (the same leaching solu-tion used by the FDA to evaluate ceramics), reported values reached up to 2004.7 ppm (2,004,700 μg/L), sig-nificantly higher than values we obtained in this study (Gonzalez de Mejia and Craigmill 1996). Many of these studies also evaluated the amount of lead that leached into various acidic and non acidic foods, such as salsa, beans, tamarind juice, pickle juice, wine, and milk prod-ucts, with results reaching up to 244 ppm (244,000μg/L). The highest value was associated with salsa, a highly acidic food (Gonzalez de Mejia and Craigmill 1996). The study, however, noted that there was a mean background level of lead of 0.93 ± 0.13 ppm in the salsa.
Overall, the potential for lead ingestion from contami-nated ceramic mugs is minimal when compared to other sources, such as food. The Agency for Toxic Substances and Disease Registry (ATSDR) reported that the average daily intake of lead from food sources in the general
population is approximately 56.5 μg/day (ATSDR
2007a). In comparison, the maximum daily lead intake from drinking 3.3 eight-ounce cups of coffee based on the data collected in our study resulted in a dose of 6.71μg, over eight times less than the average daily lead intake from food. Nonetheless, exposure to lead should
be minimized to the extent possible. The U.S. EPA does not publish a safe dose for lead because it felt it was“ in-appropriate to develop a reference dose (RfD) for inor-ganic lead (and lead compounds) because some of the health effects associated with exposure to lead occur at blood lead levels as low as to be essentially without a
threshold” (ATSDR 2007a, p. 403). Similarly, WHO
withdrew its provisional tolerable weekly intake (PTWI) for lead in 2010 because it did not believe establishing a value that would be “health protective” would be pos-sible (WHO 2010).
This study is limited in that a small number of mugs were randomly selected from the authors’work environ-ment, and were not purchased for the purpose of evalu-ating the full range of lead contamination in ceramic mugs. We also were not able to test multiple mugs from the same manufacturer or origin, with the exception of the black logo mugs. Overall, then, this study can be considered a pilot study, and the results should be sidered as such until additional research can be con-ducted, and more samples collected. This preliminary investigation, however, provides data on potential lead exposures from daily beverage consumption among typ-ical consumers, with particular implications for pregnant or breastfeeding women. This potential source of lead exposure is less well-characterized than are some other lead exposure sources (e.g., paint, gasoline), yet is rele-vant to a substantial portion of the U.S. population.
Acknowledgements
We would like thank Kevin Towle for his assistance with statistical analysis of our data. We would like to acknowledge the analytical work performed by Pat-Chem Laboratories.
Authors’contributions
All named authors contributed significantly to the development and writing of this manuscript. Generally, GA took the lead in designing the study; LG took the lead in estimating blood lead levels; MF took the lead in the statistical analysis; and SG assisted with the design of the study and took the lead in the comparison to regulatory limits. All authors were involved in executing the study. All authors read and approved the final manuscript.
Authors’information
G.A. has a bachelor of science in molecular toxicology. She performs human health risk assessments in her current position as a consultant. She has a particular interest in consumer product safety and compliance. L.G. has a bachelor of science in environmental toxicology. She currently works as a consultant and performs exposure assessment and human health risk assessments, specifically regarding consumer products and occupational hazards.
M.F. has a masters of public health in environmental health science. Her areas of interest include exposure assessment, risk assessment, product sustainability, and environmental health.
S.G. has a Masters of Health Science in industrial hygiene and a PhD in Environmental Health Sciences. She also received a certificate in Risk Sciences and Public Policy. She is a Principal Health Scientist at Cardno ChemRisk, and is interested in characterizing exposure and potentially related health risks to consumers, workers and communities.
Competing interest
Received: 12 October 2016 Accepted: 13 January 2017
References
Ajmal M, Khan A, Nomani AA, Ahmed S. Heavy metals: leaching from glazed surfaces of tea mugs. Sci Total Environ. 1997;207(1):49–54.
Al-Othman ZA, Yilmaz E, Sumayli HM, Soylak M. Evaluation of trace metals in tea samples from Jeddah and Jazan, Saudi Arabia by atomic absorption spectrometry. Bull Environ Contam Toxicol. 2012;89(6):1216–9. doi:10.1007/ s00128-012-0842-1.
Ashu R, Chandravanshi BS. Concentration levels of metals in commercially available Ethiopian roasted coffee powders and their infusions. Bull Chem Soc Ethiop. 2011;25(1):11–24.
ATSDR. Toxicological profile for lead. Atlanta: U.S. Dept. of Health and Human Services, Public Health Service, Agency for Toxic Substances and Disease Registry; 2007a.
ATSDR. Lead - ToxFAQs. August 2007. Substances and disease registry. Atlanta: Division of Toxicology and Human Health Sciences; 2007b.
Belgaied JE. Release of heavy metals from Tunisian traditional earthenware. Food Chem Toxicol. 2003;41(1):95–8.
Brown MJ, Margolis S. Morbidity and Mortality Weekly Report. Volume 61 (Supplement). Lead in drinking water and human blood lead levels in the United States. Atlanta: U.S. Department of Health and Human Services, Centers for Disease Control and Prevention; 2012.
Cal/EPA. The center for environmental health petition requesting repeal or amendment of the safe harbor level for lead. October 14, 2015. Sacramento: California Environmental Protection Agency, Office of Environmental Health Hazard Assessment; 2015a.
Cal/EPA. Pre-regulatory proposal: possible amendments to section 25805. Specific regulatory levels: chemicals causing reproductive toxicity. October 14, 2015. Sacramento: California Environmental Protection Agency, Office of Environmental Health Hazard Assessment; 2015b.
Carlisle J, Dowling K. Development of health criteria for school site risk assessment pursuant to health and safety code section 901(g): child-specific benchmark change in blood lead concentration for school site risk assessment. California Environmental Protection Agency, Office of Environmental Health Hazard Assessment, Integrated Risk Assessment Branch; 2007.
CDC. Blood lead levels keep dropping; New guidelines recommended for those most vulnerable. 1997. http://www.cdc.gov/media/pressrel/lead.htm Accessed 18 May 2016.
CDC. National Center for Health Statistics (NCHS). National Health and Nutrition Examination Survey: NHANES 2011-2012 Dietary Data. U.S. Department of Health and Human Services, 2014. https://wwwn.cdc.gov/nchs/nhanes/ search/DataPage.aspx?Component=Dietary&CycleBeginYear=2011. Accessed 18 May 2016.
CDC. Lead - New blood lead level information. What Do parents need to know to protect their children? 2016a. https://www.cdc.gov/nceh/lead/acclpp/ blood_lead_levels.htm Accessed 23 June 2016.
CDC. Lead. 2016b. http://www.cdc.gov/nceh/lead/ Accessed 18 May 2016. Consumer Reports. Results of Our apple juice and grape juice tests. 2012. https://
www.consumerreports.org/content/dam/cro/magazine-articles/2012/January/ Consumer%20Reports%20Arsenic%20Test%20Results%20January%202012.pdf. Accessed 18 May 2016.
EPA. 40 CFR parts 141 and 142. [FRL-3823-5]. RIN 2040-AB51. Drinking water regulations. Maximum contaminant level goals and national primary drinking water regulations for lead and copper. Final rule. Fed Reg. 1991;56(110): 26460–564.
EPA. Lead at superfund sites. 2016. https://www.epa.gov/superfund/lead-superfund-sites Accessed 30 June 2016.
Federal Republic of Germany, Federal Länder (unknown) Results of the German Food Monitoring of the Years 1995-2002. Federal Office of Consumer Protection and Food Safety, Bundesamt fur Verbraucherschuta und Levensmittelsicherheit (BVL), Berlin
Feldman N, Lamp C, Craigmill A. Lead leaching in ceramics difficult to predict. Calif Agric. 1999;53(5):20–3.
Gonzalez de Mejia E, Craigmill AL. Transfer of lead from lead-glazed ceramics to food. Arch Environ Contam Toxicol. 1996;31(4):581–4.
Hight SC. Lead migration from lead crystal wine glasses. Food Addit Contam. 1996;13(7):747–65. doi:10.1080/02652039609374463.
Levin R, Brown MJ, Kashtock ME, Jacobs DE, Whelan EA, Rodman J, Schock MR, Padilla A, Sinks T. Lead exposures in U.S. Children, 2008: implications for prevention. Environ Health Perspect. 2008;116(10):1285–93. doi:10.1289/ehp. 11241.
Li L, Fu Q-L, Achal V, Liu Y. A comparison of the potential health risk of aluminum and heavy metals in tea leaves and tea infusion of commercially available green tea in Jiangxi, China. Environ Monit Assess. 2015;187(5):1–12. Markowitz M. Lead poisoning. Pediatr Rev. 2000;21(10):327–35.
Mason LH, Harp JP, Han DY. Pb neurotoxicity: neuropsychological effects of lead toxicity. Biomed Res Int. 2014;2014:840547. doi:10.1155/2014/840547. Mohamed N, Chin YM, Pok FW. Leaching of lead from local ceramic tableware.
Food Chem. 1995;54(3):245–9.
Monnot AD, Christian WV, Abramson MM, Follansbee MH. An exposure and health risk assessment of lead (Pb) in lipstick. Food Chem Toxicol. 2015;80: 253–60.
Nędzarek A, Tórz A, Karakiewicz B, Clark JS, Laszczyńska M, Kaleta A, Adler G. Concentrations of heavy metals (Mn, Co, Ni, Cr, Ag, Pb) in coffee. Acta Biochim Pol. 2013;60(4):623–7.
OEHHA. 27 CCR § 25821. Level of exposure to chemicals causing reproductive toxicity. 2016a.
OEHHA. Proposition 65 No Significant Risk Levels (NSRLs) for Carcinogens and Maximum Allowable Dose Levels (MADLs) for Chemicals Causing Reproductive Toxicity. April 2016. Sacramento: California Environmental Protection Agency, Office of Environmental Health Hazard Assessment; 2016b.
Ong K. Determination of lead and cadmium in foods by graphite furnace atomic absorption spectroscopy. 2014. https://www.perkinelmer.com/lab-solutions/ resources/docs/APP_PinAAcle-900H-Lead-Cadmium-in-Food-011965_01.pdf Accessed 14 Sept 2016.
Onianwa P, Adetola I, Iwegbue C, Ojo M, Tella O. Trace heavy metals
composition of some Nigerian beverages and food drinks. Food Chem. 1999; 66(3):275–9.
Othman ZAA. Lead contamination in selected foods from Riyadh city market and estimation of the daily intake. Molecules. 2010;15(10):7482–97.
Philip AT, Gerson B. Lead poisoning- Part I. Incidence, etiology, and toxicokinetics. Clin Lab Med. 1994;14(2):423–44.
Santos EE, Lauria DC, Porto da Silveira CL. Assessment of daily intake of trace elements due to consumption of foodstuffs by adult inhabitants of Rio de Janeiro city. Sci Total Environ. 2004;327(1):69–79.
Sheets RW. Extraction of lead, cadmium and zinc from overglaze decorations on ceramic dinnerware by acidic and basic food substances. Sci Total Environ. 1997;197(1–3):167–75.
Shekoohiyan S, Ghoochani M, Mohagheghian A, Mahvi AH, Yunesian M, Nazmara S. Determination of lead, cadmium and arsenic in infusion tea cultivated in north of Iran. Iranian J Environ Health Sci Eng. 2012;9(1):37.
Shokrzadeh M, Saberyan M, Saeedi Saravi S. Assessment of lead (Pb) and cadmium (Cd) in 10 samples of Iranian and foreign consumed tea leaves and dissolved beverages. Toxicol Environ Chem. 2008;90(5):879–83.
State of Michigan. Taking action on Flint water: Flint Resdiential Testing Report -results collected through June 27, 2016. 2016. http://www.michigan.gov/ flintwater/0,6092,7-345-76292_76294_76297—,00.html.
The White House. President obama signs michigan emergency declaration. January 16, 2016. 2016. https://www.whitehouse.gov/the-press-office/2016/ 01/16/president-obama-signs-michigan-emergency-declaration. Accessed 30 June 2016.
USFDA. 21 CFR chapter I, subchapter B [Docket No. 79N-0200]. lead in food; advance notice of proposed rulemaking: request for data. Advance notice of proposed rulemaking. Fed Reg. 1979a;44(171):51233–42. August 31, 1979. USFDA. Limits on leachable lead and cadmium from ceramic ware for food use:
availability of administrative guidelines. Fed Reg. 1979b;44(156):47162. August 10, 1979.
USFDA. 21 CFR Part 109 [Docket No. 89N-0014] RIN: 0905-AC91. Lead from Ceramic Pitchers. Proposed Rule. Fed Reg. 1989;54(104):23485–9. June 1, 1989. USFDA. Lead in ceramic foodware; revised compliance policy guide; availability.
Notice. Fed Reg. 1992;57(129):29734–6. July 6, 1992.
USFDA. 21 CFR Parts 103, 129, 165, and 184. [Docket No. 88P-0030]. RIN 0910-AA11. Beverages: Bottled Water. Final Action. Fed Reg. 1995;60(218):57076– 130. November 13, 1995.
USFDA. FDA Comments on Subcontract Number: 70000073494, Somogyi 2010,
“Caffeine Intake by the U.S. Population”. 2012. http://www.fda.gov/ downloads/aboutfda/centersoffices/officeoffoods/cfsan/
USFDA. CPG Sec. 545.450 Pottery (Ceramics); Import and Domestic - Lead Contamination. 2015. http://www.fda.gov/ICECI/ComplianceManuals/ CompliancePolicyGuidanceManual/ucm074516.htm. Accessed 23 June 2016. Valadez-Vega C, Zúñiga-Pérez C, Quintanar-Gómez S, Morales-González JA,
Madrigal-Santillán E, Villagómez-Ibarra JR, Sumaya-Martínez MT, García-Paredes JD. Lead, cadmium and cobalt (Pb, Cd, and Co) leaching of glass-clay containers by pH effect of food. Int J Mol Sci. 2011;12(12):2336–50. doi: 10.3390/ijms12042336.
Wallace DM, Kalman DA, Bird TD. Hazardous lead release from glazed dinnerware: a cautionary note. Sci Total Environ. 1985;44(3):289–92. WHO. Exposure to lead: a major public health concern. 2010. http://www.who.
int/ipcs/features/lead..pdf?ua=1. Accessed 18 May 2016.
Zheng H, Li JL, Li HH, Hu GC, Li HS. Analysis of trace metals and perfluorinated compounds in 43 representative tea products from South China. J Food Sci. 2014;79(6):C1123–9. doi:10.1111/1750-3841.12470.
Submit your manuscript to a
journal and benefi t from:
7Convenient online submission
7Rigorous peer review
7Immediate publication on acceptance
7Open access: articles freely available online
7High visibility within the fi eld
7Retaining the copyright to your article