International Journal of Innovative Research in Science, Engineering and Technology
An ISO 3297: 2007 Certified Organization Volume 6, Special Issue 5, March 2017
National Conference on Advanced Computing, Communication and Electrical Systems - (NCACCES'17)
24th - 25th March 2017
Organized by
C. H. Mohammed Koya
KMEA Engineering College, Kerala- 683561, India
Local K-Nearest Neighbors Model using
Z-Order R-Tree for Big Data
Shameema Umer MT1, Sheena Kurian K2
M. Tech, Department of Computer Science and Engineering, KMEA Engineering College, Edathala, Kerala, India1
Associate Professor, Department of Computer Science and Engineering, KMEA Engineering College,
Edathala, Kerala, India2
ABSTRACT: K-nearest neighbors classification and regression is widely used in data mining due to its simplicity and accuracy. When a prediction is required for an unseen data instance, the KNN algorithm will search through the training dataset for the k most similar instances. Finding the value k is application dependent, hence a local value is set which maximizes the accuracy of the problem. Classifying the object to the majority class of its k neighbors is called K-nearest neighbors classification. In this paper the instance or object to be classified is called the problem object or p-object in short. KNN search calculates the pair wise distance between the p-object and each data using distance metric to find the k neighbors. Global KNN approach uses the whole data for searching the k-nearest neighbors of the p-object. For big data local KNN approach is used where sample objects are randomly selected from the training data space. In order to improve the accuracy of finding the exact k-neighbors of local KNN, the training data space is quantized to z-order r-tree. The z-curve helps dimensionality reduction and r-tree helps to select the exact nearest neighbors space in less time. The proposed ZR-KNN algorithm outperforms the state-of-art algorithms for big data.
KEYWORDS:KNN, Nearest neighbors, Big data analytics, Dimensionality reduction, Z-curve, Z-order, R-tree.
I.INTRODUCTION
Supervise learning can be broadly classified into two, parametric and non-parametric model. In parametric model, a model is created using the training data which is used for C/R (classification or regression). The data need not be memorized as the created model reflects the features of the training data. On the other hand, the non-parametric model follows a lazy learning approach where the training data is not pre-computed to create a model, rather the algorithm uses the whole training data set each time for C/R. K-nearest neighbors classification and regression (KNN C/R) algorithm is the simplest and widely used non-parametric model in data mining and pattern recognition. Two variances of KNN are global model and local model. KNN is called a global model when the whole data is used to determine the k-nearest neighbors of the problem object to be classified which is called as p-object in this paper. As data scales, global model becomes complex and inefficient. That is, it requires the storage of the whole training set which would be an excessive amount of storage for large data sets and leads to a large computation time in the classification stage, and usually involves storing the training data in memory and finding relevant data to answer a particular query[2].Also, the most computationally expensive part of many computer vision and machine learning algorithms consists of finding nearest neighbors matches to high dimensional vectors that represent the training data[6]. Therefore, for big data the local model is used where only a random number of the training data is used for the nearest neighbors matching. But this traditional local KNN model lacks accuracy as the selected random space may not include the exact neighbors of
the p-object.
1. Dimensionality reduction is obtained by reducing the features of the training set into a 1D point in the Cartesian coordinate system using z-order curve
2. The selection of the exact neighbors of the p-object is feasible by the implementation of the r-tree model rather than selecting a random subset as training instances in the traditional method.
3. For the good performance of machine learning problems, larger training sets can be used in ZR-KNN as classification complexity is very less.
If the output value to be obtained is a class label, we chose KNN classification. Like the traditional model, the ZR model also uses the majority vote or distance weighted vote of the p-object’s k neighbors for KNN classification. If the output value to be obtained is a continuous value, KNN regression is used. In KNN regression, instead of combining the discrete predictions of k neighbors, the numerical target is measured using similarity measures like simple interpolation, averaging, local linear regression and local weighted regression.
II.RELATED WORK
To enable KNN matching efficient on big data, the researchers of KNN were settled to find the approximate nearest neighbors rather than the exact neighbors. Can Ozan et al. [1] proposed a novel vector quantization method for approximate nearest neighbors (ANN) search which enables faster and more accurate retrieval on publicly available large datasets. They defined vector quantization as a multiple affine subspace learning problem and explored the quantization centroids on multiple affine subspaces. An iterative approach to minimize the quantization error is employed. The computational cost of this method is comparable to that of the competing methods.
Prior to the process of KNN C/R, many of the proposed methods transformed or projected the data into a new subspace, where vector dimensions are reduced, reordered or rotated using PCA [1]. Decorrelating the data using a single PCA step may not bring the desired statistical independency among dimensions, especially if the data do not follow a Gaussian distribution, which is the core inherent assumption of PCA [1]. Feature selection is mandatory in preprocessing phase as it reduces computation overhead.
Dawen et. al. [2] proposed a nearest neighbor approach using correlation analysis under a MapReduce framework on a Hadoop platform, to address the difficult problem of real-time prediction with very large training data. It was implemented by a real-time prediction system (RPS) including offline distributed training (ODT) and online parallel prediction (OPP), based on a parallel k-nearest neighbors optimization (ParKNNO) classifier.
Partitioning trees like the kd-tree [6], [7] is one of the best known nearest neighbors algorithms. While very effective in low dimensionality spaces, its performance quickly decreases for high dimensional data. Trees are often used for nearest neighbors search as the search complexity is logarithmic. Most KNN methods use k-d trees to store k-nearest neighbors and multiple hash tables are used for indexing.
Muja et al. [8] proposed algorithms for approximate nearest neighbor matching to overcome the limitation of finding nearest neighbors matches to high dimensional vectors that represent the training data. For matching high dimensional features the randomized k-d forest and the priority search k-means tree were built and released as open source library called Fast Library for Approximate Nearest Neighbors (FLANN).
Arya et al. [9] proposed a variation of the k-d tree to be used for approximate search by considering (1+Ɛ)-approximate nearest neighbors, points for which dist(i, p-object) ≤ (1+Ɛ)dist(i*, p-object) where i* is the exact nearest neighbor. The authors also proposed the use of a priority queue to boost search speed. This method is also known as “error bound” approximate search.
The KNN method, although simple outperforms more sophisticated and complex methods in terms of generalization error. But the key challenge with this classifier is fixing the appropriate value of k. García et al. [10] presented a simple approach to set a local value of k. A potentially different k to every prototype is associated to obtain the best value of k
by optimizing a criterion consisting of the local and global effects of the different k values in the neighborhood of the prototype.
Binary embedding of feature vectors for faster distance calculations has become a highly popular research topic in recent years and the common approach is to encode the vectors as binary strings and compress very large datasets in much smaller sizes, decreasing the storage cost [11]. Furthermore, the approximation of the distance between two vectors by using pre-calculated distance values gives a significant boost in terms of the search speed. Can Ozan et al. [1] implemented a competitive quantization for approximate nearest neighbors search in [11].
III.THE ZR-KNN
KNN is a novel parametric simple KNN model for big data analytics. Fig 1 depicts the schematic diagram of ZR-KNN which consists of two phases:
Fig. 1 Schematic diagram of ZR-KNN depicting the two phases
The selection of relevant features with the elimination of irrelevant features can improve classification accuracy and reduces the learning period. In ZR-Learning Algorithm, step 1 accomplishes this where the training data set is pre-processed by selecting adequate features, filling missing data, checking for noises and removing erroneous instances as clean data is mandatory for step 2.
Algorithm 1: ZR-Learning() 1. preprocessTrainingData() 2. foreach training instance i
a. ZCurve(i) //reduces d-D i to one-D i
b. updateRtree(i) //inserts i into r-tree
3.
return zr-treeA. Quantizing Features using Z-Order Curve
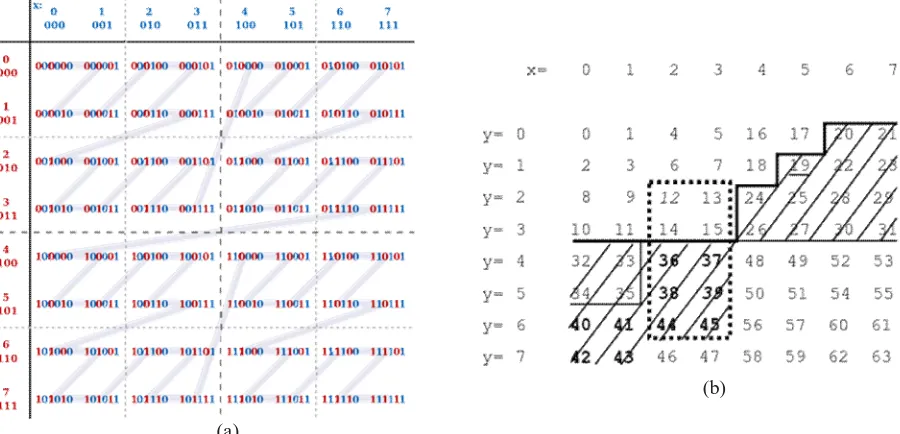
Z-order curve is a mathematical function which maps multidimensional data into a single dimension. It was introduced in 1966 by Guy Macdonald Morton for which it is also called as Morton curve. The z-value of a point in multidimensions is simply calculated by interleaving the binary representations of its coordinate values. Once the data are sorted into this ordering, any one-dimensional data structure such as binary search tree can be used to store the z-values [3].
Fig. 2Z-value calculation by interleaving the binary digits [12]
Dimensionality reduction is obtained by reducing the attributes of the training set into a 1D point in the Cartesian coordinate system using z-order curve. Consider a data set having d attributes each which have to be reduced to d attributes otherwise by removing the unwanted attributes. In order to quantize d-dimensional attributes to 1-dimensional using the ZCurve function, we need to normalize the attribute values to an integer range within a defined boundary which is 7 in fig. 3 [13]. This transformation can be performed using linear transformation. The linear transformation has two justifications [4]. First, linearly scaling and translating spatial points does not change their relative position in high-dimensional space. Neighboring tuples in the original space are also nearby in the new integer space. Second, the linear transformation is a one-to-one mapping operation. Removing of unwanted attributes and normalization are done along with other data cleaning processes using preprocessTrainingData() sub-procedure in step 1 of ZR-Learning algorithm.
ZCurve(): The z-value for the d-dimensional instance i is calculated by interleaving the bits of the features of i; x1, x2,
….xd For example, when d = 2, x1 = 510 (1012) and x2 = 310 (0112) , the z-value of i is 1001112 = 3910. This algorithm can
be intuitively extended for 3D and high-dimensional data instances by interleaving bits from three or more coordinate values.
Training set
ZR-KNN
ZR-Learning
ZR-KNN C/R
(a)
(b)
Fig. 3 (a) Binary representation of Z-order curve (b) Numerical representation of Z-order curve
B. INDEXING Z-VALUES USING R-TREE
To obtain a speed improvement, many practical applications are forced to settle for an approximate search, where not all the neighbors returned are exact, but typically still close to the exact neighbors [6]. Packing the z-values to an R-tree makes ZR-KNN feasible to select the exact k neighbors through r-tree search. Due to the rich features of r-tree to store spatially nearby objects together we chose r-tree in our implementation. Wang et al. proposed a morton r-tree to store spatio-temporal data [3] for the efficient retrieval of spatio-temporal objects.
UpdateRtree(): R-tree was proposed by Antonin Guttman in 1984 and has found significant use in both theoretical and applied contexts. R-trees [5] are a common indexing technique for spatial data and are widely used in spatial and multi-dimensional databases [3, 4]. Typical applications include computer-aided design, geographic information systems, computer vision and robotics, multi-keyed indexing for traditional databases, temporal and scientific databases. R-trees are dynamic structures, in the sense that their contents can be modified without reconstructing the entire tree, and Guttman [5] provides efficient routines for insertion and deletion of objects. To construct a Z-order R-tree, spatial objects are first sorted according to the z-value of their center point [3]. Then we construct the R-tree in a bottom-up manner based on the specified fanout and the out degree of the tree node [3, 4]. The leaf records the training tuples in the form:
(i-zvalue, i-output)
where i-output is the categorical class label or the real output value depending upon C/R and i-zvalue refers to the z-value of the instance. The difference between r-tree[5] and zr-tree[3] is that the former stores the minimum bounding rectangle, MBR of the instances where the latter stores their z-values. Non-leaf nodes contain entries of the form:
(Zc, child -pointer)
where child-pointer is the address of a lower node in the r-tree and Zc is the centroid of the z-values of its children.
Training tuples whose z-values are adjacent will be clustered into the same tree node.
Using the simple R-tree in fig. 4 as an example, the objects i1, i2, and i3 have consecutive Morton values, so do objects
i4 and i6. For simplicity, the prefix i is omitted in this fig. With the specified fanout of 6 and out degree of 3, we cluster
C. THE ZR-KNN CLASSIFICATION AND REGRESSION
Unlike traditional KNN, ZR-KNN is a parametric model which works on the zr-tree created in the ZR-Learning algorithm rather than on the training samples themselves. Retrieving the k-nearest neighbors of the p-object in ZR-KNN consists of two steps:
1. Compute the z-value of p-object
2. Retrieve k + Ɛ neighbors by querying the r-tree which is an Ɛ-optimum k nearest neighbors set calledasƐ-Kset
3. Compute the distance between the p-object and each i
ϵ
Ɛ-Ksetobject to find the exact k neighbors.Step 1 can be accomplished using the sub-procedure Zcurve and step 2 through r-tree search in sub-linear time. The distance computation in traditional KNN models use one of the methods like Euclidean, Minkowski or Manhattan depending upon the characteristics of the feature space. But in ZR-KNN, the distance is merely the absolute value of difference between the z-value of p-object and the z-value ofeachƐ-Ksetneighbors which can be done in very less time,
where Ɛis a small integer.
dist(p-object, i) = | Zp – Zi | (1) NN( p-object, I ) = arg min i ϵƐ-Kset C I dist(i, p-object) (2) where Zp is the z-value of the p-object, Zi is the z-value of the training instance i
ϵ
Ɛ-Kset C Iand I is the complete training set.Algorithm 2: ZR-KNN-CR() Input:
k: The number of nearest neighbors; Te: The testing sample set;
zr-tree: The learned model created in ZR-Learning
Output: Class of each testing sample.
1. foreach testing sample Teas p-object do
a. ZCurve(p-object) //Computes z-value of p-object
b. query zr-tree to retrieveƐ-Kset c. foreach i∈Ɛ-K-set
i. compute the distance between p-object and i using eq. 2
d. retrieve k least distant objects
e. assign class or regression value to p-object depending upon C/R
2. return the labelled Te set
IV. EXPERIMENTALRESULTS
Our algorithm proves best on uniformly distributed data as well as non-uniformly distributed data. The ZR-KNN algorithm is evaluated using both synthetic and actual data from various application domains. Natural datasets were imported from [14, 15] and big data were synthesized using these datasets to evaluate ZR-KNN. ZR-KNN-CR() saves more than 125% in time complexity and the distant calculation metric used in step 1.c.i saves both time and space complexity extremely without compromising the accuracy of C/R. The accuracy of the model is calculated as the ratio of the total correct predictions out of all predictions made. Both the traditional KNN model and ZR-KNN model marked an accuracy of above 92% for categorical output and above 88% for real output on different sizes of training and testing samples.
Table 1 Accuracy and time for ZR-KNN vs KNN for big data TRAINING
SET (SIZE)
TEST
SET
(SIZE)
OUTPUT KNN ZR-KNN
ACCURACY(%) TIME(SEC) ACCURACY(%) TIME(SEC)
6434 3133 REAL 89.54 114.321 88.56 51.072
6403 3164 REAL 90.56 263.312 88.78 65.044
6398 3169 REAL 89.14 218.753 88.90 61.676
6402 3165 REAL 88.79 225.674 88.62 87.126
6408 3159 CATEGORICAL 97.34 252.76 96.56 61.55
V. CONCLUSION
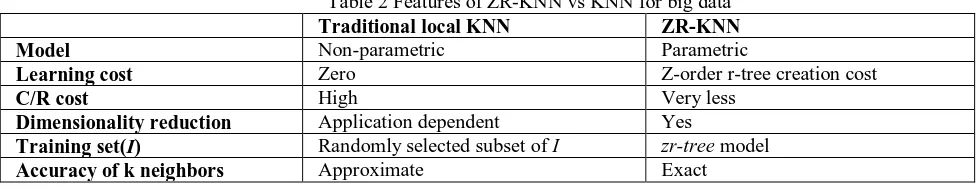
model. Unlike the traditional KNN, here the learning cost is not zero, but the learning phase reduces the dimensions of the training data by mapping the higher dimension feature space into one-dimensional z-value and packed the z-values of the training data into an r-tree. This additional learning cost over the traditional approach reduces the KNN C/R cost for big data. The ZR-KNN out performs the state-of-art algorithms in several orders of magnitude for big data.
Table 2 Features of ZR-KNN vs KNN for big data Traditional local KNN ZR-KNN
Model Non-parametric Parametric
Learning cost Zero Z-order r-tree creation cost
C/R cost High Very less
Dimensionality reduction Application dependent Yes
Training set(I) Randomly selected subset of I zr-tree model Accuracy of k neighbors Approximate Exact
REFERENCES
[1] Ezgi Can Ozan, Serkan Kiranyaz, Moncef Gabbouj, “K-Subspaces Quantization for Approximate Nearest Neighbor Search”, IEEE Transactions on Knowledge and Data Engineering, vol. 28, no. 7, July 2016
[2] Dawen Xia, Huaqing Li, Binfeng Wang, Yantoa Li, Zili Zhang, “A MapReduce-Based Nearest Neighbor Approach for Big-Data-Driven Traffic Flow Prediction”, IEEE Access 10.1109/ACCESS.2016.2570021
[3] Xiaoyu Wang, Xiaofang Zhou and Sanglu Lu, “A Prototype Spatio-temporal Database built on top of Relational Database”, 2015 12th International Conference on Information Technology - New Generations
[4] S. Leutenegger, M. Lopez, and J. Edgington, “STR: A simple and efficient algorithm for R-tree packing,” in Data Engineering, 1997. Proceedings. 13th International Conference on, 1997, pp. 497–506.
[5] A. Guttman, “R-trees: A Dynamic Index Structure for Spatial Searching,” in SIGMOD ’84: Proceedings of the 1984 ACM SIGMOD International Conference on Management of Data. New York, NY, USA: ACM, 1984, pp. 47–57.
[6] J. H. Friedman, J. L. Bentley, and R. A. Finkel, “An Algorithm for finding Best Matches in Logarithmic Expected Time,” ACM Trans. Math. Softw., vol. 3, no. 3, pp. 209–226, 1977.
[7] J. L. Bentley, “Multidimensional Binary Search Trees used for Associative Searching,” Commun. ACM, vol. 18, no. 9, pp. 509–517, 1975. [8] Marius Muja, David G. Lowe, “Scalable Nearest Neighbor Algorithms for High Dimensional Data”, IEEE Transactions on Pattern Analysis
and Machine Intelligence, Vol. 36, No. 11, November 2014.
[9] S. Arya, D. M. Mount, N. S. Netanyahu, R. Silverman, and A. Y. Wu, “An Optimal Algorithm for Approximate Nearest Neighbor Searching in Fixed Dimensions,” J. ACM, vol. 45, no. 6, pp. 891–923, 1998.
[10] Nicolás García-Pedrajas, Juan A. Romero del Castillo, and Gonzalo Cerruela-García, “A Proposal for Local k Values for k-Nearest Neighbor Rule”, IEEE Transactions on Neural Networks and Learning Systems 2016
[11] Ezgi Can Ozan, Serkan Kiranyaz, Moncef Gabbouj, “Competitive Quantization for Approximate Nearest Neighbor Search”, IEEE Transactions on Knowledge and Data Engineering, vol. 28, no. 11, November 2016
[12] C. Alis, J. Boehm, K. Liu, “Parallel Processing of Big Point Clouds using Z-Order-Based Partitioning”, The International Archives of the Photogrammetry, Remote Sensing and Spatial Information Sciences, Volume XLI-B2, 2016 XXIII ISPRS Congress, 12–19 July 2016, Prague, Czech Republic
[13] https://en.wikipedia.org/wiki/Z-order_curve [14] https://archive.ics.uci.edu/ml/datasets/Iris
![Fig. 2 Z-value calculation by interleaving the binary digits [12]](https://thumb-us.123doks.com/thumbv2/123dok_us/1509841.1184911/3.595.113.477.58.185/fig-z-value-calculation-interleaving-binary-digits.webp)