International Journal of Innovative Research in Science, Engineering and Technology
An ISO 3297: 2007 Certified Organization Volume 6, Special Issue 4, March 2017
National Conference on Technological Advancements in Civil and Mechanical Engineering – (NCTACME'17)
17th -18th March 2017
Organized by
C. H. Mohammed Koya
KMEA Engineering College, Kerala- 683561, India
A Case Study of Road Accidents in Kerala
during 2010 to 2016
Arun Chand
Lecturer, Department of Automobile Engineering, Govt. Polytechnic College Kalamassery, Kerala, India
ABSTRACT: This paper attempts to analyse the road accidents from 2010 to 2016 in Kerala state, India and collect
the year wise and district wise data. The study focuses on today’s accident rates and fetches the number of persons died or injured. Even though persons are having awareness of the road accidents, the number is increasing day by day. This text depicts that more persons are died in road accident because of not following road rules and regulations. Also analyses the degrees of accidents on different roads in the state Further, this study reveals that more than 12 persons are killed per 100 accidents in 2016 and this report taken over from the report of 2010 census. By and large, controlling road traffic accidents and switching the safety management of urban and rural road traffic to be digital and its perspective to inculcate this process regards with road safety development in the economy.
KEYWORDS: Road Accidents in Kerala, Traffic Management, Road Safety, Driving Safety.
I. INTRODUCTION
In the present scenario everyone has noticing newspapers, magazines, news in channels and also watching directly and nearly shown that more than half of the people have affected road accidents, died and injured on the road. In the road accident not only having on vehicle riding people but also affect on pedestrians. Actually the pedestrians are more affected on road accidents whenever they compared to vehicle riders. Further, the road traffic crash is a collision or incident involving at least one road vehicle in motion, on a road to which the public has right to access. Follow each and every year over 1 million people are killed and 50 million people are injured on road accidents around the world. Road vehicular accidents have been so frequent and common to everyday life that people tend to disregard that these “high velocity moving lumps of metal” are very lethal and sometimes pose as “weapons of mass destruction.” The problems in road safety transcend in the transport sector and it engaged the problem of health aspects, social impact, economic devaluation and environmental harassment. The health sector would have to stretch its bed capacity in order to administer to the victims while still overseeing other important illnesses. Families are displaced and their futures shattered because of the sudden demise of their breadwinners, which is a social welfare problem. Accidents lay off workers, which eventually, if summed up, will translate to millions of rupees of potential lost productivity thereby affecting domestic production and the economy. It was observed that in Metro Manila, traffic management policies have been implemented without much study, translating to confusion and eventually mishaps. The scale and magnitude of the effects of road accidents on the lives of the people involved and the society in general must be clearly defined for purposes of raising awareness and as an input to the planning and evaluation of the government’s road safety intervention measures. Rapid economic growth is usually connected to a rapid expansion of road transportation. Unfortunately, it also leads to an increase of road crashes, injuries, and fatalities.
Furthermore, six general recommendations were provided:
i. To identify a lead agency in government to guide the national road-safety effort;
ii. To assess the problem, policies, and institutional settings relating to road-traffic Injury and the capacity for road-traffic-injury prevention in each country;
iii. To prepare a national road safety strategy and plan of action; iv. To allocate financial and human resources to address the problem;
v. To implement specific actions to prevent road crashes, minimize injuries and their consequences, and evaluate the impact of these actions; and
vi. To support the development of national capacity and international cooperation.
By and large, there is growing concern worldwide over increasing incidences of road accidents and consequent loss of human life, together with the loss in workforce due to disabilities caused by road accidents and the economic losses that they inflict on society and environment also.
II. STATEMENT OF THE PROBLEM
It could be notable that the roads occupy an eminent position in transportation and carry nearly 65% of freight and 87% of passenger traffic. Traffic on roads is growing at a rate of 7 to 10% per annum while the vehicle population growth, for the past few years, is of the order of 12% per annum. Moreover, the lengths of roads are more prosperity of the nation. The prosperity brigades of a nation normally comprise of intelligentsia, hard labour, infrastructures available and lastly smooth functioning of its roads. However, with the positive qualities, there by-product of transportation is pollution and accidents. In India, the total cost of losses due to road accidents are in the range of Rs. 600- 900 Crores a day. The estimated cost includes compensation, asset loss, time and energy spent on police, hospital and court cases etc. But we cannot measure these sufferings in terms of money. The loss to the nation due to the ever-increasing accidents is untold, eating into the economics of the nation. Without new and effective action, deaths in low to middle-income countries are forecast to rise steeply. By and large, the study enumerates the seeking an environmental rather than an individual solution. It could be viewed as contributing to holistic and developmental approach due to conceptualization and implementation of road safety development programmes in the study area.
Objectives
i. To analyse the total number of road accidents in Kerala during the period from 2010 to 2016 in the study area. ii. To probe into the district wise variation of road accidents in Kerala during 2010 to 2016 in the study area.
Research Design and Methodology
Thus this study design out a decade of road accidents in Kerala among all districts of the state and much more analyse the time period between 2010 and 2016. It spells out the macro level study and using secondary sources of data in the study area. Using this study examined the analytical part of covering table, percentages, Mean, Standard Deviation and Techniques used in Least Square Trend Analysis.
III. RESULTS AND DISCUSSIONS
The study depicts that the problem of road accident is a very acute in highway transportation due to complex flow pattern of vehicular traffic, presence of mixed traffic along with pedestrians. Traffic accident leads to loss of life and property.
Table 1. Total Number of Road Accidents in Kerala during the period from 2010 to 2016
Year Total Accidents Person Died Person
Injured
Accident Severity (No. of person killed per 100 accidents)
2010 42363 3203 51124 8
2011 41647 3589 49881 9
2012 39917 3778 48246 9
2013 37263 3901 43857 11
and large, it depicts the road accidents died has increased in 2016 (12 persons killed in per 100 accidents) as compared to 2010 (8 persons killed in per 100 accidents). Continuously, table 2 explicit the road accidents in Kerala regarding the point of National Highway, State Highway and Other Roads.
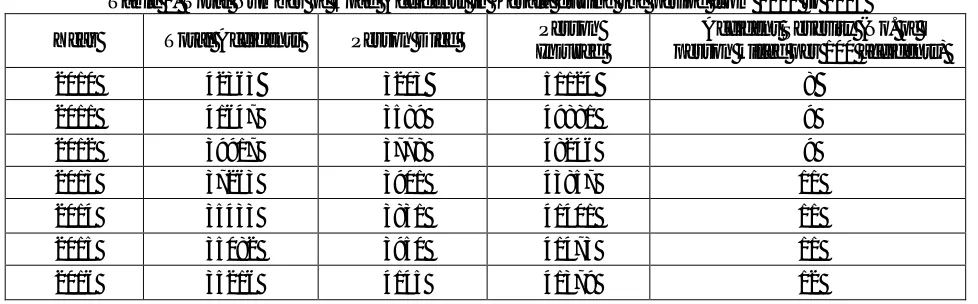
Table 2. Consistency Analysis of Road Accidents in Kerala during the period from 2010 to 2016
Year National
Highway
State
Highway Other Roads Mean SD Co-Variance
2010 11034 5335 25994 14143.67 10660.083 75.37
2011 10664 5215 25768 13882.33 10647.756 76.70
2012 10907 6258 22752 13305.67 8504.599 63.92
2013 9997 6452 20814 12421.00 7481.550 60.23
2014 9425 6637 19371 11811.00 6693.910 56.68
2015 9473 6539 19070 11694.00 6554.092 56.05
2016 9519 6401 19296 11738.67 6727.960 57.31
Mean 10145.57 6119.571 21866.43
SD 709.9399 589.679 3022.285
CV 6.29 9.71 11.27
This table explains most of the road accidents occurring on other roads. Mostly in rural areas the roads are damaged and not recovery of them. Since, the road accidents are maximum occurring in rural and other roads. Further, this table shows that in state highway having more number of road accidents in 2016 as compared to the initial period of 2010. Moreover, this survey gives evidence from the statistical analysis in mean and standard deviation. It also spells out other roads having more road accidents than compared to national highway and state highway.
Table 3
Year Total Road Accidents
(Actual Value)
Total Road Accidents (Approximated Trend Value)
2010 42363 38132
2011 41647 38615
2012 39917 39096
2013 37263 39578
2014 35433 40060
2015 35082 40541
2016 35216 41023
Table 3 contributes the method of least square and using trend values for find out the road accidents in Kerala during the period from 2010 to 2016. By the method of using least square easily to examined the forecasting and predicting value of road accidents and this way get to analyse and give the solution for controlling road accidents in the study area. This model helpful to the researcher by the way of to analyse the forecasting and predictions in total number of road accidents in the study area. The trend value explicit the number of road accident slowly increasing year by year, because it predicts the number of road accident rose from 2010 to 2016 and to forecast the future value as examined. Follow this table explain the chart of least square model by using trend value method.
Table 4. Total Number of Road Accidents in Kerala during 2010 – 2016 as per Year wise and District wise Presentation
YEAR/ DISTRICT 2010 2011 2012 2013 2014 2015 2016
TRIVANDRUM 10.35 10.47 9.17 8.80 8.46 8.15 8.47
KOLLAM 10.35 10.21 9.31 8.09 8.18 8.23 8.59
PATHANAMTHITTA 9.74 10.03 9.33 8.93 8.56 8.28 8.46
ALAPPUZHA 10.18 10.18 10.96 8.18 8.46 8.46 8.39
KOTTAYAM 11.11 9.05 9.32 8.91 7.68 7.65 7.75
ERNAKULAM 10.27 9.64 9.55 8.37 7.60 6.89 7.26
IDUKKI 9.70 9.98 9.36 9.12 8.50 9.00 8.59
THRISUR 9.60 9.50 9.19 8.72 8.46 8.29 8.41
PALAKAD 10.03 10.07 8.88 8.93 8.73 8.88 8.92
MALAPURAM 9.21 8.88 9.16 9.42 9.34 9.82 9.43
KOZHIKODE 9.35 9.26 9.47 9.15 8.15 8.70 7.89
VAYANAD 9.27 9.74 9.49 8.97 9.42 9.16 9.07
KANNUR 9.01 9.43 9.49 9.47 9.28 9.18 9.02
KASARAGOD 9.10 10.19 9.39 9.17 9.01 8.97 8.84
Note: All figures are denoted to Percentages
Table 4 portrait the total number of road accidents in the study area as per district wise presentation and the figure shows the variation of chart among the road accidents in Kerala covering the period from 2010 to 2016. This table depict that most of them accidents were occurred in 2010-2012 and the majority districts are Ernakulam, Palakad, Alappuzha and Kannur. Still recently in 2016 the majority of the road accidents in Kerala, the districts are Malapuram, Wayanadu, Kannur, Palakad. At 2016 compared to 2010 the road accidents ratio are decreased but The Died ratio are rosed in every year. In this context, the present study deals with the proper management on traffic control as well as be managed and controlled the road accidents and get stability of road management.
IV CONCLUSION AND SUGGESTIONS
i. Road management is a main source for economic responsibility. Irresponsible road activities leads to the building of rush situation, accident and loss of economic goods.
ii. This study evaluated the total number of road accidents ratio and accident injured persons were dwindled from 2010 to 2016, but still rosed by died ratio as compared to 2016 from 2010. This depicts the importance of motivating the road management activities and affects to economic development. Further, it leads to lost of human life, contamination of environment and to collapse the service sector also.
iii. Thus this study highlighted the other roads accidents are occurring heavily as compared to national highway and state highway. The other rural areas are having poor roads and these roads are assembled to increase the road accident. Hence, the Government take step to reform these roads and to control the road accidents in rural other roads.
iv. Moreover, the traffic safety management should confirm the directions of the road safety developments in future. Accordingly, the traffic safety management makes the management base on practice concrete policy and measure, and make the traffic safety management perfect further, scientific and rational
REFERENCES
[1] W.H.O. 2015. “Global status report on road safety 2015”. Geneva: World Health Organization.
[2] National Transport Development Policy Committee 2014a.” India Transport Report: Moving India to 2032”. New Delhi, Rutledge. [3] W.H.O 2004.”World report on road traffic injury prevention 2004” ”. Geneva: World Health Organization.
[4] Transport Research Wing 2015. “Road Accidents In India 2014”. New Delhi: Ministry of Road Transport and Highways.
[5] Singh, D., Singh, S. P., Kumaran, M. & Goel, S. 2015. “Epidemiology of road traffic accident deaths in children in Chandigarh zone of North West India”. Egyptian Journal of Forensic Sciences.
[6] Bishai, D., A. Quresh, P. James and A. Ghaffar. (2006). “National road casualtiesand economic development”.Health Economics. 15:65-81 [7] Kerala Police Force Department and Motor Vehicles Department. – Different case files from 2010 to 2016
[8] Vigneshkumar, C. Fatal Road Accident Characteristics in Metro-Plus Cities of India.
[9] Singh, S. K., & Misra, A. (2004). Road accident analysis: A case study of Patna City. Urban Transport Journal, 2(2), 60-75.