Magnetic and electric deflector spectrometers for ion emission
analysis from laser generated plasma
Lorenzo Torrisi1,*, Giuseppe Costa1, Giovanni Ceccio1, Antonino Cannavò1, Nancy Restuccia1, Mariapompea Cutroneo2 1Dipartimento di Scienze Fisiche, MIFT, V.le F.S. d'Alcontres 31, 98166 S. Agata, Messina, Italy
2Nuclear Physics, Institute, CAS 25086, Rez, Czech Republic
Abstract. The pulsed laser-generated plasma in vacuum and at low and high intensities can be characterized using different physical diagnostics. The charge particles emission can be characterized using magnetic, electric and magnet-electrical spectrometers. Such on-line techniques are often based on time-of-flight (TOF) measurements. A 90° electric deflection system is employed as ion energy analyzer (IEA) acting as a filter of the mass-to-charge ratio of emitted ions towards a secondary electron multiplier. It determines the ion energy and charge state distributions. The measure of the ion and electron currents as a function of the mass-to-charge ratio can be also determined by a magnetic deflector spectrometer, using a magnetic field of the order of 0.35 T, orthogonal to the ion incident direction, and an array of little ion collectors (IC) at different angles. A Thomson parabola spectrometer, employing gaf-chromix as detector, permits to be employed for ion mass, energy and charge state recognition. Mass quadrupole spectrometry, based on radiofrequency electric field oscillations, can be employed to characterize the plasma ion emission. Measurements performed on plasma produced by different lasers, irradiation conditions and targets are presented and discussed. Complementary measurements, based on mass and optical spectroscopy, semiconductor detectors, fast CCD camera and Langmuir probes are also employed for the full plasma characterization. Simulation programs, such as SRIM, SREM, and COMSOL are employed for the charge particle recognition.
1 Introduction
The class of charge particle spectrometers based on electrical or magnetic deflections and both on electrical and magnetic deflection systems is large. It contains devices to select the mass-to-charge ratio, to the ion or electron recognition, to evaluate the particle velocity, energy, charge state and directionality.
When the deflection is controlled by an electrical field generated between two electrodes placed transversally to the path of the particles, the technique is called electrostatic deflection because the strength and direction of the applied field changes slowly with respect to the time it takes for the particles to cross the field. Thus the deflection introduces a change in the charge particle velocity directed transversally to the incident direction, which component velocity vT depends on the following parameters:
m
ezV
v
T=
2
(1)
where e is the electron charge, z is the charge state, V is the applied static potential and m is the particle mass. Inside the electric field the trajectory of the particle is parabolic and, if d is the distance between the two electrodes and L the length of the electric field, the particle deviation is calculable from the relation [1, 2]:
L
mv
d
V
ez
tg
20
)
/
(
=
a
(2)
where α is the angle that the velocity vector crossing the electric field forms with the incident direction and v0
represents the velocity of the particle incoming orthogonally to the electric field direction. It is possible to observe that the deviation depends on the charge-to-mass ratio and on the initial particle velocity.
When the deflection is controlled by a constant magnetic field B placed orthogonally to the incident particle direction, the Lorenz force acts and a rotation on the particle is induced according to the Larmor radius:
B
v
ez
m
r
=
0(3)
Also from this relation it is possible to observe that the particle trajectory depends on the mass-to charge ratio and initial velocity of the particle.
The non perfect orthogonality of the incident particle with respect to the magnetic field direction will produce a helicoidally trajectory which radius depends on the component orthogonal and the pitch on the component parallel.
velocities, as occurs in the Thomson parabola spectrometer [3, 4]. In this case, assuming the particles moving along the z direction toward a magnetic (input) and electric (output) fields, both parallel to x direction and orthogonal to the particle incoming direction z, the magnetic field will produce a deflection on the plane z-y and the electric field a deflection on the plane z-x. The particle projection on a final shield, orthogonal to the incident direction, where are placed the detectors, will show an electrostatic deflection X given by:
e
ezV
k
X
=
(4)
where E
E E d L D L k 2 2 ÷ø×
ö ç è
æ +
=
, LE represents the length of the
electric field plates, V the applied voltage, D the final shield distance from the electric plates, and ε is the kinetic energy of the incident particle. The Y magnetic deflection, instead depends on the relation:
e
m
ezB
k
Y
=
'
(5)
where ' (2 ) 2
B E
B l L L L L
k = + + + ×
, LB represents the length
of the magnetic field plates, l the distance between the magnet and the electric plates.
Thus both deflections will produce a parabolic trajectory according to the final relation:
2 2 2
'
ezB
Y
k
kmV
X
=
×
(6)
Many spectrometers are based on such relations but often their plates are not parallel and the electric and magnetic fields can vary up to MHz in order to obtain compact instrument and high sensitivity. One example is represented by the mass quadrupole spectrometer, which uses a quadrupole consisting in four cylindrical rods, set parallel to each other [5]. Ions are separated in base on the stability of their trajectories in the radio-frequency oscillating electric fields that are applied to the rods. For the different species of charge particle spectrometers it is possible to use different kind of detectors, of which the most diffused are based on Faraday cups and secondary electron multipliers.
In this paper will be presented four kind of spectrometers employed mainly for analysis of the particles emitted from high-intensity lasers generating plasma in high vacuum.
2
Experimental section
Generally the presented spectrometers are employed to analyze the plasma produced by pulsed laser irradiating solid target in high vacuum. To this are employed a Nd.YAG laser operating at 1064 nm wavelength, 3 ns pulse and an intensity up to 1011 W/cm2 at Messina
University and a Iodine laser operating at 1315 nm
wavelength, 300 ps and an intensity up to 1016 W/cm2
operating at PALS in Prague (Czech Republic).
The first ion mass spectrometer used in diagnostics of laser-generated plasma is known as ion energy analyzer (IEA). It consists in an electrostatic deflector of ions at 90° with respect to the incident direction based on two curved metallic plates from which is applied an high electric field. The system acts such as a filter permitting the deflection at 90°, towards the detector, only of the ions having the same energy-to-charge ratio (E/z), according to the equation [6]:
KeV
z
E
=
(7)
being V the voltage applied to the two electrodes and K a factor depending on the geometry of the spectrometer. Often the system is realized using an electric field of the order of 1-10 kV/cm, and maintain the k parameter to a value of 10. Thus, for example, if is E/z=10 keV it means that the system are using an applied voltage of 1 kV and that the electrostatic filter can deflect 10 keV ions with a single charged, 20 keV with a double charged, 30 keV with a triple charged and so on. Limitations are due to the use of the high voltage applied to the electrode in high vacuum. Up to 30 kV have been applied without discharge problems.
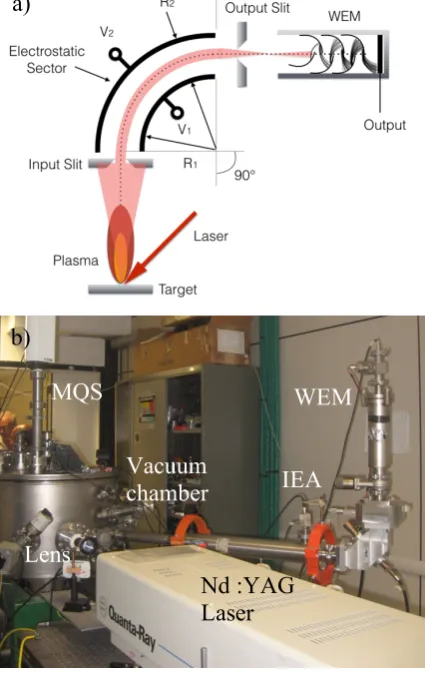
Fig. 1. Scheme of the IEA spectrometer (a) and photo of the
experimental set up (b).
Fig. 1a shows a typical scheme of IEA spectrometer. In order to increase the sensitivity of the instrument
generally as detector is employed an electron multiplier and the first dynode is opened to vacuum in order to be hit by the ions. The input collimation need to determine very well the incident direction of the detected particles to be deflected. Fig. 1b shows a photo of the detector at the laboratory of plasma laser in Messina University. The system resolves the different mass-to charge using a time-of-flight (TOF) technique separating in time the faster ions from the slower ones from the time of arrival to the detector. Changing the bias voltage V it is possible to change the E/z ratio and to have information about the ion energy distributions. For example Boltzmann ion distributions emitted from hot plasma were detected according to previous papers [7, 8].
Fig. 2. Experimental set-up of the magnetic spectrometer (a) and
simulations of the Bolzmann distributed Al ions (0.4 keV mean energy per charge state) deflected by 0.3 T vs. their charge state (b).
An example of magnetic deflector is represented by the system used in our laboratory to separate the different mass-to-charge ratio using the horizontal ion deflection produced by a magnetic field of the order of 0.3 T with a length of 1 cm orthogonal to the input direction of ions accelerated from the laser generated plasma. A photo of the experimental apparatus using 32 different ion collectors (IC) placed at 2.9° for each other for a total angular distribution of 90° is reported in Fig. 2a. A COMSOL Multiphysics code simulation [9] data relative
to the first four charge states of the Al ions angular separation accelerated from laser-generated plasma (0.4 keV mean energy per charge state) is reported in Fig. 2b. Limitations are due to the maximum magnetic field applicable using a permanent magnet up to 0.3 T permitting a deflection of protons of 6.3° at 10 keV energy and of 1.7° at 100 keV, thus not usable for protons at energy higher than about 100 keV for the lower angular deflection.
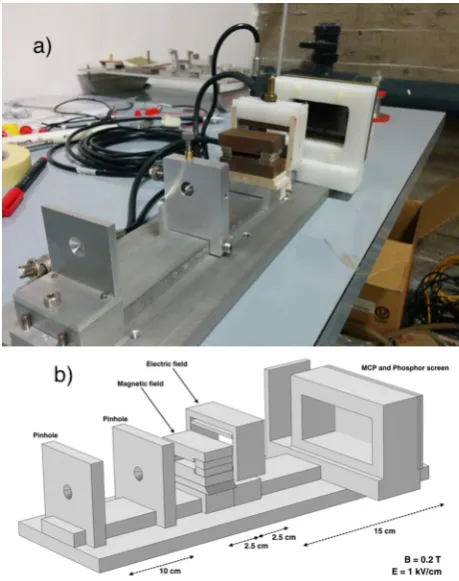
A Thomson parabola spectrometer (TPS) used for low energetic ions, of the order of 100 keV per charge state is employed in our laboratory. In this case the ions are produced by laser-generated plasma, two pin-holes are employed to fix the incident direction of the ions, a permanent magnetic field B of 0.2 T is employed with a space of 1 cm (vertical) x 2.5 cm (horizontal) input cross-section and 2.5 cm length, followed, by an electric field E which applied voltage is adjustable up to 10 kV having and aperture cross section of 3 cm (horizontal) x 2.5 cm (vertical) and 2.5 cm length. A photo of the TPS is reported in Fig. 3a while Fig. 3b reports a scheme of the real parabola system realized at Messina University. The presented model can be employed both using a gaf-chromix film, or a micro-channel plates (MCP) coupled to a phosphorus screen and to a fast CCD camera, as detector.
Fig. 3. Photo (a) and scheme (b) of the little TPS employed for
the ion recognition using post ion acceleration system.
Finally we should also mention our mass quarupole spectrometer (MQS), a Prisma-Pfeifer from Mod.100-300, permitting the atom mass recognition from 1 up to 300 amu using an electron multiplier (SEM) as detector with a sensitivity lower than 1 ppm (part per million), as presented in our previous papers [11].
Faraday cup, ion collectors with electron suppression grid, fast storage oscilloscope, semiconductor detectors, plastic scintillators, electron multipliers, MCP, gaf-chromix and track detectors are employed for the particle detection.
Our measurements are facilitates using simulation programs permitting the comparison between the experimental data and the simulation ones. To this, programs such as SRIM, SREM, and COMSOL are employed [12]. NIST data base are also used for X-rays absorption, electron and ion stopping powers, and for natural isotope abundances [13].
3
Results
Fig. 4a reports a typical TOF spectrum of Ta ions detected using the IEA spectrometer. Ions are generated by the Nd:YAG laser interacting with a solid Ta target and detected using an electron multiplier which output signal is acquired by a fast storage oscilloscope permitting TOF measurement from the start laser shot to the stop ion detection.
Fig. 4. Typical IEA spectrum recording Ti ions by plasma in TOF regime (a) and plot of the ion energy distribution obtained by varying the E/z IEA filter (b).
The flight distance from the target up to the first dynode where ions are impacted is 1.8 m, thus the single charged Ta ions detected at a TOF time of 68 µs has a mean kinetic energy of about 660 keV. By varying the E/z ratio through the voltage applied to the curved plates it is possible to measure the yield of ions at different kinetic energies filtered through IEA spectrometer. The plot of such result permits to evince that the ion energy follows the Coulomb-Boltzmann shifted (CBS) energy distribution [14], as reported in the fit of experimental point reported in Fig. 4b. Ions are shifted toward higher energy increasing their charge state. From the Boltzmann curve widths and from the regular shift of the distributions with the charge state it is possible to evaluate a plasma temperature of 220 eV and a mean plasma acceleration voltage of 456 V, respectively.
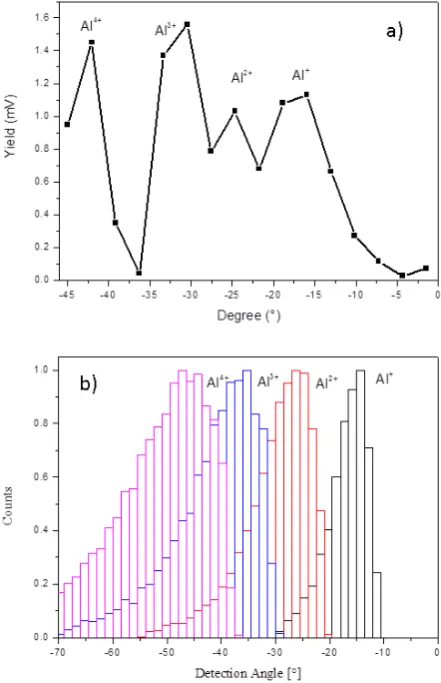
Fig. 5. Typical plot of the experimental angular distribution vs.
charge state of the Al ions laser-generated analyzed with the magnetic defector (a) and COMSOL simulation of the expected ion angular distribution (b).
Fig. 5a reports a typical spectrum obtained analyzing with a magnetic deflection the Al charge states and neutrals coming from a laser-generated plasma at 1010 W/cm2
which are 15°, 25°, 35° and 45°, respectively, confirming the obtained experimental results.
Fig. 6. Typical spectrum of ions recorded in gaf-chromix with
the little TPS of our laboratory during post-acceleration using 30 kV (a) and comparison with the COMSOL simulation for the ion recognition (b).
Measurements of ions emitted from laser-generated plasma were performed using both our TPS instrument reported in Fig. 3 and the TPS of PALS Laboratory facility in Prague. In the first case a suitable gaf-chromix sheet is employed to detect ions, while in the second case a MCP with coupled red phosphorus plate was used as on line monitor. Fig. 6a reports the measurements of the ions obtained by irradiating a Ti target at 1010 W/cm2 laser
intensity, using a post ion acceleration of 30 kV (it means that ions are accelerated at 30 keV per charge state) and a gaf-chromix shield for the ion detection. The measurements indicate that plasma permits to obtain the ionization of Ti up to four charge states and that the Ti target contains also oxygen, which is detected with a maximum ionization up to four, and hydrogen contamination. Fig. 6b shows the simulated ion parabolas obtained using COMSOL code, reporting as electric deflection vs. magnetic deflection of the different ion charge states, that are in agreement with the ions detected using the gaf-chromix detector. The maximum Ti charge state is four; this indicates that the plasma electron temperature ranges between the fourth and fifth ionization potentials of Ti which are of 43 eV and 99 eV, respectively. Ions are extracted by the ablation chamber and submitted to a post acceleration of 30 kV, as reported in a previous paper [15], thus a multi energetic ion beams is generated where, for example, protons are accelerated monochromatically at 30 keV and Ti at the energies of 30
keV, 60 keV, 90 keV and 120 keV, proportionally to their charge state, respectively.
The PALS-TPS uses a magnetic field of 0.1 T, an electric field of 2.0 kV/cm and has the following parameters: LB
= LE= 8 cm, l=0, D=16.5cm, which geometry is reported
in literature. Using such parameters the COMSOL simulation permits the recognitions of the ions accelerated from laser-generated plasma. One example of such application is obtained for a thin target of CD2 irradiated
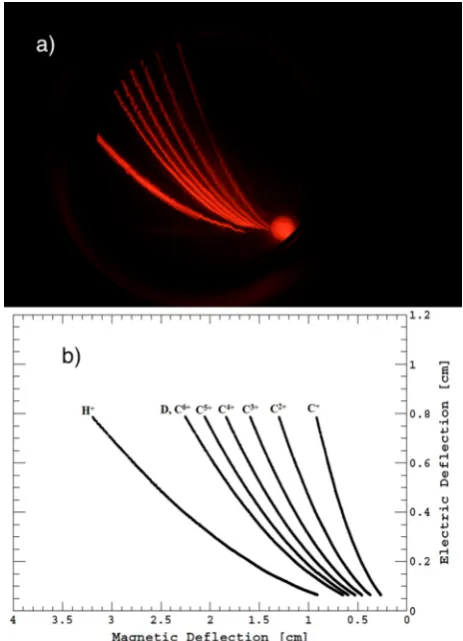
at 500 J pulse energy, with a focal distance of -160 µm (in front of the target), and recording the ion emitted in forward direction in TNSA conditions. A typical spectrum for this experiment is reported in Fig. 7a, as photo of the CCD camera coupled to the MCP detector, while Fig. 7b reports the simulations of the ion recognition using COMSOL for the electric vs. magnetic deflections on the base of the TPS geometry.
Fig. 7. Typical spectrum of ions recorded in MCP/Phosphorus
screen with the TPS of PALS facility irradiating a CD2 target (a)
and comparison with the COMSOL simulation for the ion recognition (b).
The maximum acceleration is of about 3.0 MeV per charge state, as measurable from the nearest parabola points to the zero circle generated by the X-rays on the image. Thus protons have a maximum kinetic energy of 3.0 MeV with a Boltzmann distribution, carbon ions have a maximum energy of 18 MeV relative to the C6+. The
parabolas due to C6+ and D+ ions are indistinguishable due
ionization potential of C6+, which is of 490 eV, and the
plasma density more than three orders of magnitude higher just after the laser pulse. Further details on the production of CD2 plasma at PALS, its characterization
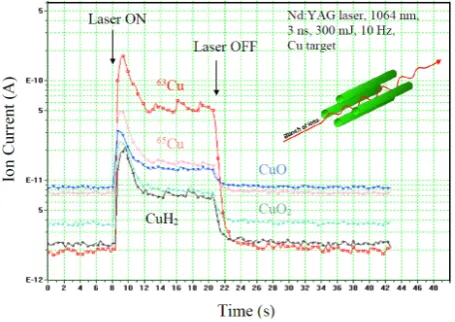
and application, are presented in our previous article [16]. Further techniques of ion deflection can be employed for plasma characterization and other applications, using electric and/or magnetic deflections static and/or dynamic. One of these is represented by the MQS which is based on the ion mass-to-charge ratio (m/z) selection on the base of the ion trajectory stability under radiofrequency oscillating electric fields applied to the rods. Such spectrometer can be used to analyze the neutral atoms present in plasma, to measure the m/z ratio, to detect particular isotopes, to evaluate the ion yield emitted during the laser irradiation of a solid target, to measure the ion energy distributions and to other scopes. Fig. 8 shows a typical MQS spectrum relative to the analysis of Cu species emitted in vacuum during the laser irradiation of a Cu target. The spectrum is acquiring fixing specific masses of interest and reporting their yield versus time. At the laser ON the laser hit the target, at the laser OFF the laser is switched off. The spectrum shows the two Cu stable isotopes and some Cu compounds produced in the laser generated plasma at a laser intensity of about 1010
W/cm2.
Fig. 8. Typical MQS spectrum obtained fixing the masses of
interest vs. the time for a Cu target laser ablated.
Complementary measurements, based on mass and optical spectroscopy, semiconductor detectors, fast CCD camera and Langmuir probes are also employed for the full plasma characterization.
4 Discussion and Conclusions
It has been demonstrated that the laser-generated plasma characterization can be performed using suitable electrical and/or magnetical spectrometry both using static and/or dynamical fields.
In particular the fast and hot plasma emitting ions from keV up to hundred MeV can be analyzed using TPS spectrometer giving information on the mass-to-charge ratio an on the ion energy distribution. TPS can be employed both at low and high laser intensities, from about 1010 W/cm2 up to 1016 W/cm2 and higher. It is fast
and generates images of the ions as a dependence of their m/z ratio. The on-line spectrometer uses MCP coupled to phosphorus screen and CCD camera, as that used at PALS facility.
IEA spectroscopy can be employed for ions up to energies of the order of 100 keV because it is limited by the high electric fields necessary for their 90° deflection in high vacuum. Thus IEA is useful to study mainly ion emission form thick target irradiated at relatively low laser intensities and it is often coupled to TOF analyses for the ion recognition.
Magnetic deflection permits not only the ion focalization using the axial geometry and the ion acceleration due to the generation of electron traps in front of the target, as reported in a recent our article [17], but also the ion selection in transversal application mode. The limitations for the magnetic field analysis are due to the application of high magnetic fields in the case of high energetic ions of the order of 100 keV or more.
MQS spectrometer is adapts to analyze the neutral component emitted from laser ablation and plasma emission and permits the recognition of the isotopes ad of the chemical species generated in the plasma. For low plasma temperature it permits the evaluation of the fractional ionization of the plasma and measurements of the ion energy distributions [18].
Of course the plasma characterization not only uses the electro-magnetic deflection of ion but also many other complementary analysis to be investigated in detail. Optical spectroscopy, streak camera imaging, X-ray detectors, Langmuir probes, semiconductor detectors and electron detectors, for example, represent a lot of instrumentation necessary to have information on the plasma nature, temperature and density dynamics, expansion and charge separation effects, plasma frequency, and other parameters characterizing its expansion and angular distribution.
This work was supported by the “Research and Mobility” project of Messina University No. 74893496, scientifically coordinated by Professor L. Torrisi and by CANAM in Rez (Czech Republic) Project No. CZ.02.1.01/0.0/16_013/0001812.
References
1. M. Colucci, Elettronica Generale, Cedam Ed., Padova (1975).
2. LD Didactic GmbH, Investigating the deflection of electrons in electrical and magnetic fields. Actual
website (2017):
https://www.ld-didactic.de/literatur/hb/e/p3/p3851_e.pdf
3. L. Torrisi, M. Cutroneo, L. Andò, and J. Ullschmied, Phys. Plasmas 20, 023106 (2013)
4. M. Cutroneo, L. Torrisi, S. Cavallaro, L. Ando' and A. Velyhan, Journal of Physics: Conference Series 508, 012020 (2014).
5. P.H. Dawson, Quadrupole mass spectrometry and its applications, Elsevier, New York (1976).
7. L. Laska, J. Badziak, F.P. Boody, S. Gammino, K. Jungwirth, J. Krasa, M. Pfeifer, K. Rohlena, J. Ullschmied, P. Parys, J. Wołowski, E. Woryna, and L. Torrisi, Brazilian Journal of Physics 34(4B), 1615-1620 (2004).
8. L. Torrisi, S. Gammino, L. Andò and L. Laska, J. Appl. Phys. 91(5), 4685-4692 (2002).
9. COMSOL Multiphysics code, actual website 2017:
https://www.comsol.com/blogs/computational-electromagnetics-modeling-which-module-to-use/
10. L. Torrisi, Physics of Plasma 24, 023111 (2017). 11. L. Torrisi, A. Italiano and A. Torrisi, Appl. Surf. Sci.
387, 529–538 (2016).
12. J. Ziegler, SRIM, The stopping and range of ions in matter, actual website 2017: http://www.srim.org/
13. NIST, Stopping-Power & Range Tables for Electrons, Protons, and Helium Ions, actual website 2017: https://www.nist.gov/pml/stopping-power-range-tables-electrons-protons-and-helium-ions
14. L. Torrisi, Rad. Eff. and defects in Solids 171(1-2), 34-44 (2016).
15. L. Torrisi, L. Giuffrida, M. Rosinski and C. Schallhorn, Nucl. Instr. and Methods in Phys. Res. A
268, 2808-2814 (2010).
16. L. Torrisi, S. Cavallaro, M. Cutroneo, L. Giuffrida, J. Krasa, D. Margarone, A. Velyhan, J. Kravarik, J. Ullschmied, J. Wolowski, A. Szydlowski and M. Rosinski, Review of Scientific Instruments 83, 02B11, 1-3 (2012).
17. L. Torrisi and G. Costa, Laser and particle Beams
35(2), 202-209 (2017).