© 2016, IJCSMC All Rights Reserved
76
Available Online atwww.ijcsmc.comInternational Journal of Computer Science and Mobile Computing
A Monthly Journal of Computer Science and Information Technology
ISSN 2320–088X
IJCSMC, Vol. 5, Issue. 2, February 2016, pg.76 – 88
Potato Leaf Diseases Detection
and Classification System
Mr. Girish Athanikar
1,
Ms. Priti Badar
2¹M.Tech Student Department of Information Science and Engineering, New Horizon College of Engineering, Bangalore, India ²Senior Assistant Professor, Department of Information Science and Engineering, New Horizon College of Engineering, Bangalore, India
1
[email protected]; [email protected]
Abstract— This report describes a neural network based detection and classification of Potato leaf samples using
Segmentation of K-Means Clustering. Algorithms are developed to acquire and process colour images of single leaf samples.
Different leaves like healthy and diseased are considered for the study. The developed algorithms are used to extract over 24
(colour, texture and area) features. The texture features are extracted from the gray level co-occurrence matrix (GLCM). A
back Propagation Neural Network (BPNN)-based classifier is used to identify and classify the unknown leaf that is the leaf
is healthy or diseased, if leaf is diseased one then classify the disease by giving description (name, cause, pesticides). The
colour, texture and area features are presented to the neural network for training purposes. The trained network is then used
to identify and classify the unknown leaf samples. The classification is carried out using different types of features sets, viz.,
colour, texture and area. Classification accuracies of over 92% are obtained for all the leaves samples (healthy and diseased)
using all the three feature sets.
Keywords – Pre-processing, Segmentation, Feature Extraction, Leaves samples and Neural Network.
I. INTRODUCTION
India is an agricultural country where in about 70% of the population depends on agriculture. Farmers have wide range
of diversity to select suitable Fruit and Vegetable crops. However, the cultivation of these crops for optimum yield and quality
produce is highly technical. It can be improved by the aid of technological support. Plant disease diagnosis is an art as well as
© 2016, IJCSMC All Rights Reserved
77
and image analysis technology based on the advances in microelectronics and computers has many applications in biology and
it circumvents the problems that are associated with traditional photography. This new tool helps to improve the images from
microscopic to telescopic range and also offers a scope for their analysis. It, therefore, has many applications in biology [1]. So
there is a necessity in detecting diseases in such kind of plants leaves as well as fruits. Automatic identification and
classification of diseases based on their particular symptoms are very useful to farmers and also agriculture scientists. Early
detection of diseases is a major challenge in horticulture/agriculture science [1, 3]. Plant diseases are important factors because
its affects human being as well as animals etc. that’s why as it can cause significant reduction in both quality and quantity of
crops in agriculture production [3]. Therefore, detection and classification of diseases is an important and urgent task.
Traditionally farmers identify the diseases by naked eye observation method. Some researchers have used image processing
techniques for fast and accurate detection of plant diseases and identifying the diseases in an early stage only and control them.
The steps followed by these researchers in detection of leaf spot diseases are: image acquisition, image pre-processing, disease
spot segmentation, feature extraction and disease classification. The accuracy of result depends on method used for disease spot
detection. The main obstacle in disease spot detection is noise, which is introduced by camera flash, change in illumination,
noisy background and presence of vein in the plant leaf. Therefore a method which wipes out the noise and provides better
disease spot segmentation is needed. Among several factors responsible for the low potato production, potato diseases like early
and late blights, insect damage, and roll viral diseases, Image segmentation is the first step in image analysis and pattern
recognition, it is a critical and essential component in image analysis and pattern recognition system, it is one of the most
difficult task in image processing and determines the final result of analysis, image segmentation is the process of partitioning
an image into disjoint regions using K-mean clustering technique. The K-Means clustering technique is a well-known approach
that has been applied to solve image segmentation tasks [2, 3, and 4].
II. PROBLEMSTATEMENT
Farmers Identification of leaf diseases it is the important and one of the major problem in early stages. Disease is caused by
pathogen which is any agent causing disease. In most of the cases pests or diseases are seen on the leaves or stems of the plant.
Therefore identification of plants, leaves, symptoms and finding out the pest or diseases, percentage of the pest or disease
incidence, symptoms of the pest or disease attack, plays a key role in successful cultivation of crops. What is wrong with my
plant; followed by, what can I do to get rid of the problem? It may be too late to help the specific plant when the question is
asked, but proper diagnosis may be extremely important in preventing the problem on other plants or in preventing the problem
in the future. Control measures depend on proper identification of diseases and of the causal agents. Therefore, diagnosis is one
of the most important aspects of a plant pathologist's training. Without proper identification of the disease and the
disease-causing agent, disease control measures can be a waste of time and money and can lead to further plant losses. consider various
environmental and cultural factors. Be able to identify a disease and disease-causing agent, Be able to narrow the problem down
to several possibilities which will require further study in the laboratory before he can make a final diagnosis, or Identify
characteristic symptoms. Describing the characteristic symptoms exhibited by a specimen can be very difficult to do accurately.
Because of this, it is often difficult, if not impossible, to determine what is wrong with a plant when a person is describing
symptoms over the phone. As a test of this you may want to take a plant exhibiting symptoms and have three different
individuals describe the symptoms that they observe on a sheet of paper.
© 2016, IJCSMC All Rights Reserved
78
III. PROPOSED METHODOLOGY
As diseases are inevitable in plants, early detection and diagnosis of diseases is a crucial aspect in the field of
agriculture. This can be achieved using an automated image processing system in which the following steps have to be
undertaken. The methodological analysis of the work has been presented. The leaf type detection and classification of more
number of samples is attempted here colour, texture and area features and result of such system is applicable to automation of
detection and classifying diseases on leaf in agriculture field. The work involves processing of images of different types of
leaves (Healthy and Diseased) as shown below.
Figure 3.1: Non-interactive proposed systems and Interactive proposed system
The work takes the input as a colour leaf image after accepting the image work do the pre-processing over the leaf
image by resizing the size of the image and filtering the image using Gaussian filter technique. In the segmentation the K-mean
clustering algorithm is used to extract the leaf part such as if leaf is healthy it extract whole image and for infected leaf image it
extract the infected part from leaf image. After extracting the part of the leaf in the image it will send to the feature extraction
step to extract the features (colour, texture and area). The extracted features are stored at a set in a knowledge base for future
retrieval.
The neural network architecture that is most commonly used with the back propagation algorithm is the multilayered
feed forward network. There are four steps in the training process:
I. Assemble the training data.
II. Create the network.
III. Train the network.
IV. Test and validate network response to new inputs.
Training, testing and validation of neural networks are performed using leaf sample images. The color, texture and area
feature sets are combined to perform a combined features set that consist of 24 input features. A three layer BPNN used to
develop a classifier. In detect and classify step the result will be displayed by analysing the feature set. The result is classified as
© 2016, IJCSMC All Rights Reserved
79
3.1 Image Acquisition & Pre-processingIn previous chapter, we have discussed the problems faced by farmers in agriculture field in detecting and classifying
of different types of potato leaf diseases and also discussed proposed methodology of work. In this step we are discussing the
materials and methods used in the work of detecting and classifying the potato leaf types.
3.2 Imaging System
The images were acquired with digital camera (Sony Corporation made in China, Model No: DSC-W690). The images
were stored in a personal computer (Intel Dual-Core processor). Camera was mounted over the simple stand which provided
easy vertical movement to finely tune the position of the camera with respect to leaf images were captured and saved in jpg
format. We were taken healthy and infected leaf images in natural sunlight and also maintained same distance. The camera has a
zoom lens with high quality.
3.3 Leaf Sample Imaging
Here we were consider, the healthy and infected Potato leaf images in this study. Each image in the first and second
sets consisted single type of leaf image. Some features (RGB Colour Features, Texture features, Shape Features) were extracted
from the first set of images and used to train a classifier. The second set of images is used to test the segmentation algorithm and
trained classifier.
3.3.1 Image Samples
Shows an image of the leaf samples. Different types of leaf images (Healthy and Infected) are consider for the study.
Healthy Early Early Blight disease Roll Viral Disease Insect Damage Figure 3.2: Images of leaf samples
3.4 Pre-processing Methodology
The quality of image is decisive for the results analysis, affecting both the ability to detect features. It can also be
defined as a technique in which the data from an image are digitized and various mathematical operations are applied to the
data, generally with a digital computer. This is done in order to create an enhanced image that is more useful or pleasing to a
human observer, or to perform some of the interpretation and recognition tasks usually performed by humans. Pre-processing
uses the techniques such as image resize, filtering, segmentation etc.
3.4.1 Resize
Initially, the captured images are resized to a fixed resolution so as to reduce the computational burden in the later
processing. It is also done to improve the storage efficiency.
3.4.2 Filtering
Image Filtering is a software routine that changes the appearance of an image or part of an image by altering the shades
and colons of the pixels in some manner. Filters are used to increase brightness and contrast as well as to add a wide variety of
© 2016, IJCSMC All Rights Reserved
80
extraction of disease spots. Hence they must be removed or weakened before any further image analysis. Filters like Gaussian,
median, Linear, Low pass, High pass, Laplacian filters etc can be used to remove the noise.
IV. FEATURE EXTRACTION METHODS
In pattern recognition and image processing, feature extraction is a special form of dimensionality reduction. When the
input data to an algorithm is too large to be processed and it is suspected to be notoriously redundant (much data, but not much
information) then the input data will be transformed into a reduced representation set of features (also named features vector).
Transforming the input data into the set of features is called feature extraction. If the features extracted are carefully chosen, it is
expected that the features set will perform the desired task using the reduced representation instead of the full size input.For an image, a feature can be defined as the “interest” part of the image. These features play a fundamental role in classification. In
image processing, image features usually include colour, shape and texture features [12]. The features are necessary for
differentiating one class of objects from another. The method must be used for describing the objects so that features of interest
are highlighted. The description is concerned with extracting of features from an image. In the present work, after the analysis,
shape features did not give any differentiation between the diseased and healthy leaf samples. Hence Texture, Area and Colour
features are extracted to get accuracy in disease identification.
4.1 Colour Features
Colour moment is a simple and effective colour feature and its math foundation lies that any colour distribution can
indicate with its moment. In addition, since colour distribution information is mainly concentrated in low order moment, only
the first moment, secondary moment and third moment of colour are enough to indicate image colour distribution. Compared
with colour histogram, this method needs not vectoring features. HSI colour model with three components independent and less
illumination influence is still used to take H, S and I components respectively to get three low moments of each component. The
values of RGB colour components are in the range [0, 1] and Hue (H), Saturation (S) and Intensity (I) components are extracted
from these RGB components. The extraction of RGB features is as follows: First step in the extraction of RGB feature is
separation of RGB components from original colour image sample (figure 4.1).
Figure 4.1 Showing Sample Leaf Image
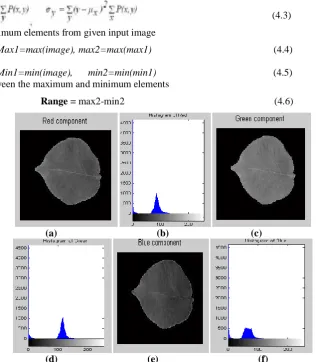
The Red, Green, and Blue Components of original image of a sample leaf and their respective histogram are showing
in figure 4.2 The RGB mean, variance, and range are computed using the following expressions:
(4.1)
© 2016, IJCSMC All Rights Reserved
81
Where, μ x, μ y are means and σ x, σ y are standard deviations defined by,
(4.3)
Maximum element and minimum elements from given input image
Max1=max(image), max2=max(max1) (4.4)
Min1=min(image), min2=min(min1) (4.5) Range is the difference between the maximum and minimum elements
Range = max2-min2 (4.6)
(a) (b) (c)
(d) (e) (f)
Figure 4.2: (a) Red Component (b) Red Component Histogram (c) Green Component (d) Green Components Histogram (e) Blue Component (f) Blue Component Histogram
Algorithm 4.1: Nine Colour Feature Extraction
RGB features are very important in classifying leafs. Here in this algorithm, the RGB components are separated and mean, variance, and range is computed for each component.
Input: Original 24-bit colour image. Output: 9 colour features.
Start
Step 1: Separate the RGB components from the original 24-bit input colour image.
Step 2: Compute mean, variance, and range for each RGB components using the equations 4.1, 4.2, 4.3, and 4.6
Step 3: Find the mean, variance, and range for each RGB components
Stop.
The colour images are recognized by quantifying the distribution of colour throughout the image, change in the colour
with reference to average/ mean and difference between the highest and the lowest colour values. This quantification is obtained
by computing mean, variance and range for a given colour image. Since these features represent global characteristics for an
image, we have adopted mean, variance and range colour features in this work. The equations are used to evaluate mean,
© 2016, IJCSMC All Rights Reserved
82
SL.NO. Features
1 Red Mean 2 Red Variance 3 Red Range 4 Green Mean 5 Green Variance 6 Green Range 7 Blue Mean 8 Blue Variance 9 Blue Range Table 4.1 Nine colour Features
Algorithm 4.2: Eighteen Colour Feature Extraction
Input: Original 24-bit colour image.
Output: 18 colour features.
Start
Step 1: Separate the RGB components from the original 24-bit input color image.
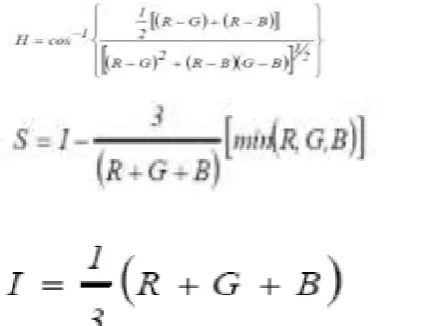
Step2: Obtain the HSI components from RGB components using the equations:
The equations (4.7), (4.8) and (4.9) are used to evaluate H, S and I components for a given image sample.
(4.7)
(4.8)
(4.9)
Step 3: Find the mean, variance, and range for each RGB and HSI components.
Stop.
© 2016, IJCSMC All Rights Reserved
83
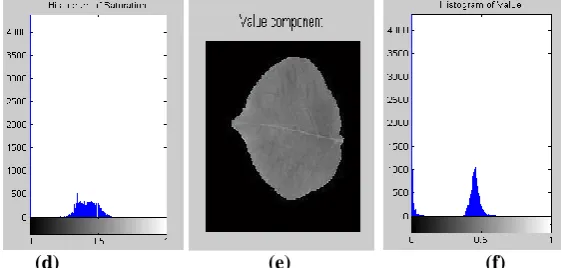
(d)
(e) (f)Figure 4.3: HSI Components and Respective Histograms of a leaf sample (a) Hue Component (b) Hue Component Histogram (c) Saturation Component d) Saturation Components Histogram (e) Value Component (f) Value Component Histogram
SL.NO. Features SL.NO. Features SL.NO. Features
1 Red Mean 7 Blue Mean 13 Saturation Mean
2 Red Variance 8 Blue Variance 14 Saturation Variance
3 Red Range 9 Blue Range 15 Saturation Range
4 Green Mean 10 Hue Mean 16 Value Mean
5 Green Variance 11 Hue Variance 17 Value Variance
6 Green Range 12 Hue Range 18 Value Range
Table 4.2 Eighteen colour Features
4.2 Texture features
Orientation of the shape is represented by the texture. Different texture features extracted from the diseased images are
energy (EG), entropy (ET), contrast (CT), homogeneity (HG) and co-relation (CR), as mentioned in below. The basic
assumption of selecting EG as a feature is based on the concept that the energy distribution in frequency domain able to identify
a texture. Besides providing acceptable retrieval performance from large texture database, EG based approaches are partly
supported by physiological studies of the visual cortex. Another feature ET is a statistical measure of randomness and invariant
to scaling, translation and rotation, used to characterize the texture of the image. It does not depend on the actual value of the
gray level but only on the probabilities of gray level distribution. Local variations present in an image are measured by texture
feature CT that helps to distinguish objects by their colour and brightness within the same field of view. In general, HG is
defined as the quality or state of being homogeneous, used to evaluate the intensity uniformity of a local region based on
high-pass operators as texture. CR measures the pixel linear dependencies of neighbouring pixels, based on which uniformity in
neighbouring regions of image is determined. Texture analysis refers to the characterization of regions in an image by their
texture content. Texture analysis attempts to quantify intuitive qualities described by terms such as rough, silky, or bumpy in the
context of an image. In this case, the roughness or bumpiness refers to variations in the brightness values or gray levels.
© 2016, IJCSMC All Rights Reserved
84
4.3 Shape FeatureAs area feature mainly depends on the portion of the leaf being affected by the disease, it is unpredictable. If the entire
leaf is affected by the disease, then total area of the healthy / diseased leaf will be same. Hence taking Area as one of the
feature, gives dissatisfactory results.
V. EXPERIMENTATION
Basic Concept of K-mean clustering
Image segmentation refers to the process of partitioning the digital image into multiple segments to change the
representation of an image into something that is more meaningful and easier to analyse. In our work, the very purpose of
segmentation is to identify regions in the image that are likely to qualify as diseased regions. There are various techniques for
image segmentation such as clustering methods, compression-based methods, histogram-based methods, region growing
methods etc. Clustering is the process of partitioning or grouping a given set of patterns into disjoint clusters. This is done such
that patterns in the same cluster are alike and patterns belonging to two different clusters are different. Clustering has been a
widely studied problem in a variety of application domains including neural networks. The K-Means clustering technique is a
well-known approach that has been applied to solve low-level image segmentation tasks. This clustering algorithm is
convergent and its aim is to optimize the partitioning decisions based on a user-defined initial set of clusters that is updated after
each iteration. The experimental results demonstrate that the proposed technique is a robust technique for the detection of plant
leaves diseases.
Steps:
1. RGB image acquisition.
2. Create the colour transformation structure.
3. Convert the colour values in RGB to the space specified in the colour transformation structure.
4. Apply K-means clustering.
5. Masking green-pixels.
6. Remove the masked cells inside the boundaries of the infected clusters.
7. Convert the infected (cluster / clusters) from RGB to HSV Translation.
We present a general k-means-based clustering algorithm that can identify natural clusters in datasets, whether they are
embedded in the original space or subspaces. Like traditional k-means clustering algorithm, the time complexity of the
algorithm is linear with the number of the data points, the dimensionality of the data, and the number of clusters in the dataset.
The experiment results show that our algorithm is an efficient algorithm with high clustering accuracy. Standard versions of
k-means algorithms seem be better in finding high fitness solutions. In the same time results obtained in standard and genetic
versions of k-means algorithms relative to validity indices are also comparable. During extensive search of solution space,
genetic versions of k-means algorithms most often find solutions with slightly worse fitness values but at the same time with
exceptionally good values of individual validity indices. Further investigation into this matter could present starting point into
improvement of k-means based image clustering techniques
.
Recent resurgence of interest in artificial neural networks has resulted in different modules for real-world applications. Neural network models have been applied in low level image© 2016, IJCSMC All Rights Reserved
85
filtering, target detection, radar imaging, medical imaging, document analysis, character signature, face and object recognition.
It has also found applications in three-dimensional object recognition, motion estimation, stereo vision and expert systems.
Artificial Neural Network Based Classifier:
We have used a multilayered back propagation neural network (BPNN) as a classifier of different produce and in
automatic detection of disease. The number of neurons in the input layer corresponds to the number of input features and the
number of neurons in the output layer corresponds to the number of classes. The classifier is trained, validated and tested using
images of different agriculture/horticulture produce. The procedure adopted in classification is given in
Algorithm
Algorithm: BPNN Classifier.
Start
Step 1: Accept images of the agriculture/horticulture Produce.
Step 2: Extract different color and texture features
Step 3: Train the BPNN with extracted features
Step 4: Accept test images and perform Step 2
Step 5: Recognize and classify the produce images using BPNN classifier.
Stop.
VI. RESULTS AND DISCUSSION
We have presented Neural Network Model for classification of leaf and working of Neural Network Model. In this
study of the twenty four features used in the work is presented, and comparative study using feature sets is discussed. This
section gives the results of exhaustive experimentation of developed methodology. A total of 150 images of potato leaf samples
(50 Healthy and 100 Infected) are used in this experiment. BPN feed forward Neural Network is used for training, learning,
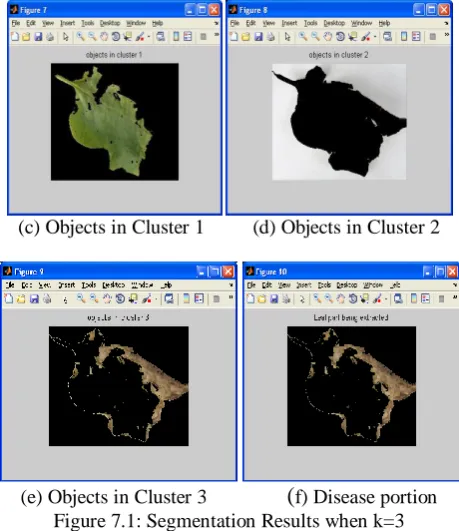
testing, detecting and classifying the leaf types. When K-Means algorithm is run for the given input image with K=3 , for most
of the cases, the result fails to separate the clusters and thus the diseased portion gets merged into other colour cluster. But in
few cases, the diseased portion was extracted along with some part of the leaf veins. The below figures shows the segmentation
results when K value is three.
© 2016, IJCSMC All Rights Reserved
86
(c) Objects in Cluster 1
(d) Objects in Cluster 2
(e) Objects in Cluster 3
(
f) Disease portion Figure 7.1: Segmentation Results when k=3In the contemporary exertion, features are extracted for the classification result. Initially colour features are extracted
for the classification results. Features namely colour (18), texture (5) and area are extracted for both healthy and diseased
samples. The extraction of diseased part of the leaf and binary image of that part are shown below.
Figure 7.2: (a) Extracted Leaf Part (b) Binary Image of Extracted Part
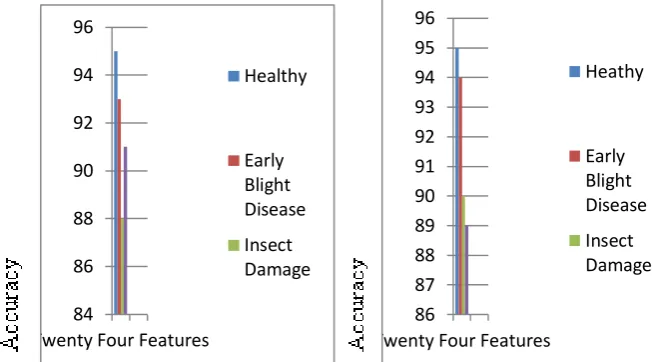
Comparative study using feature set
Figure shows the comparative study using feature set from the figure it is clear that classification using 24 feature
© 2016, IJCSMC All Rights Reserved
87
Figure 7.3: Comparative Graph of Accuracy for Non-interactive System and Comparative Graph of Accuracy for Interactive System
RESULTS
Table 8.1: Values of RGB Colour, HSV, Texture and Shape Features Extracted by Considering Some Images
VII. CONCLUSION
The current work aims to develop a quick, automatic and accurate system for disease identification and classification
for potato leaves. The potency (related to) of the system is the capability to extract the diseased portion in the query images. The
system employs diverse image processing techniques. Neural Network, one of the Machine Learning Techniques, has been used
to categorize the query leaf image as either healthy or diseased sample. Implementation is carried out using the MATLAB
Image Processing and Bioinformatics Tool Box. The results showed that BPNN could effectively detect the disease spots and
classify the particular disease type by mentioning name of disease, cause of disease and pesticides to be to prevent the diseases
with accuracy of 92%. Thus the system can be satisfactorily used for disease detection and classification over Potato Plant leaf
which ultimately helps the agriculturists/farmers.
84 86 88 90 92 94 96
Twenty Four Features
Healthy Early Blight Disease Insect Damage 86 87 88 89 90 91 92 93 94 95 96
Twenty Four Features
© 2016, IJCSMC All Rights Reserved
88
REFERENCES[1] Dickson, M.A., and Bausch, W.C. “Plant recognition using a neural network classifier with size and shape descriptors”,
Transactions of the ASAE, vol. 1, pp. [97-102] 1997.
[2] Zhang, M., Laszlo, L. Mark, M., Krutz, G., and Cyrille, P, “Application of colour vision machine in the agriculture and food industries”, Proceeding of SPIE, The International Society for optical engineering, vol. 3543, pp. [208-219] 1999.
[3] Sabah Bashir, Nav deep Sharma“Remote Area Plant Disease Detection Using Image Processing” 1, 2[Amity School of
Engineering and Technology, Amity University Uttar Pradesh, India] Sep-Oct 2012.
[4] Leszek Wojnar, “Image analysis- applications in Material engineering” CRC Press LLC, 1999.
[5] A. A. Bernardes, J. G. Rogeri, N. Marranghello and A. S. Pereira “Identification of Foliar Diseases in Cotton Crop”
[Volume 17– No.1], March 2001.
[6] Basvaraj .S. Anami, J.D. Pujari and Rajesh.Yakkundimath. “Identification and Classification of Normal and Affected
Agriculture/horticulture Produce Based on Combined Color and Texture Feature Extraction”. [VOL I, ISSUE III], September
2011.
[7] Mr. Viraj A. Gulhane and Dr. Ajay A. Gurjar. “Detection of Diseases on Cotton Leaves and Its Possible Diagnosis”.
International Journal of Image Processing (IJIP), [Volume (5): Issue (5)],2011.
[8] Sanjay B. Patil, Dr. Shrikant K. Bodhe.“Leaf disease severity measurement using image processing”. [IEIT Journal of
Adaptive & Dynamic Computing, [(4), 25–30], 2012.
[9] Piyush Chaudhary, A. “Color Transform Based Approach for Disease Spot Detection on Plant Leaf”. nand K. Chaudhari,
Dr. A. N. Cheeran and Sharda Godara. International Journal of Computer Science and Telecommunications [Volume 3, Issue
6], June 2012.
[10] Tushar H Jaware, Ravindra D Badgujar and Prashant G Patil. “Crop disease detection using image segmentation”. World