TA Anisotropy Summary
K.Kawata1,∗,A.di Matteo2,T.Fujii1,D.Ivanov3,C.C.H.Jui3,J.P.Lundquist3,J.N.Matthews3,S.Ogio4,H.Sagawa1,
G.B.Thomson3,P.Tinyakov2,I.Tkachev5, andS.Troitsky5(On behalf of the Telescope Array Collaboration)
1Institute for Cosmic Ray Research, University of Tokyo, Kashiwa, Chiba, Japan 2Service de Physique Th´eorique, Universit´e Libre de Bruxelles, Brussels, Belgium
3High Energy Astrophysics Institute and Department of Physics and Astronomy, University of Utah, Salt Lake City, Utah, USA 4Graduate School of Science, Osaka City University, Osaka, Osaka, Japan
5Institute for Nuclear Research of the Russian Academy of Sciences, Moscow, Russia
Abstract. The Telescope Array (TA) is the largest ultra-high-energy cosmic-ray (UHECR) detector in the northern hemisphere. It consists of an array of 507 surface detectors (SD) covering a total 700 km2and three
fluorescence detector stations overlooking the SD array. In this proceedings, we summarize recent results on the search for directional anisotropy of UHECRs using the latest dataset collected by the TA SD array. We obtained hints of the anisotropy of the UHECRs in the northern sky from the various analyses.
1 Introduction
The observable sources of super-GZK ultra high energy cosmic ray (UHECR) events are thought to be limited to the local universe within distances of∼100 Mpc for pro-ton/iron. In order to accelerate particles up to the ultra-high-energy range, particles must be confined to the accel-erator site for more than a million years by a strong mag-netic field and/or a large-scale confinement volume [1]. This would thus limit the number of possible accelerators in the universe to astrophysical candidates such as galaxy clusters, supermassive black holes in active galactic nuclei (AGNs), jets and lobes of active galaxies, starburst galax-ies, gamma-ray bursts, etc.. Extragalactic astrophysical objects form the well-known large-scale structure (LSS), most of which is spread along the “supergalactic plane” in the local universe.
The main difficulty in identifying the origin of UHE-CRs is the loss of directional information due to magnetic field induced deflection. The deflection angle of a 60 EeV proton over a distance of 50 Mpc is estimated to be a few degrees assuming models with an intergalactic mag-netic field (IGMF) strength of 1 nG. Meanwhile, the esti-mated deflection by the galactic magnetic field (GMF) is between a few degrees and ten degrees, depending on the direction in the sky. If the highest-energy cosmic rays are protons coming from matter in the local universe such as the nearby galaxies, then the maximum amplitude of the cosmic-ray anisotropy above ∼60 EeV is expected to be detectable by the latest UHECR detectors [2].
The largest UHECR detector in each hemisphere, Tele-scope Array (TA) in the north and Pierre Auger Obser-vatory (Auger) in the south have both obtained some hints/evidence of anisotropy in cosmic-ray arrival
direc-∗e-mail: [email protected]
tions. Recent anisotropy measurements and the efforts to identify UHECR sources are summarized in Ref. [3]. The Auger collaboration has found a dipole-like anisotropy with an amplitude of 6.5% for cosmic rays with energy greater than 8 EeV. The anisotropy has a statistical signif-icance of 5σ[4]. The Auger group also claimed a correla-tion between the flux pattern of nearby starburst galaxies and UHECRs with energy greater than 39 EeV. Here the statistical significance is at the 4σlevel [5]. Meanwhile, the TA collaboration has reported a cluster of UHECRs, withE > 57 EeV, in the first 5-years observation period from 2008 May to 2013 May [6]. This “hotspot” is cen-tered near the Ursa Major cluster, and extends to∼20◦ an-gular scale. The chance probability of this hotspot in an isotropic cosmic-ray sky was calculated to be 3.7×10⁻⁴
(3.4σ). Subsequently, the TA collaboration found evi-dence of intermediate-scale anisotropy in the energy spec-trum above 1019.2 eV in the TA hotspot direction using
7-year data [7].
In this proceeding, we summarize recent anisotropy studies made with data collected by the Telescope Array surface detector array.
2 Telescope Array Experiment
3 Correlation with Large-Scale Structure
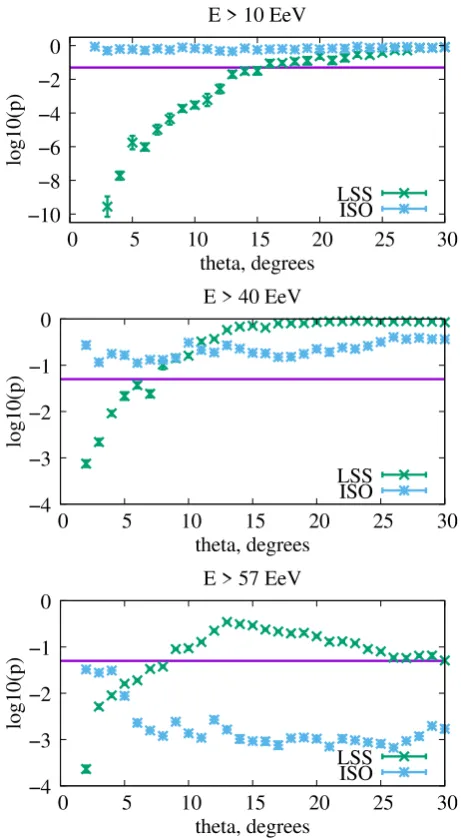
The observable sources of super-GZK events are thought to be limited to the local universe within distances of ∼100 Mpc. Roughly, most types of extragalactic objects might be embedded in the large-scale structure (LSS) of the universe. Firstly, we compare the TA event distribu-tion to the LSS hypothesis model based on the 2MASS Galaxy Redshift Catalog (XSCz), which represents the mass distribution in the Universe. In this model, we as-sume a proton composition and simulate the propagation from the sources to the Earth taking account of various en-ergy losses. The simulated arrival directions are smeared by the 2D Gaussian with the angular widthθ (smearing angle) as a free parameter, which represents the deflection angle of the UHECR in the magnetic fields. The final flux map is multiplied by the TA exposure to compare the ob-served arrival directions. For more details concerning the method, see Ref. [12]. The predicted flux model is then compared to the TA event distributions with the energy greater than 10, 40 and 57 EeV, respectively, while scan-ning the smearing angle. For comparison, we also test the TA events with the isotropic flux model.
Figure 1 shows the compatibility between TA events collected within 10 years of data and two models. The flux model is the LSS hypothesis (blue points) and the second is an isotropic hypothesis (green points). At the lower energies, E>10 and>40 EeV, the TA event distribu-tion is consistent with an isotropic source distribudistribu-tion for any smearing angles, while the compatibility with the LSS hypothesis is poor at small smearing angles. However, at higher energies, E >57 EeV, the LSS hypothesis agrees with the TA event distribution for moderate smearing an-gles (10◦ −25◦) while the data is incompatible with the isotropic model. In the next section, we will discuss the event distribution above 57 EeV in the northern sky.
4 Hotspot Above 57 EeV
The Telescope Array collaboration reported on an indica-tion of excess flux of UHECRs with E>57 EeV using 5-year data [6]. This region of sky centered near the Ursa Major cluster was called the “hot-spot” and it extends to≳10◦ angular scale. The chance probability finding a hotspot in an isotropic cosmic-ray sky was calculated to be 3.7×10⁻⁴(3.4σ) assuming 15◦, 20◦, 25◦, 30◦, and 35◦
oversampling radius circles were searched.
In this work we test this result using the 10-year data collected by the TA SD array. We have observed 157
t ✏✑t ✒✓✔ ✑✕✖ ✑✑✗
▲
■ ✁
✲ ✂ ✲ ✄ ✲ ☎ ✲ ✆ ✥
✥ ✝ ✆✥ ✆✝ ☎✥ ☎✝ ✄✥
❧
✞
✟
✠
✡
☛
☞
✌
t ✍✎t ✏✑✒ ✎✓✔ ✎✎✕
❊✖✂✥❊ ✎✗
▲
■ ✁
✲ ✂ ✲ ✄ ✲ ☎ ✲ ✆ ✥
✥ ✝ ✆✥ ✆✝ ☎✥ ☎✝ ✄✥
❧
✞
✟
✠
✡
☛
☞
✌
t ✍✎t ✏✑✒ ✎✓✔ ✎✎✕
❊✖✝✗❊ ✎✘
Figure 1. Compatibility between UHECR events observed by the TA for 10 years and two different models which are the flux model of the LSS hypothesis (blue points) and the isotropic hy-pothesis (green points). Three plots show compatibility for en-ergy thresholds of 10 EeV, 40 EeV, and 57 EeV, respectively. The horizontal red line indicates a 95% confidence level.
events with E > 57 EeV in 10 years, which is approx-imately double statistics of the first 5-year observation. These events are summed over different five oversampling radius circles, 15◦, 20◦, 25◦, 30◦, and 35◦. The centers of tested directions are on a 0.1◦×0.1◦grid in the equatorial coordinates. We then search for the maximum significance over all grid points and five oversampling radius circles. We found the maximum significance of 5.0σat a position R.A.=144.3◦, and Dec.=40.3◦ with 25◦oversampling ra-dius circle. The chance probability of the 10-year hotspot in an isotropic sky is estimated to be 2.1×10⁻³(2.9σ).
Figure 2. (Left) A significance map in the equatorial coordinates of arrival directions of UHECR events with E>57 EeV for events observed in the 1st 5 years of Telescope Array data. Events are smoothed by 20◦ oversampling radius circle. (Right) A significance map of UHECR events with E>57 EeV for the first 10 years of data. Here, the events are smoothed by 25◦oversampling radius circle which was determined to maximize the significance.
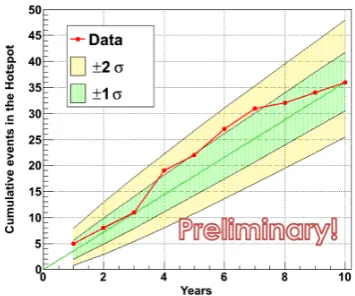
Figure 3. Integral time variation of the TA hotspot. Red points show the evolution of the data collection above 57 EeV within the hotspot region. Green and yellow shaded areas show 1σand 2σdeviations from the rate of data observation respectively, as-suming a linear increase in rate.
the way to the SGP, and is irregular in shape. Therefore a circular oversampling shape is not really appropriate, and using one results in a lower limit on the significance. How-ever, for simplicity we include such a calculation.
We divided the 10-year data into the first 5 years and the second 5 years. The significance at the hotspot posi-tion is 5.0σfor the first 5 years and 2.0σfor the second 5 years, respectively, with 25◦radius circle. Figure 3 shows the cumulative events inside the hotspot circle defined by the 10-year dataset to check a deviation from the linear in-crease. Green and yellow bands in this figure represent 1σ and 2σ allowed regions. The increase rate of the events inside the hotspot circle is consistent with a constant 2σ excess.
5 Spectral Anisotropy at the Hotspot
We extend the hotspot study to lower energies, E<57 EeV and search for specifically localized differences in the en-ergy distribution of events. In this analysis, we compare the spectra inside and outside of the hotspot region [7].
See Figure 4 (Right). The difference between the spec-tra above 1019.2 eV was evaluated by the Poisson
likeli-hood ratio test. The position and size of the region that maximizes the spectral difference was allowed to differ from the previously described hotspot. A search there-fore was performed by sliding a circular window over the sky, scanning the lower energy thresholds (1019.0, 1019.1,
1019.2 and 1019.3 eV) in the spectrum. Figure 4 (Left)
shows significance map of the spectral anisotropy above 1019.2 eV which is smoothed by 14.03% equal exposure spherical cap bins. The maximum local significance in the whole sky is calculated to be 6.17σ, its position is lo-cated at R.A.=9h6m, Dec.=45◦ which is near the center of the original hotspot direction. The flux with energies 1019.2 < E < 1019.75 eV has a deficit for and an excess
for E>1019.75eV (∼57 EeV), respectively, compared with
the average flux of the other sky. The post-trial probability of this spectral anisotropy appearing by chance from the isotropic distribution is estimated to be 9×10⁻⁵, which
corresponds to 3.74σ.
The spatial distribution of positions which have the spectral anisotropy in Fig. 4 seems to be parallelly shifted from the supergalactic plane as shown by the red curve. A shift from the supergalactic plane is estimated to be −16.5◦. It appears that an extended feature that could be correlated with supergalactic structure. Biermann et al. [13] argued that the possiblitity to focus the highest cos-mic rays above 50 EeV in the direction perpendicular to the supergalatic sheets. On the other hand Ryu et al. [14] discussed that lower energy cosmic rays transverse to cos-mological sheets/filaments.
6 Small-Scale Anisotropy Search Above
100 EeV
respec-Figure 4.(Left) The significance map of the spectral anisotropy above 1019.2eV which is smoothed by 14.03% equal exposure spherical
cap bins (from [7]). Solid curves indicate the galactic plane (GP) in blue and supergalactic plane (SGP) in red. The Galactic center (GC) is indicated by a white star and anti-galactic center (Anti-GC) by a gray star. (Right) The energy distribution inside the spherical cap bin (red) at the maximum significance position (R.A.=9h16m, Dec.=45◦) in the direction of the Hotspot, compared to the expected
distribution (blue).
Figure 5.An Aitoffprojection of the UHECR map in equatorial coordinates. The red circles and blue squares show directions of the UHECRs with E>100 EeV observed by the TA and the PAO, respectively. The solid curves indicate the Galactic plane (GP) and the supergalactic plane (SGP). The closed and open stars indicate the Galactic center (GC) and the anti-Galactic cen-ter (Anti-GC).
tively. It is noted that the expected energy-scale difference between TA and Auger has not corrected here. Figure 5 shows the distribution of 28 cosmic-ray events E>100 EeV observed by the TA (red circles) and Auger (blue squares) in the equatorial coordinate. A doublet of events observed by TA and Auger near the equator has been reported by Troitsky [16]. In the updated data, we find a new event with E>100 EeV near this doublet. Therefore, a triplet of events with E>100 EeV is possible in the overlaping region of sky, although the angular distance between the doublet and this event is 3.7◦, which can not be explained by our angular resolutions which are expected to be∼√2◦ assuming neutral particles. It is noted that the deflection angle for 100 EeV proton is expected to be a few degrees in Galactic magnetic field. In addition, we also find the an-other double of events with E>100 EeV within the hotspot circle. The angular distance of this doublet is 1.31◦, which is within our angular resolution∼√2◦. Then, the chance
probability of ≥2 doublets at <√2◦ from the isotropic cosmic-ray sky is calculated to be 3×10⁻³(2.8σ) by the
Monte Carlo simulation.
7 Correlation with Starburst Galaxy
Recently, the Auger collaboration reported a correlation between the flux pattern of 23 nearby starburst galaxies (SBGs) and the arrival directions of the UHECR with E>39 EeV in the southern sky [5]. They investigated com-patibilities between the observed arrival directions of the UHECRs and several flux pattern models based on the extragalactic source catalogs, such as the second catalog of hard Fermi-LAT sources (2FHL) and SBG list by the Fermi-LAT (Gamma Ray), and Swift-BAT (X-ray) and 2MASS (Optical) surveys. In order to evaluate the com-patibility, they perform an unbinned maximum-likelihood method for each flux model. The test statistics (TS) value is derived from the likelihood ratio test between the flux model and an isotropic model. The best-fit parameters in each flux model are searched to maximize the TS value, scanning the parameter spaces, which are the threshold en-ergy of observed events (Eth=1−80 EeV), the ratio of the
flux model to the isotropic flux (fani), and the smearing
an-gle of the model map (ϕ). They determined that the SBG flux model shows better compatibility than the isotropic model with a statistical significance 4.0σ, and the best-fit parameters for the SBG flux model are determined to be Eth=39 EeV, fani=9.7%, andϕ=12.9◦.
Unlike the Auger’s method, we do not scan the pa-rameters to avoid any statistical penalty. We tested a SBG flux pattern using the Auger best-fit parameters, which are Eth = 39 EeV, fani =9.7%, andϕ = 12.9◦. These were
cor-Figure 6.(Left) The green points show the event distribution observed by the TA during between May 2008 and May 2017, from [17]. The color contour shows the Auger best-fit flux model multiplied by the TA exposure. (Right) The TS distribution calculated by the MC simulation assuming the isotropic distribution (green) and the Auger SBG best-fit model (red). The downward arrow indicates the TS value estimated from the TA data.
responding to 39 EeV in Auger when taking into account the energy-scale difference between two experiments. Fig-ure 6 (Left) shows the TA event distribution (Points) over-lapped with the Auger best-fit model map multiplied by the TA exposure (Contour). The TS value for this test is calculated to be−1.0 as shown in Fig. 6 (Right) by a downward arrow. In order to estimate chance probability of the obtained TS value, we generate a number of MC sets, each having 284 random directions which is same as statistics of the experimental data. The histograms in Fig. 6 (Right) represent the TS distribution by the MC sets assuming the isotropic distribution (green) and the Auger best-fit model (red). We find that the TA data is compati-ble with isotropy to within 1.1σand with the Auger result to within 1.4σ, meaning that it is not possible to discrimi-nate between these two hypotheses. For more details, see Ref. [18].
8 Supergalactic Structure of Multiplets
If multiple UHECRs with different energies have traveled from a point source through the regular magnetic field, ar-rival directions could be aligned from the source direction in the sky. The angular distance of each event from the source direction should be inversely proportional to the en-ergy. The lower energy events would be located away from the source and smeared by the random magnetic field, while the higher energy events would be placed close to the source direction with the smaller smearing angle. As a result, the multiple events are expected to be distributed within the wedge-like shape due to the regular and random magnetic fields. In this analysis, we investigate correlation between the cosmic-ray energy and the angular distance from a given direction in the wedge shape [19]. Previous similar studies of energy-position correlation did not yield results [20, 21]. A wedge shape is defined by the point-ing direction (ϕ), the wedge width (∆ϕ) and the maximum wedge distanceD(spherical cap radius).
In order to evaluate the correlation between the en-ergy and angular distance in the wedge, we use Kendall’sτ ranked correlation which measures the monotonic
depen-dence between the variables [22].
τ= (# of concordant pairs)−(# of discordant pairs)
n(n−1)/2 (1)
Ranks are the ordering of the sorted variable (e.g.1st, 2nd, etc.). A concordant pair of observations (xi, yi) and (xj, yj),
wherei < j, have equal differences in ranks (xi >xjand
yi > yj or the converse). They are discordant if xi > xj
andyi < yj(or the converse). The correlation coefficient
τhas a range from−1 to+1, and the large|τ|indicates a strong correlation. Negative (positive)τ means energies are inversely-proportional (proportional) to angular dis-tances in the wedge shape, while positiveτmeans energies are proportional to distances.
We search for the maximum|τ|, scanning in 4 param-eter spaces, which areϕ,∆ϕ,Dand the energy threshold Eth, in our FoV. Figure 7 (Left) shows the sky map of the
maximum correlation strength τ in the supergalactic co-ordinate. The negative correlations of greater significance appear correlated with supergalactic plane. The post-trial significance is estimated to be greater than ∼4σby MC simulation. Figure 7 (Right) shows the meanτinside equal solid angle bins for the data as a function of the supergalac-tic latitude. These results suggest that the higher energy events concentrate on the supergalactic plane, and a flow of magnetic deflection perpendicular to the supergalactic plane may exists [13].
9 Summary
In this proceeding, we have summarized recent results on the search for directional anisotropy of UHECRs using the data collected by the TA SD array as follows. For events with E>57 EeV, the TA event distribution is consis-tent with the LSS hypothesis at middle-scale smearing an-gles (10◦-25◦), while the compatibility with the isotropic hypothesis is poor. The TA hotspot analysis was up-dated using the 10-year observation. The spectrum above E>1019.2eV around the TA hotspot seems to deviate from
Figure 7. (Left) The sky map of the correlation strengthτin the supergalactic coordinate taken from [19]. The solid gray curve and red horizontal line indicate galactic plane (GP) and supergalactic plane (SGP), respectively. White and grey stars indicate the Galactic center (GC) and anti-galactic center (Anti-GC). (Right) The meanτinside equal solid angle bins for the data as a function of the supergalactic latitude. The solid red curve shows the best-fit curve to the data by the parabola function (ax2+bx+c).
angular resolution. The chance probability of finding≥2 doublets is estimated to be 3×10⁻³. We tested correlation
between the TA events and the SBG flux model claimed by the Auger. Our result is consistent with both the isotropic model and the SBG flux model with Auger best-fit pa-rameters so far. We also searched for UHECR multiplets which the correlation between the cosmic-ray energy and the angle distance from the vertex in the wedge shape. The strong correlations appear correlated with supergalactic plane. Thus, we obtained hints of the UHECR anisotropy in the northern sky with our current dataset. The TA will continuously observe to verify our current results. In addi-tion, we are promoting the TA×4 project [23], which will extend the size of the TA SD by a factor of 4, to collect data at a faster rate.
Acknowledgments
The Telescope Array experiment is supported by the Japan Society for the Promotion of Science(JSPS) through Grants-in-Aid for Priority Area 431, for Specially Promoted Research JP21000002, for Scientific Re-search (S) JP19104006, for Specially Promote ReRe-search JP15H05693, for Scientific Research (S) JP15H05741 and for Young Scientists (A) JPH26707011; by the joint research program of the Institute for Cosmic Ray Research (ICRR), The University of Tokyo; by the U.S. National Science Foundation awards PHY-0601915, PHY-1404495, PHY-1404502, and PHY-1607727; by the National Re-search Foundation of Korea (2015R1A2A1A01006870,
2015R1A2A1A15055344, 2016R1A5A1013277,
2016R1A2B4014967, 2017R1A2A1A05071429); by the Russian Academy of Sciences, RFBR grant 16-02-00962a (INR), IISN project No. 4.4502.13, and Belgian Science Policy under IUAP VII/37 (ULB). The foundations of Dr. Ezekiel R. and Edna Wattis Dumke, Willard L. Eccles, and George S. and Dolores Dore Eccles all helped with generous donations. The State of Utah supported the project through its Economic Development Board, and the University of Utah through the Office of the Vice President for Research. The experimental site became available through the cooperation of the Utah
School and Institutional Trust Lands Administration (SITLA), U.S. Bureau of Land Management (BLM), and the U.S. Air Force. We appreciate the assistance of the State of Utah and Fillmore offices of the BLM in crafting the Plan of Development for the site. Patrick Shea assisted the collaboration with valuable advice on a variety of topics. The people and the officials of Millard County, Utah have been a source of steadfast and warm support for our work which we greatly appreciate. We are indebted to the Millard County Road Department for their efforts to maintain and clear the roads which get us to our sites. We gratefully acknowledge the contribution from the technical staffs of our home institutions. An allocation of computer time from the Center for High Performance Computing at the University of Utah is gratefully acknowledged.
References
[1] Hillas, A. M. 1984, ARA&A,22, 425
[2] A. di Matteo and P. Tinyakov, MNRAS,476, 715 [3] O. Deligny, K. Kawata and P. Tinyakov, PTEP.,
12A104 (2017)
[4] A. Aab et al. (The Pierre Auger Collaboration), Sci-ence,357, 1266 (2017)
[5] A. Aab et al. (The Pierre Auger Collaboration), ApJL, 853, L29 (2018)
[6] R. U. Abbasi et al. (The Telescope Array Collabora-tion), ApJL,790, L21 (2014)
[7] R. U. Abbasi et al. (The Telescope Array Collabora-tion), ApJ862, 91 (2018)
[8] H. Kawai et al.(The Telescope Array Collaboration), Nucl. Phys. B Proc. Suppl.,175, 221 (2008)
[9] H. Tokuno, et al. (The Telescope Array Collabora-tion), NIM-A,676, 54 (2012)
[10] J. N. Matthews et al (The Telescope Array Collabo-ration), 30th ICRC (Merida),5, 1157 (2007)
[11] T. Abu-Zayyad et al. (The Telescope Array Collabo-ration), NIM-A,689, 87 (2012)
[13] P. L. Biermann, and H. Kang, and D. Ryu, arXiv:astro-ph/9709250 (1997)
[14] D. Ryu, H. Kang, and P. L. Biermann, A&A,335, 19 (1998)
[15] M. Takeda et al. (The AGASA Collaboration), ApJ 522, 225 (1999)
[16] S. V. Troitsky, JETP Letters,96, 13 (2012)
[17] A. di Matteo, T. Fujii, and K. Kawata (The Telescope Array Collaboration), in this proceedings
[18] R. U. Abbasi et al. (The Telescope Array Collabora-tion), ApJL867, L27 (2018)
[19] J. P. Landquist et al. (The Telescope Array Collabo-ration), in this proceedings
[20] P. Abreu et al. (The Pierre Auger Collaboration), As-tropart. Phys.,35, 354 (2012)
[21] A. Aab et al. (The Pierre Auger Collaboration), As-tropart. Phys.,68, 27 (2015)
[22] M. G. Kendall, Biometrika,33, 239 (1945)
![Figure 4. (Left) The significance map of the spectral anisotropy above 1019.2 eV which is smoothed by 14.03% equal exposure sphericalcap bins (from [7])](https://thumb-us.123doks.com/thumbv2/123dok_us/8122626.1353360/4.595.61.285.338.459/figure-left-signicance-spectral-anisotropy-smoothed-exposure-sphericalcap.webp)
![Figure 6. (Left) The green points show the event distribution observed by the TA during between May 2008 and May 2017, from [17].The color contour shows the Auger best-fit flux model multiplied by the TA exposure](https://thumb-us.123doks.com/thumbv2/123dok_us/8122626.1353360/5.595.82.517.83.214/figure-points-distribution-observed-contour-auger-multiplied-exposure.webp)
![Figure 7. (Left) The sky map of the correlation strength τ in the supergalactic coordinate taken from [19]](https://thumb-us.123doks.com/thumbv2/123dok_us/8122626.1353360/6.595.69.515.84.212/figure-left-sky-correlation-strength-supergalactic-coordinate-taken.webp)
