A Hybrid 3-D Reconstruction/Registration
Algorithm for Correction of Head
Motion in Emission Tomography
B. F. Hutton, Senior Member, IEEE, A. Z. Kyme, Y. H. Lau, D. W. Skerrett, and R. R. Fulton, Senior Member, IEEE
Abstract—Even with head restraint, small head movements
can occur during data acquisition in emission tomography that are sufficiently large to result in detectable artifacts in the final reconstruction. Direct measurement of motion can be cumber-some and difficult to implement, whereas previous attempts to use the measured projection data for correction have been limited to simple translation orthogonal to the projection. A fully three-dimensional (3-D) algorithm is proposed that estimates the patient orientation based on the projection of motion-corrupted data, with incorporation of motion information within subse-quent ordered-subset expectation-maximization subiterations. Preliminary studies have been performed using a digital version of the Hoffman brain phantom. Movement was simulated by constructing a mixed set of projections in discrete positions of the phantom. The algorithm determined the phantom orientation that best matched each constructed projection with its corresponding measured projection. In the case of a simulated single movement in 24 of 64 projections, all misaligned projections were correctly identified. Incorporating data at the determined object orientation resulted in a reduction of mean square difference (MSD) between motion-corrected and motion-free reconstructions, compared to the MSD between uncorrected and motion-free reconstructions, by a factor of 1.9.
Index Terms—Emission computed tomography, image
recon-struction, image registration, motion compensation.
I. INTRODUCTION
I
N BOTH single-photon emission computed tomography (SPECT) and positron emission tomography (PET), patient motion is common due to the long acquisition time. Since reconstruction algorithms operate on the assumption that the object to be imaged is stationary during acquisition, any move-ment may give rise to artifacts in the reconstruction. Although head restraint is routinely used in brain studies, the likelihood of motion remains high, particularly with noncompliant patients. Even with the small movements recorded with head restraint, measurable effects can be demonstrated [1]. Moreover, asManuscript received October 25, 2000; revised June 18, 2001.
B. F. Hutton, Y. H. Lau, and D. W. Skerrett are with the Department of Nuclear Medicine and Ultrasound and the Department of Medical Physics, Westmead Hospital, NSW 2145 Westmead, Australia (e-mail: [email protected]).
A. Z. Kyme was with the Department of Physics, University of NSW, Randwick, NSW, Australia. He is now with the Department of Medical Physics, Westmead Hospital, NSW 2145 Westmead, Australia.
R. R. Fulton is with the Department of PET and Nuclear Medicine, Royal Prince Alfred Hospital, NSW 2050 Camperdown, Australia (e-mail: [email protected]).
Publisher Item Identifier S 0018-9499(02)01644-1.
detector resolution improves, the need for correction of motion increases.
Several groups have used direct measurement to detect or es-timate motion with subsequent correction. These include use of radio-frequency devices [2], video monitoring [3], optical trackers [4], [5], or less expensive mechanical devices [6]. Cor-rection in PET has included direct modification of individual coincidence lines of response [2] or acquisition of a new frame when significant motion is detected [3], [7]. In SPECT (or in PET systems that rely on detector rotation), there is further com-plication since motion may occur during detector rotation. This both distorts projections and leads to incomplete data corre-sponding to a stationary position of the patient. A method of direct three-dimensional (3-D) reconstruction incorporating the average location for each projection has been developed previ-ously by our group [8]. Others have suggested alternative ap-proaches to 3-D reconstruction incorporating motion informa-tion (e.g., [9]). In general, the use of devices for direct mea-surement can be cumbersome or expensive and usually requires careful calibration.
Several groups have attempted to correct for motion without direct measurement. Estimated projections from reconstructed data have been realigned with measured projections. However, correction has been limited to the translation of projections only [10], [11]. Others acquired data as a series of short studies so that motion in each frame was minimized. Subsequent correction is then achieved either by rejecting data when motion occurs [12] or by registration of the multiple frames [13]. Neither technique provides a general solution for data-driven motion correction. The purpose of this paper is to present a hybrid technique that involves registration to determine the 3-D orientation of the pa-tient at each projection angle, incorporating this information in a fully 3-D reconstruction.
II. DESCRIPTION OF THEALGORITHM
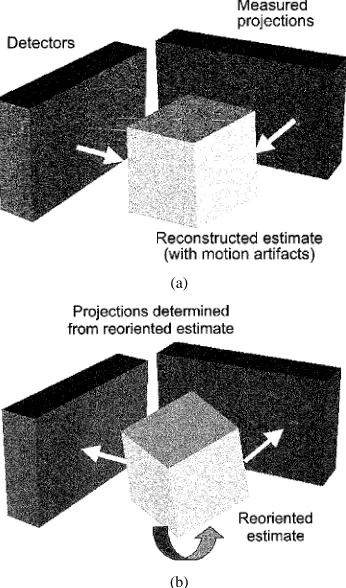
The method will be described for a dual-head right-angled SPECT system [Fig. 1(a)], which is sensitive to all six degrees of freedom associated with rigid motion. However, the approach is generally applicable to a range of detector or collimator ge-ometries. Reconstruction is normally performed using the mea-sured projections to reconstruct individual planes. However, if motion of the object has occurred during data acquisition, some projections will be incorrectly located relative to the object for conventional multiplane two-dimensional (2-D) reconstruction.
(a)
(b)
Fig. 1. (a) Measured projections are used to reconstruct an estimate of the activity distribution in the object, shown here for a dual-detector SPECT system. This reconstructed estimate may contain motion artifacts. (b) The reconstructed estimate is reoriented so as to result in the best match between the constructed (forward-projected) projections and the original measured projections.
Provided the movement was relatively small, the multiplane re-construction will still be a reasonable estimate of the activity distribution. This corrupted estimate can be used to construct a set of 2-D projections that can be directly compared with the measured projections. As a result, one can determine the 3-D orientation of the reconstructed object that will result in the op-timal match between constructed (forward-projected) and mea-sured projections. This is achieved by implementing a fully 3-D rigid-body registration of the object where the optimal object position and orientation are determined using the simplex al-gorithm [see Fig. 1(b)]. The cost function is formulated as the mean squared difference (MSD) between the constructed and measured 2-D projections. Note that the MSD is evaluated for all projections acquired simultaneously (i.e., the right-angled pair of projections in our case).
Once the optimal position and orientation of the object are determined, the corresponding projections will be correctly aligned for use in updating the reconstruction. A useful prop-erty of the ordered-subsets expectation-maximization (OSEM) algorithm is utilized [14]. Since each subiteration involves the use of only a subset of projections, these can be chosen so as to include projections recorded when the object was in a particular orientation. A similar approach was used previously for incorporation of measured motion in 3-D reconstruction [8]. In the case of a dual-detector system, the subset contains the pair of projections for which the object orientation has been optimized, but may include additional projections that correspond to the same object orientation. The process is
repeated for each projection pair, progressively improving the reconstructed estimate with correctly aligned projections.
In practice, reconstruction usually involves attenuation cor-rection, ideally based on transmission data. Attenuation correc-tion is easily incorporated into the above algorithm by reposi-tioning the reconstructed attenuation map to match the emission position and orientation at all times.
III. METHODS
A. Demonstration of Feasibility
To assess the operation of the algorithm, a digital version of the Hoffman brain phantom (128*128*80) was used. Complete projection sets (64*40*64) were constructed by forward-pro-jecting the phantom in its unmoved position (as a motion-free reference) and at various orientations of the phantom. The pixel size was 4.4 mm. Projection included attenuation and distance-dependent resolution but no scatter. Motion-corrupted studies were created by substituting 90 projection pairs from the mis-aligned set into the motion-free set.
To demonstrate feasibility, simple one-dimensional reorienta-tions were examined. The object was translated in the -direc-tion (0.5, 1, 2 pixels) and rotated about the -axis (1 , 2 , 4 ). In each case, two situations were simulated, whereby either four or 12 orthogonal pairs of consecutive, reoriented projections were substituted in the total of 64 projections. These preliminary tests were conducted with noise-free data. Each dataset was re-constructed and the degree of distortion in the reconstruction assessed using the MSD between motion-corrupted and mo-tion-free reconstructions. Using the corrupted reconstruction, projections were generated and MSD calculated by comparing the constructed projections with both the motion-free and reori-ented projections. MSD was averaged for all projection angles. The ratio of MSD for the reoriented versus motion-free projec-tions was calculated for the range of orientaprojec-tions.
B. Identification of Wrongly Oriented Projections
The same phantom was used to further evaluate the method, in particular to assess performance in the presence of noise. Again one-dimensional reorientations were examined: 1.5-pixel translations in the and directions and 3 rotations about the -and -axes. In all cases, the reoriented projections were pairs 10–15 (projections 10–15 and 26–31) of 64 projections. It was assumed that the response for the and degrees-of-freedom could be considered equivalent. Noise levels representing 1 and 2 clinical noise were incorporated into the projection data, using 50 thousand counts per projection as typical of clinical brain SPECT.
filter [full width half maximum (FWHM) of 2.5 pixels] was applied to the measured and constructed projection data prior to the similarity calculation. Results were generated for the 3 rotation ( -axis) case only.
C. Identification of Object Orientation
The objective of the proposed algorithm is not only to iden-tify where movement has occurred but also to determine the ob-ject position that coincides with the orientation at which these projections were acquired. Provided that the similarity measure used is “well behaved,” it should clearly identify the optimum orientation. The behavior was tested as follows.
The motion-corrupted estimate was progressively reoriented (same single dimension as the introduced corrupting motion). At each orientation, the degree of similarity between the measured and constructed projection pairs was calculated using MSD (as above). For those projection pairs that were misaligned, plots of MSD as a function of reconstruction orientation were assessed to determine the presence and location of a minimum. This min-imum describes the ability of the algorithm to correctly identify the object orientation corresponding to reoriented projections. The influence of Gaussian smoothing was assessed for each of the one-dimensional reorientations (Fig. 5 and Table III).
D. Continuous Versus Stepwise Motion
In reality, the patient cannot be assumed to occupy a single fixed position in each projection, but rather movement is likely to be continuous during acquisition. Continuous motion within a projection was simulated by gradually increasing the degree of movement and averaging the multiple projections that were generated. This was done for three cases of rotation about the -axis. In each case, the mean rotation for the projection was 3 but the range of movement was varied: a) 2 to 4 in nine steps, b) 1 to 5 in nine steps, and c) 0 to 6 in thirteen steps. The simulated motion represented a linearly changing rotation with time in the projection (although it could be equally representa-tive of more complex motion). This was achieved by giving an equal weighting to each component projection in the average.
To compare the influence of motion independent of any con-sequential corruption of the reconstruction, a motion-free re-construction was reoriented and used to generate projections for comparison with the motion-corrupted projections.
E. Preliminary Validation
A preliminary validation of the complete motion correction algorithm was performed using the Hoffman brain phantom. Projections were generated from the reoriented phantom using 2 pixels, 1 pixel, and 2 pixels for and translations respectively, and 4 , 2 , and 4 for and rotations, respectively. Twelve projection pairs were selected from this re-oriented dataset and substituted into the original motion-free set of projections before introducing a clinical level of noise into the mixed projection data. Motion-free data at the same level of noise were reconstructed using OSEM with subset size of four (one iteration) as a reference. The motion-corrupted pro-jection data were reconstructed under the same conditions. The proposed motion correction algorithm was applied as follows.
a) Constructed projections (attenuated) were generated from the motion-corrupted reconstruction by forward
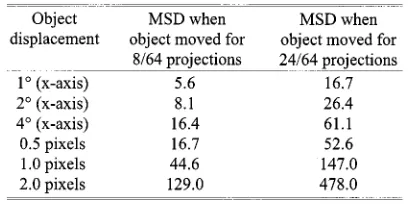
projec-TABLE I
MSD BETWEENCORRUPTED ANDMOTION-FREERECONSTRUCTIONS
TABLE II
RATIO OFMSD BETWEEN THECONSTRUCTED ANDREORIENTEDPROJECTIONS ANDMSD BETWEENCONSTRUCTED ANDMOTION-FREEPROJECTIONS
tion. The MSD between each pair of constructed and “measured” projections was calculated and used to iden-tify misaligned projection pairs. Smoothing of projections was not used.
b) All nonmisaligned projection pairs identified via a) were reconstructed using OSEM with a subset size of four (one iteration). We refer to the reconstruction utilizing only those projection pairs that were found to be consistent as a partial reconstruction.
c) Starting with the projection pair that resulted in the highest MSD [in a)], the orientation of the partial reconstruction estimate was optimized so as to minimize the MSD be-tween the constructed and measured projections for this pair (using 200 iterations of the simplex algorithm). At each iteration, both emission and attenuation data were reoriented.
d) The (optimally) reoriented partial reconstruction estimate can be updated with this projection pair using a single subiteration OSEM. However, in our case, the current op-timized orientation was sufficient for all remaining mis-aligned projection pairs. These were incorporated into the reconstruction using six subiterations of four projections. This produced the motion-corrected reconstruction. Both the motion-free and motion-corrupted reconstructions were transformed to the same orientation as the motion-cor-rected reconstruction and the MSD between the motion-free reconstruction and both the motion-corrupted and motion-cor-rected reconstructions calculated.
IV. RESULTS
A. Demonstration of Feasibility
(a) (b)
(c) (d)
Fig. 2. MSD between constructed and original projection pairs plotted as a function of projection pair number for four different misalignments: (a) a 1.5-pixelx-axis translation; (b) a 1.5-pixel z-axis translation; (c) a 3 x-axis rotation; and (d) a 3 z-axis rotation. In each case, projection pairs 10–15 have been misaligned. Curves are shown for no noise (thick unbroken line),21 clinical noise (unbroken line), and22 clinical noise (broken line).
magnitude of reorientation and is sizeable for large translations (Table I). Despite the sizeable corruption in the reconstruction, correctly oriented projections are well differentiated from mis-aligned projections (Table II). In general, this ability to identify projections was independent of the degree of distortion (com-pare results for 8/64 versus 24/64 reoriented projections).
B. Identification of Wrongly Oriented Projections
Results illustrating the ability to differentiate misaligned from unmoved (correctly aligned) projection pairs are shown in Fig. 2 for the four motion-simulated data sets. The horizontal axes show 32 projection pairs (orthogonal projections) and the ver-tical axes represent the MSD between original and constructed projection pairs. The feasibility of using the original and con-structed projections to distinguish motion-affected projection pairs from unmoved pairs is demonstrated by the presence of peaks in the MSD corresponding to misaligned projections. The differences in peak height, and to a lesser extent curve shape, across the four plots indicate that the type of misalignment had a measurable influence on the ability to detect the misaligned projections.
Two effects of adding noise to the data are demonstrated. First, the curves are offset by an increasing amount that is ap-proximately constant across all angles for a particular noise level. This bias in MSD is much larger than the random variation introduced into the curves themselves. For the translational and -axis rotational misalignments, the peak averages are signifi-cantly different from the baseline average at the clinical noise
level . Only in the case of the 3 -axis rotation
(a) (b)
Fig. 3. MSD versus projection pair for the case of 3 x-axis rotation, illustrating the effect of smoothing the original and constructed projections prior to the MSD calculation. This is shown for the case of (a)21 clinical noise and (b)22 clinical noise.
(a) (b)
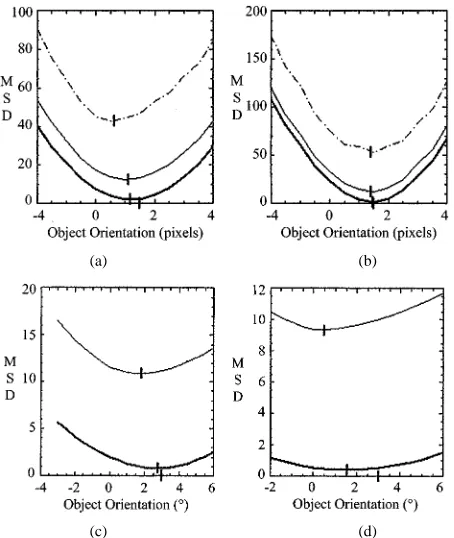
(c) (d)
Fig. 4. MSD between one of the misaligned original projection pairs and its corresponding constructed projection pair, plotted as a function of the reconstructed object orientation. This is shown for the four different misalignments: (a) a 1.5-pixel x-axis translation; (b) a 1.5-pixel z-axis translation; (c) a 3 x-axis rotation; and (d) a 3 z-axis rotation. Curves are shown for no noise (thick unbroken line),21 clinical noise (unbroken line), and22 clinical noise (broken line).
[Fig. 2(d)] did variability between projection pairs due to clin-ical noise (thin line) conceal the peak that was visible in the noiseless case (thick line).
Fig. 3 demonstrates that Gaussian smoothing of both the orig-inal and constructed projections significantly reduces the effects of noise (both random variation and bias) in the case of -ro-tation. For clinical noise [Fig. 3(a)], smoothing resulted in the MSD of all misaligned pairs becoming distinct from the base-line. For twice clinical noise [Fig. 3(a)], smoothing resulted in an identifiable peak that was previously concealed .
C. Identification of Object Orientation
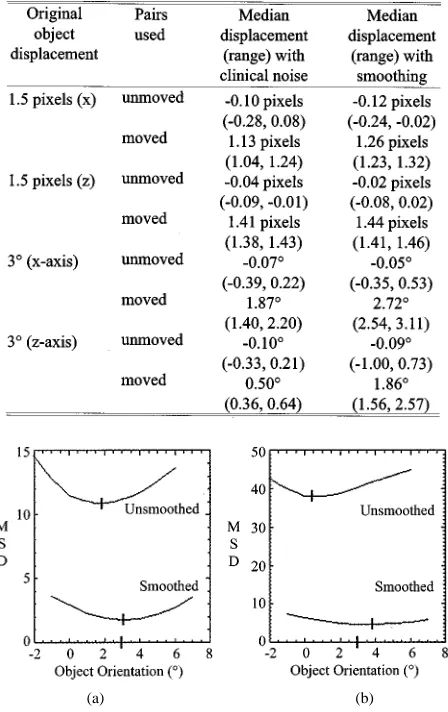
TABLE III
OBJECTDISPLACEMENTTHATRESULTS IN THEMINIMUMMSD BETWEEN
CONSTRUCTED ANDMEASUREDPROJECTIONS
(a) (b)
Fig. 5. MSD versus object orientation for the case of 3 x-axis rotation, illustrating the effect of smoothing the original and constructed projections prior to the MSD calculation. This is shown for the case of (a)21 clinical noise and (b)22 clinical noise.
axis in this case represents the set of discrete orientations used to investigate the similarity measure. In the cases tested, a single minimum MSD was clearly identified with no obvious local minimum. This behavior was preserved even when noisy data were used. Qualitatively, the curves were more shallow for ro-tation compared to translation. Vertical bars on the plots indicate the minimum found for each of the four orientations. Bars are also shown on the horizontal axis at the actual magnitude of the applied misalignment. The concordance between the extracted and actual misalignments was highest for the -axis translation [Fig. 4(b)]: 1.44 pixels for noiseless data and 1.39 pixels for both 1 clinical noise (thin unbroken line) and 2 clinical noise (thick unbroken line), compared with the applied translation of 1.5 pixels. The performance was worse for the -axis translation [Fig. 4(a)], though the estimated value was still in excess of 1 pixel (1.08) for clinical noise. Extracted values for the 3 -axis [Fig. 4(c)] and -axis [Fig. 4(d)] rotations in the clinical noise case were 1.87 and 0.53 , respectively. Results varied for the different affected projections, as summarized in Table III.
The result of smoothing projections is presented in Fig. 5 for the case of 3 -axis rotation. Smoothing resulted in a shift
Fig. 6. Plots of MSD versus orientation of the reconstructed object for various continuous rotational misalignments about thex-axis. The mean rotation in each case was 3 and the range of rotations about this mean was varied (see figure legend). All rotations were simulated to be linearly changing with time during the projection. Data shown included a clinical level of noise.
of the extracted minima closer to the applied misalignment: 3.08 for 1 clinical noise [Fig. 5(a)] and 3.88 for 2 clinical noise [Fig. 5(b)]. Results for the other displacements are sum-marized in Table III. Even for 3 -axis rotation, a minimum was identified in the range 1.16–2.04 for 1 clinical noise with smoothing.
D. Continuous Versus Stepwise Motion
Results showing the ability to correct projection pairs mis-aligned by “continuous” -axis rotation (with increasing range about a fixed mean of 3 ) are presented in Fig. 6. Irrespective of the range of rotation, the curve shapes were similar and the ex-tracted minima (shown by vertical bars) were clustered close to the mean rotation of 3 . This suggests that even with significant movement during projections, the average position of the object is identified. Incorporation of projections at the average object position should minimize the effects of movement, although this needs verification.
E. Preliminary Validation
(a) (b) (c)
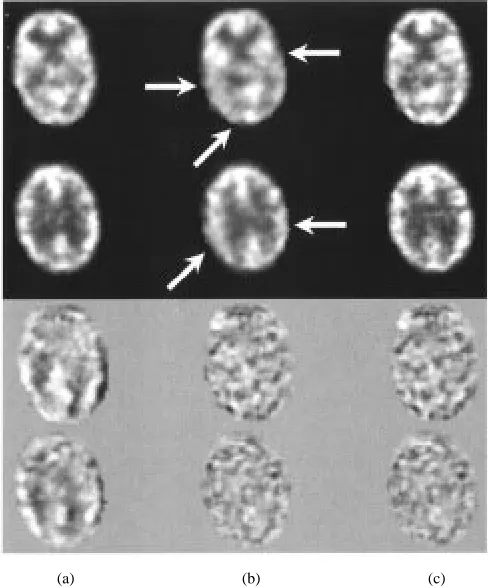
Fig. 7. The top two rows illustrate reconstructions for (a) motion-free data, (b) motion-corrupted data, and (c) motion-corrected data. In the bottom two rows are (a) motion-free minus motion-corrupted, (b) motion-free minus motion-corrected, and (c) motion-free minus the “ideal” motion-corrected. Arrows indicate areas of apparent reduction in perfusion due to motion that are improved after motion correction.
right). This is the difference between an ideally corrected re-construction that incorporates data at the correct position and orientation and the rotated motion-free reconstruction. The mo-tion-corrected result (lower middle) is similar to the ideal result, with both demonstrating some low-level differences that cannot be accounted for by noise alone. Residual differences between motion-corrected and motion-free data may have been further reduced with additional OSEM iterations.
V. DISCUSSION
In this paper, we present a new algorithm that permits data-driven correction for changes in patient position during emission tomography acquisition. The algorithm combines 3-D registra-tion with a method for sequentially updating the 3-D reconstruc-tion to include misaligned projecreconstruc-tions at the correct orientareconstruc-tion. The feasibility of the technique has been demonstrated and the algorithm was used to reduce the distortion due to a complex motion. These early findings are very promising; however, con-siderable additional work is necessary to fully explore the ap-plicability of the technique.
Some insights to the technique are presented. The ability to identify translated projections appears to be relatively insensi-tive to noise, presumably due to the large differences found in projections compared to noise. This is not the case for rotation, especially around the -axis, where reorientation was hard to
identify, even using the two orthogonal views. However, distor-tion in the reconstrucdistor-tion due to this rotadistor-tion was also relatively small, and therefore it appears less critical that this particular motion is exactly corrected. This will require verification for other movements and activity distributions.
There clearly are other factors that require further investi-gation. The corrupted initial reconstruction that incorporates wrongly positioned projections must be used to differentiate be-tween correctly aligned and misaligned projections. However, it may be preferable to utilize only projections that are identified as correctly located in the initial estimate for reconstruction, building on this reconstruction as projections are reoriented (as was implemented in the case of the preliminary validation study). This needs more detailed analysis, as constructed projections are likely to be inaccurate below some lower limit in the number of projections (hence iterations) included in the reconstruction.
Throughout the work presented in this paper, attenuation cor-rection was included in the reconstruction and, consequently, the construction of projections also incorporated attenuation in the forward projection. The attenuation map was reoriented throughout the process to maintain its correspondence with the emission data, and therefore misregistration should be no worse than in the motion-free case. In effect, it is not necessary to include attenuation in the motion detection algorithm; provided the reconstructed estimate is not corrected for attenuation, forward projection without attenuation should still provide a match for correctly aligned projections. In this case, attenuation correction can be applied to the final reconstruction. This has the potential to significantly improve the processing time for the motion-correction component of the algorithm. Work is in progress to further assess the need for attenuation in the algorithm.
The cost function used in this paper was the mean squared difference between constructed and original (measured) projec-tions. Previous study of cost functions applicable to intrasubject SPECT registration demonstrated that this was preferable to al-ternative cost functions [15]. The simplex algorithm was used to find the “best” orientation so as to minimize the cost function. This may not be optimal in terms of speed or susceptibility to local minima; however, alternatives have not yet been explored. The changes in patient position defined the grouping and or-dering of projections rather than any considerations of main-taining subset balance that may be required by OSEM. Certainly for the dual-head geometry assumed in this paper a subset size of two is suggested, smaller than normally recommended for OSEM (although in most cases projection pairs can be grouped into larger subsets). This may be cause for concern, although there is no theoretical reason why the rescaled block iterative (RBI) algorithm [16] could not be used in place of OSEM. The RBI approach is not limited by subset imbalance such as may occur with two orthogonal views. As an alternative, when the correct orientation of all projections is known, a general 3-D re-construction could be performed.
VI. CONCLUSION
A hybrid 3-D reconstruction/registration technique is pre-sented that corrects for changes of patient position during emission tomography acquisition. There is considerable scope for additional work to identify the limits of applicability of the technique, likely to be influenced by the magnitude and timing of motion and the underlying activity distribution. However, these preliminary results demonstrate that the proposed algo-rithm shows considerable promise as an automated data-driven motion-correction technique.
REFERENCES
[1] M. V. Green, J. Seidel, S. D. Stein, T. E. Tedder, and K. M. Kempner, “Head movement in normal subjects during simulated PET brain imaging with and without head restraint,” J. Nucl. Med., vol. 35, pp. 1538–1546, 1994.
[2] M. E. Daube-Witherspoon, Y. C. Yan, M. V. Green, R. E. Carson, K. M. Kempner, and P. Herscovitch, “Correction for motion distortion in PET by dynamic monitoring of patient position,” J. Nucl. Med., vol. 31, p. 816 (abs), 1990.
[3] Y. Picard and C. J. Thompson, “Digitized video subject positioning and surveillance system for PET,” IEEE Trans. Med. Imag., vol. 16, pp. 137–144, 1997.
[4] B. J. Lopresti, A. Russo, W. F. Jones, T. Fisher, D. G. Crouch, D. A. Al-tenburger, and D. W. Townsend, “Implementation and performance of an optical motion tracking system for high resolution brain PET imaging,” in Proc. 1998 IEEE Nuclear Science Symp. Medical Imaging Conf., E. J. Hoffman, Ed., 1999, vol. II, pp. 1127–1131.
[5] S. R. Goldstein, M. E. Daube-Witherspoon, M. V. Green, and A. Eidsath, “A head motion measurement system suitable for emission computed tomography,” IEEE Trans. Nucl. Sci., vol. 16, pp. 17–27, 1997. [6] R. R. Fulton, S. Eberl, S. R. Meikle, B. F. Hutton, and M. Braun, “A
practical 3D tomographic method for correcting patient head motion in clinical SPECT,” IEEE Trans. Nucl. Sci., vol. 46, pp. 667–672, 1999. [7] M. Menke, M. S. Atkins, and K. R. Buckley, “Compensation methods
for head motion detected during PET imaging,” IEEE Trans. Nucl. Sci., vol. 43, pp. 310–317, 1996.
[8] R. R. Fulton, B. F. Hutton, M. Braun, B. Ardekani, and R. Larkin, “Use of 3D reconstruction to correct for patient motion in SPECT,” Phys. Med. Biol., vol. 39, pp. 563–574, 1994.
[9] J. Li, R. J. Jaszczak, and R. E. Coleman, “A filtered backprojection algo-rithm for axial head motion correction in fan-beam SPECT,” Phys. Med. Biol., vol. 40, pp. 2053–2063, 1995.
[10] L. K. Arata, P. H. Pretorius, and M. A. King, “Correction of organ motion in SPECT using reprojection data,” in Proc. 1995 IEEE Nuclear Science Symp. Medical Imaging Conf., 1996, pp. 1456–1460.
[11] K. J. Lee and D. C. Barber, “Use of forward projection to correct for patient motion during SPECT imaging,” Phys. Med. Biol., vol. 43, pp. 171–187, 1998.
[12] G. Germano, P. B. Kavanagh, H. Kiat, K. Van Train, and D. S. Berman, “Temporal image fractionation: Rejection of motion artifacts in myocar-dial SPECT,” J. Nucl. Med., vol. 35, pp. 1193–1197, 1994.
[13] A. J. Britten, F. Jamali, J. N. Gane, and A. E. A. Joseph, “Motion de-tection and correction using multi-rotation 180 single-photon emission tomography for thallium myocardial imaging,” Eur. J. Nucl. Med., vol. 25, pp. 1524–1530, 1998.
[14] H. M. Hudson and R. S. Larkin, “Accelerated image reconstruction using ordered subsets of projection data,” IEEE Trans. Med. Imaging, vol. 13, pp. 601–609, 1994.
[15] S. Eberl, I. Kanno, R. R. Fulton, A. Ryan, B. F. Hutton, and M. J. Fulham, “Automated interstudy image registration technique for SPECT and PET,” J. Nucl. Med., vol. 37, pp. 137–145, 1996. [16] C. L. Byrne, “Accelerating the EMML algorithm and related iterative