Large Graph mining Approach for Cluster
Analysis to Identify Critical Components
within the Water Distribution System
S.V.S.Santhi#1, Poosapati Padmaja*2#
Research Scholar, Department of Information Technology, GITAM University, Visakhapatnam, India.
*
Associate Professor, Department of Information Technology, GITAM University, Visakhapatnam, India.
Abstract
—
Clustering of large graphs can be categorized into two ways, topological and attributed clustering. Clusters based on connectivity criteria is topological clustering and by considering node or edge properties/attributes is known as attributed clustering. There exists many graph clustering algorithms that mainly focus on the topological structure for clustering but these approaches ignore the vertex properties if any in a given network. In large graph application like WDS, it becomes necessary to consider the node/junction properties and edge/pipe properties for identification of the crucial components in a community. Hence in this paper authors suggest an approach that considers both the vertex and edge properties. WDSs are networks with both topological and behavioural complexity. There by it is usually difficult to identify the most critical components within the system for a given purpose of design and control. Further it becomes highly expensive to design such large WDS. Hence in this paper we propose to construct a WDS with minimum cost by constructing minimum spanning tree(MST). MSTs have been frequently used in data mining and machine learning. However it is difficult to apply traditional MST's to large datasets/graphs. So we suggest to divide the large graph into sub graphs and construct MST for each sub graph. All the MSTs are then combined to form a single refined MST using structural properties. The refined MST is clustered by considering the attributes of the node properties like node id, elevation, demand, head, pressure etc., and attributes of the link properties like link id, diameter, roughness, flow, velocity etc.,. Clustering results obtained based on the nodes or junctions are useful for identification of critical components of junctions whereas clustering results obtained based on the links or pipes are useful for identification of pipe problems which helps for an efficient maintenance of WDS with minimum time and cost. Thus the suggested clustering approach reduces the leakages and thereby improving the water quality. Experimental results show that the proposed approach performed well and found to fit to the expected results for both synthetic data and real world data.Keywords
—
Minimum spanning tree, Clustering, k-means clustering, K-spanning clustering.I. INTRODUCTION
Graphs are structures formed by set of vertices and set of edges that are connections between pairs of vertices. A graph is a tuple G=(V,E,∑, L) where V is a set of vertices, E V x V is a set of edges, ∑ is a set of labels and L: V U E →∑ is a function assigning labels to vertices and edges. The size of the graph is |E(G)| i.e., the number of edges it
contains. A graph becomes 'large' when the amount of data becomes 'big'. Applications of large infrastructure networks include urban roads, rail networks, power grid, gas pipe line networks, water distribution networks etc., In this paper Water Distribution System is taken as a real world application for large graph mining.
With the continuous development of social economy, the demand for the water supply is increased drastically. To meet the requirements and also solve the economic problems in laying pipelines , minimum spanning tree is needed to be implemented.
A Minimum Spanning Tree is an acyclic subgraph of a graph G, which contains all vertices from G. Let G=(V,E) be an undirected connected graph. A sub graph T=(V',E') of G is a spanning tree of G iff T is a tree where there are no cycles. It covers all the vertices V and contains |V|-1 edges. A single graph can have many different spanning trees. A minimum cost spanning tree is a spanning tree which has a minimum total cost. Addition of even one single edge results in the spanning tree losing its property of acyclicity and removal of one single edge results in its loosing the property of connectivity. The length of a tree is equal to the sum of the length of the arcs on the tree. If each edge has a distinct weight then there will be only one unique minimum spanning tree. By applying MST, the cost of the network can be reduced. Few of the existing algorithms for finding MST are Kruskal’s and Prime's algorithms.
Clustering is the process of partitioning or grouping a given set of patterns into disjoint clusters. Cluster analysis groups data objects based only on information found in data that describes the objects and their relationships. This is done such that patterns in the same cluster are alike and patterns belonging to two different clusters are different. Clustering has been a widely studied problem in a variety of application domains like neural networks, AI, and statistics. In general, Clustering is of Partitioning and Hierarchical Clustering. In Hierarchical Clustering, a set of nested clusters are organized as a hierarchical tree. Whereas in Partitioning Clustering, division of data objects into non-overlapping subsets or clusters is done such that each data object is in exactly one subset. K-means algorithm is a partitional clustering approach. . The k-means method has been shown to be effective in producing good clustering results for many practical applications. K-Means Clustering is an algorithm used to classify or to group the objects based on attributes/features into K number of groups. K is positive integer number. The grouping is done by minimizing the sum of squares of distances between data and the corresponding cluster centroid. Each cluster is associated with a centroid and each point is assigned to the cluster with the closest centroid. The number of clusters, K, must be specified.
In graph clustering, k-spanning tree clustering is one of the regularly used minimum spanning tree based clustering approach. In k-spanning tree clustering, MST for the graph is obtained and the k-1 edges from the MST are removed which results in k clusters with non overlapping vertices.
II. RELATED WORK
The studies on constructing an exact MST starts with Boruka’s algorithm (1926), similar algorithm invented by G.Choquet (1938), K. Florek (1951), M. Sollin (1965) respectively. One of the most popular prim’s algorithm, was proposed by Jornik (1930), Prim (1957), and Dijkstra (1959) which selects a vertex as a tree and then repeatedly adds the shortest edge that connects a new vertex to the tree, until all the vertices are included. Kruskal’s algorithm (1956) is another widely used exact MST algorithm, in which all the edges are sorted by their weights in an increasing order. It starts with each vertex being a tree, and iteratively combines the tree by adding edges in the sorted order excluding those leading to a cycle, until all the trees are combined into one tree.
J.C. Gower and G.J.S. Ross(1969) proposed, two hierarchical clustering algorithms which first employed to Minimum spanning trees and single linkage cluster analysis. Guan-Wei Wang et.al(2014), proposed most popular MST-based clustering algorithm, MST-based on identifying inconsistent edges. Y. He and L. Chen(2005), proposed a threshold criterion, auto-detection and its use in MST-based clustering. P. Foggia et.al(2007), proposed a graph-based clustering method and its applications using Fuzzy C-means clustering algorithm to obtain two clusters of the edges of an MST. The edges with small weights in a cluster will be preserved while those belonging to the other cluster will be
removed from the MST. Y.J. Li(2007), proposed a clustering algorithm based on maximal theta-distant sub trees.
Shvartser L., et.al (1993),explained about the Forecasting hourly water demands by pattern recognition approach. Zhou S.L., et.al (2002), explained about the Forecasting operational demand for an urban water supply zone. . Preis, A. et.al (2010), proposed ,on-line hydraulic modelling of a Water Distribution System to identify the demand zones (i.e., clusters of water consumers) within the complex topology of the urban water supply system. Puust, R., et.al (2010), explained about the methods for leakage management in pipe networks. Herrera M., et.al (2010), proposed Predictive models for forecasting hourly urban water demand. Herrera, A.M., (2011), explained about Improving water network management by efficient division into supply clusters. Candelieri, A., et.al (2012), proposed , Clustering-based Services for Supporting Water Distribution Networks Management by implementing partition of the network into independent sub-sectors to perform district identification and leak localization on pipelines according to flow and pressure values continuously measured at crucial points of the network. Candelieri, A., et.al (2012), proposed, the application of data analytics approaches on flow and pressure data, continuously measured at crucial points of the network, for improving efficiency of leak localization and to reduce time and costs for physical check and consequent rehabilitation activities. Gutierrez-Perez, J., et.al (2012), proposed an approach as a support to the vulnerability analysis of Water Supply Networks (WSNs). The method is based on graph measurements such as the relative importance (ranking) and the degree of the vertices of a graph. Herrera M., et.al (2012), proposed an approach for Combining multiple perspectives on clustering: Node-pipe case in hydraulic sectorization.
Weighting k-Means Algorithm for Subspace Clustering of High-Dimensional Sparse Data which is a new k-means algorithm for clustering high-dimensional objects in sub-spaces. In high-dimensional data, clusters of objects often exist in subspaces rather than in the entire space
In this paper, we propose an algorithm for finding refined or final MST for a large water distribution network and also finding clusters for the refined MST. For finding the refined MST of WDS , we have considered the features of Zhong Caiming algorithm for finding minimum spanning tree and for finding clusters for MST, we have considered the features of K-means clustering algorithm and applied them for real world data of Water distribution Network .
The rest of the paper is organized as follows. In section 3, the proposed approach is presented and explained using synthetic data . In section 4, Experimental results and analysis on real world Water Distribution Network is discussed. Finally, we conclude the work in section 5.
III. METHODOLOGY
The proposed approach consists of mainly three phases. In I, partitioning of the large graph, In phase-II, constructing Final or Refined MST for the large graph. In phase-III , minimum spanning tree based clustering using K- means for k- clusters. Block diagram of the proposed method is shown in Figure.1.
Fig. 1 Block Diagram of the proposed Approach.
Phase-I : Partitioning of the large graph
Large graph is partitioned into subgraphs or partitions using Girvan Newman approach, which is based on the betweenness centrality . Using Newman approach, edge betweenness of edges of the graph is calculated. The process of calculation of edge betweenness and removing the edge with highest betweenness is repeated until there is no edge remaining. The number of clusters k is set to N as a thumb rule (J.C.Bezdek and N.R.Pal (1998), M.R.Rezace et.al., 1998), where N is the number of nodes in a graph. Each cluster obtained can be considered as subgraph or partition.
Phase-II : Finding the Final or Refined MST for large
graph
MST for each subgraph is constructed by using Kruskal's algorithm. Using this the edges are added in the
sorted order excluding those leading to a cycle, until all the edges are combined into one tree. MST of each subgraph is combined by finding the appropriate connecting edge from the set of connecting edges. For identifying the correct connecting edge between subgraphs, the centre of subgraph is found by determining the mean values of one of the edge parameters like edge weights. Thus the MST for the centre points is determined and is named as MSTcentre . The edges
of the MSTcentre are assigned as the connecting edges for
the subgraphs. The resulting MST named as approximate MST1. Considering the midpoints of edges of MSTcentre as
reference points the input graph is partitioned into k-1 subgraphs. The rest of the process of constriction of approximate MST2 is same as the construction of approximate MST1. The two graphs, approximate MST1 as in Figure.3(a) and approximate MST2 as in Figure.4(a) are combined to get the merged graph as shown in Figure.4(b). The final MST for the merged graph is found, and is named as MSTfinal. . Thus the resultant reduced graph
obtained from the input graph is MSTfinal .
Phase-III : Finding k-clusters for the Final or Refined MST Dividing the final MSTinto subgraphs or clusters using K-means produces effective clusters for practical applications like Water Distribution Network. For K-means clustering, initially determine number of cluster K and assuming the centroid or center of these clusters. The number of clusters K is set to N as a thumb rule (J.C.Bezdek and N.R.Pal (1998), M.R.Rezace et.al., 1998), where N is the number of nodes in a graph. We can take any random objects as the initial centroids or the first K objects can also serve as the initial centroids. Then the K means algorithm will do the three steps below
Iterate until no object moves from the group 1. Determine the centroid coordinate
2. Determine the distance of each object to the centroids 3. Group the object based on minimum distance by finding the closest centroid.
Algorithm for the proposed approach: Input: Large Graph.
Output: Clustering results for Final MST
Step1:Divide the graph into k clusters or subgraphs using Girvan Newman algorithm for community detection. Step 2: Find the MST for each subgraph using Kruskal's algorithm.
Step 3: Find the Approximate MST-1 for the input graph. Step 3.1: Find the centres of each cluster.
Step 3.2: Join the centres of each cluster. Step 3.3: Find the MSTcentre .
Step 3.4: Assign the nearest edge values to the edges of MSTcentres .
Step 3.5:Consider these edges for connecting the clusters or subgraphs.
Step 4: Find the Approximate MST-2 for the input graph. Step4.1: Divide the input graph into k-1 clusters and repeat the steps 2 and 3.
Step 5: Combine the approximate MST-1 and approximate MST-2 to get the merged graph.
Step 7: Get the Final MST , MSTfinal .
Step 8: Applying the K-means clustering algorithm on MSTfinal by considering node/edge properties.
Step 9: Get the clusters as output.
IV. EXPERIMENTAL RESULTS AND ANALYSIS ON
REALWORLD DATA(WDS)
In this section, we present the experimental results on real world water distribution network of Balgaon, Parvathipuram in Andhra Pradesh as shown in Figure.2(a) . The distribution system is subjected to 60 junctions and 72 links which is having a reservoir of capacity 227 Kilo Liters. In this network the junction parameters are node id, elevation, head, demand, base demand, pressure and link parameters are link id, length, diameter, roughness, flow, velocity, unit head loss, friction factor. In the WDS network the junction represents the nodes and links represent the edges of a graph. In WDS, the node id is considered as junction or node parameter and length as link or edge parameter.
(a)
Fig. 2. (a). Real World Water Distribution Network, (b). WDS with six partitions P1,P2....P6.
The distribution system is subjected to 60 junctions and 72 links which is having a reservoir of
capacity 227 Kilo Liters. In this network the junction parameters are node id, elevation, head, demand, base demand, pressure and link parameters are link id, length, diameter, roughness, flow, velocity, unit head loss, friction factor. In the WDS network the junction represents the nodes and links represent the edges of a graph. In WDS, the node id is considered as junction or node parameter and length as link or edge parameter. The WDS in Figure.2(a), is taken as a large graph which is partitioned into six partitions P1,P2,P3,P4,P5,P6 as in Figure.2(b), using Girvan Newman algorithm. The six partitions with the node ids and the number of nodes present are described in Table.1.
TABLE I
DESCRIPTION OF SIX PARTITIONS OF WDS.
MSTs for each subgraph is constructed by using Kruskal's algorithm and are connected by finding the connected edges of these subgraphs.. Using Kruskal's algorithm, the edges of each partition are sorted and connected to form a tree by avoiding cycle, which is nothing but the construction of MST for each subgraph. The length of each edge is considered as the weight of an edge. The edges of MST of each partition with costs are shown in table2.
TABLE II
DESCRIPTION OF MSTS IN EACH PARTITION
Partition Edges of MST Cost
P1 461-462,462-463,462-64,464-465,464-466,466-467,466-468,
468-470,470-469,470-472,472-471,471-455,455-456,471-474,
474-475,474-473,473-476,476-477,476-478,478-479,478-480,
478-481,481-484,484-482,482-483,451-452,452-453,452-457,
453-454,453-471,453-458,458-459,458-460.
1864
P2 Nil 0
P3 446-447 , 447-448, 448-449 244
P4 426-430, 430 - 444,444 - 443, 444 - 445 336
P5 432-431 136
P6 427-426,426-428,428-415,428-433,433- 434,434-435,435-436,435-437,437-438,437-439,439-440,439-441,441-442
920
Total Cost 3500
The node ids of connecting edges with cost is shown in table.3. Approximate MST1 is constructed by
Partition Number of nodes
Node ids
P1 34 451,452,453,454,455,456,457,458, 459,460,461,462,463,464,465,466, 467,468,469,470,471,472,473,474, 475,476,477,478,479,480,481,482, 483,484
P2 1 450
P3 4 446,447,448,449 P4 5 429,430,443,444,445 P5 2 431,432
identifying the connected edges using MSTcentre as shown in
Figure.3(a) .
TABLE III
DETAILS OF CONNECTING EDGES FOR SIX PARTITIONS. Connecting edges with node
ids Weights
451-447 46 448-450 118 447-445 13 430-431 44 431-433 48
Total cost 269
Fig. 3. (a) Approximate MST1, (b). WDS with 5 clusters.
The cost of Approximate MST1 is sum of edge weights of MSTs in each partition and the weights of connecting edges. Therefore the total cost of Approximate MST1 is 3769(3500(from table.2) + 269(from table.3)). The process of partitioning with k-1 partitions is repeated, which results with five partitions p1, p2, p3, p4, p5 (shown in Table 4) and the connecting edges (shown in table.5) are identified to form approximate MST2 as shown in Figure.3(b).
TABLE IIV
DETAILS OF NODES FOR FIVE PARTITIONS
TABLE V
DETAILS OF CONNECTING EDGES FOR FIVE PARTITIONS Node ids for connecting edge Length
451-447 46 447-448 79 445-444 91 433-428 86
The total cost of MSTs of all partitions p1,p2,...,p5 is 2970 and the total cost of connecting edges is 302. Therefore the cost of Approximate MST2 is 3272.
Fig. 4. (a).Approximate MST2, (b). Merged Graph
Partition Number of nodes Node ids
p1 33
451,452,453,454,455,456,457,458, 459,460,461,462,464,465,466,467, 468,469,470,471,472,473,474,475, 476,477,478,479,480,481,482,483, 484
p2 3 448,450,463
p3 6 441,442,445,446,447,449
p4 8 429,430,431,432,433,439,443,444
Merged graph shown in Figure.4(b) is formed by combining the approximate MST1 and approximate MST2. The cost of merged graph is 3894.
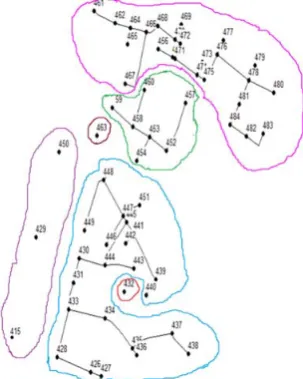
Fig. 5. Final MST
The final MST shown in Figure.5 is formed by finding the MST for the merged graph. To find final MST, the edge weights 98 and 105 of edges 426-434 and 437-439 respectively are removed from the merged graph using Kruskal's algorithm. Thus the cost of final MST is 3691.
The costs of all the MST's are shown in table.5. Since it is observed that the cost of original WDS taken is 5394 where as the cost of the final reduced WDS is 3691. This result shows the efficiency of the proposed approach in finding WDS with minimum cost, the result analysis are shown in table.6.
TABLE VI
DETAILS OF COSTS OF DIFFERENT NETWORKS
Network Cost
Water Distribution Network 5394
Approximate MST1 3769
Approximate MST2 3272
Final MST / Reduced WDS 3691
Applying K-means clustering algorithm on final MST i.e MSTfinal by considering node properties like node
id, elevation, demand, head, pressure etc., and edge properties like link id, length, diameter, roughness, velocity, head loss, friction factor etc.,, the clusters formed are as shown in Figure.6(a),(b). For K-means clustering, initially number of clusters K to be determined and assuming the centroid or centre of these clusters. We can take any
random objects as the initial centroids or the first K objects can also serve as the initial centroids. Then the K means algorithm will determine the centroid coordinate, determine the distance of each object to the centroids and group the object based on minimum distance by finding the closest centroid. This is done iteratively until no object move from the group or subset or cluster. The final MST contains 60 nodes, hence the number of clusters K=6 are considered (K<=N) and the number of links are 59, hence the number of clusters K=6 and the clustering results are shown in Figure.6(a),(b). and table.7.
(a)
(b)
TABLE VII
DETAILS OF NODE IDS IN EACH CLUSTER
TABLE VIII
DETAILS OF EDGE IDS IN EACH CLUSTER Cluster Number of edges Edge ids
C1 19
564,566,568,571,572,573,574,575,577, 579,580,583,584,585,587,588,590,591, 592
C2 2 523,524
C3 1 522
C4 21
527,528,530,536,538,539,540,541,543, 544,547,548,552,553,554,555,556,557, 558,559,560
C5 2 534,578
C6 14 526,529,532,533,535,542,545,546,549,551,563,565,567,569
Applying clustering on nodes/junctions and links/pipes separately for the final MST of WDS network, helps in identifying the location of the problem directly in the network. If the problem is in junctions, node based clustering results are considered otherwise link based clustering results are considered. This helps in identifying the location and the problem immediately with minimum time and there is no need to check the entire WDS network.
Applying k-spanning tree clustering approach for final MST, remove five large weighted edges i.e. large length pipes to form six clusters with non overlapping vertices.
Fig. 7. Clusters based on k-spanning clustering
TABLE IX
DETAILS OF NODE IDS IN EACH CLUSTER FOR K-SPANNING TREE CLUSTERING
Cluster Number of nodes Node ids
C1 25
455,456,461,462,464,465,466, 467,468,469,470,471,472,473, 474,475,476,477,478,479,480, 481,482,483,484,
C2 7 425,453,454,457,458,459,460
C3 1 463
C4 3 415,429,450
C5 1 432
C6 23
426,427,428,430,431,433,434, 435,436,437,438,439,440,441, 442,443,444,445,446,447,448, 449,451
The k-spanning tree clustering approach results for the real world WDS network are not efficient because the clusters C3,C4,C5 are only with nodes and there are no links/pipes connected to the nodes. Hence some pipes are missing. In this approach only length parameter of pipe is considered and the other parameters are ignored.
From the experimental results and analysis, the proposed approach shows an efficient results by considering attributes as node/junction and link/pipe properties than k-spanning clustering. Because all the junctions and pipes are present and no data is missing.
V.CONCLUSION
This study explores the solutions to reduce the topological and behavioural complexities and also for identifying crucial and critical components of WDS by implementing clustering methods to MST. By using this method we can design an efficient and economical WDS for any city or town. This involves finding the refined MST for the large graph and dividing the MST into clusters based on junction and pipe properties. It becomes easy to identify the crucial and critical components of WDS directly by selecting either node/junction or link/pipe based clustering depending on the nature and location of the problem. This improves the efficient maintenance of the WDS by reducing the leakages and to maintain good quality of water. The main objective of this paper is to maintain WDS efficiently with minimum time and cost. Experimental results on synthetic data and real world application WDS shows the efficiency of the proposed approach for dividing the WDS network into MST based clusters.
REFERENCES
[1] C. Zhong, D. Miao, P. Franti, Minimum spanning tree based split-and-merge: a hierarchical clustering method, Inform. Sci. 181 (2011) 3397–3410.
[2] C. Zhong, D. Miao, R. Wang, A graph-theoretical clustering method based on two rounds of minimum spanning trees, Patt. Recog. 43
(2010) 752–766.
[3] C. Zhong, M. Malinen, D. Miao, P. Franti, Fast approximate minimum spanning tree algorithm based on K-means,in:15th International Conference on Computer Analysis of Images and Patterns,York,UK, 2013.
[4] Clauset, A., Newman, M. E. J., and Moore, C. 2004. Finding community structure in very large networks. Phys. Rev. E 70,066111.
Cluster Number of nodes Node ids
C1 9 448,450,451,452,458,461,462,469,484
C2 1 453
C3 12 436,438,439,440,441,442,443,444,445, 446,447,449
C4 12 454,455,456,457,459,460,463,464,465, 466,467,468
C5 14 470,471,472,473,474,475,476,477,478, 479,480,481,482,483
[5] E.W. Dijkstra, A note on two problems in connexion with graphs, Numer. Math. 1 (1959) 269–271.
[6] G. Karypis, E.H. Han, V. Kumar, CHAMELEON: a hierarchical clustering algorithm using dynamic modeling, IEEE Trans. Comput. 32 (1999) 68–75.
[7] J.C.Bezdek, N.R.Pal, Some new indexes of cluster validity, IEEE Trans., syst., Man Cybernet., part B,28(1998), 301-315.
[8] M.R.Rezace, B.P.F. L elieveldt, J.H.C.Reiber, A new cluster validity index for the fuzzy c-mean, patt.recog.lett.19(1998) 237-246.
[9] Ostfeld, A., 2005.Water distribution systems connectivity analysis. Journal of Water Resources Planning and Management Division, ASCE 131 (1), 58e66.
[10] Ostfeld, A., et al., 2008. The battle of the water sensor networks: a design challenge for engineers and algorithms. Journal of Water Resources Planning and Management Division, ASCE 134(6) 556e568.
[11] R. Xu, D. Wunsch II, Survey of clustering algorithms, IEEE Trans. Neural Netw. 16 (2005) 645–678.
[12] R.G. Gallager, P.A. Humblet, P.M. Spira, A distributed algorithm for minimum-weight spanning trees,ACM Trans. Program. Lang. Syst. 5 (1983) 66–77.
[13] ].Schaeffer,S.E.,2007.Graphclustering.ComputerScienceReview1,27 e64.doi:10.1016/j.cosrev.2007.05.01.
[14] Ulanicki, B., Zehnpfund, A., Martinez, F., 1996. Simplification of water distribution network models. In: Proceedings of the Second International Conference on Hydro informatics, pp.493e500. Zurich, Switzerland.
[15] X. Wang, X. Wang, D.M. Wilkes, A divide-and-conquer approach for minimum spanning tree- based clustering, IEEE Trans. Knowl. Data Eng. 21 (2009)945–958.