FTS THESIS 539.73 VAL 30001007295522
VICTORIA I UNIVERSITY
Atomic Beam Techniques in a
R u b i d i u m Vapour Cell
by
Christopher J o h n Vale
Submitted for the degree of
Doctor of Philosophy
School of Communications and Informatics Victoria University of Technology
Australia
W
A B S T R A C T
Atomic Beam Techniques in a Rubidium Vapour Cell
by Christopher John Vale
Principal Supervisor:
Dr. Peter Farrell
This thesis presents a study on the realisation of a usable rubidium atomic beam inside a sealed vapour cell. A velocity selective optical pumping scheme was im-plemented to enable the detection of atoms of a particular velocity class travelling between two separated la^er beams. This represents a new spectroscopic technique, the usefulness of which has been demonstrated through its applications. In the present work, the vapour cell atomic beam has been used to measure Larmor pre-cession of polarised atoms in a magnetic field and one-dimensional laser cooling.
To perform the experiments it was necessary to construct lasers suitable for the measurements. To this end two types of external cavity diode laser were constructed and locked to features of the rubidium D2 line. Once locked the lasers were seen to have short term linewidths of less than 1 MHz and long term stability to within 2 MHz.
These lasers then formed an important part of the optical pumping scheme used to create the vapour ceU atomic beam. One laser was used to label a particular velocity group of atoms while the other detected labelled atoms in another position in the cell. By modulating the labelling, and detecting with a lock-in amplifier, atomic beams with transverse velocity widths of 6 m/s were clearly observed in both «^Rb and »^Rb.
I, Christopher John Vale, declare that the thesis entitled
"Atomic beam techniques in a rubidium vapour cell"
is my own original work, except where specific reference to other authors has been
made, and has not been submitted previously, in whole or part, in respect of any
other academic award.
Signature W I.^V^'^
ACKNOWLEDGMENTS
In the course of my studies I have been very fortunate to receive assistance and support from many people to whom I would like to express my thanks.
Firstly, I would like to thank my supervisor Peter Farrell for his ideas and intu-ition which formed the foundations of this work (he's not a bad bloke either). 1 also wish to thank Robert Scholten for his hospitality and generosity in the Atom Optics laboratory at the University of Melbourne. Many thanks also to Mirek Walkiewicz for help with much of the work described in this thesis and for the loan of a laser.
I would also like to thank the technical staff of the Optical Technology Research Laboratory of Victoria University. In particular, Mark Kivenen and Donald Ermel for their excellent mechanical work on components for the laser systems and Alex Shelamoff for his infallible assistance with many of the electronic circuits constructed for the lasers.
During my postgraduate studies I have made many friends whom have assisted in instances too numerous to mention both in and often out of the lab. I would especially like to thank Scott Wade, Ian Mitchell, Darol Garchev, Mikhail Vasiliev and Greg Baxter for their friendship and support over a number of years. More gen-erally, 1 would like to thank all of the members of the Optical Technology Research Laboratory of Victoria University and Optics Group of the University of Melbourne for making my postgraduate years most enjoyable.
Finally, I would like to thank those who have endured me at my worst over the last few years (don't all put your hands up). My parents Ira and John Vale and ray girlfriend Stacey Williams. Sincerest love and thanks.
C O N T E N T S
1 Introduction 1 2 Laser Diodes 5
2.1 Introduction and review 5 2.2 External Cavity Diode Lasers 9
2.2.1 The Littrow configuration 10 2.2.2 Littman-Metcalf configuration 11 2.3 External cavity laser diodes constructed 12
2.3.1 Macadam Laser 13 2.3.2 Arnold laser 16 2.4 Saturated absorption measurements 18
2.5 Laser Stabilisation Schemes 22 2.5.1 Dichroic-atomic-vapour laser locking 25
2.5.2 AC locking 28
2.6 Conclusions 32
3 The Vapour Cell Atomic B e a m 33
3.1 Review of separated laser beam experiments 33 3.2 Basic Arrangement for VCAB Experiments 35
3.3 VCAB in a rubidium cell 37 3.3.1 Preliminary considerations 38
3.3.2 VCAB in «^Rb 39 3.3.2.1 Atomic velocity groups in the VCAB with both lasers
locked 41 3.3.2.2 Atom velocities in the VCAB when the probe laser
is scanned 43 3.3.2.3 ®^Rb Results 44
3.3.3 VCAB in ^^Rb 46 3.3.4 Comparison of ^^Rb and ^^Rb results 48
3.4 Calculation of the transverse velocity distribution 50
3.5 Discussion 54 3.6 Conclusions 57
4 Observation of Larmor precession 58
4.1 Background and review 58
4.2 Current scheme 63 4.3 Theoretical description 65
4.4 The Larmor precession experiment 68
4.5 Discussion 73 4.5.1 Comparison with other work 74
4.5.2 Possible improvements 75
4.6 Conclusions 77
5 Observation of laser cooling using t h e V C A B 78
5.1 Background 78 5.1.1 Review of laser cooling 79
5.1.2 Spontaneous force 81 5.1.2.1 Spontaneous force in the low intensity limit 83
5.2 Laser coohng of the VCAB 84
5.2.1 Concept 85 5.2.2 Cooling in ^^Rb 87
5.2.3 Cooling in the hn. ± lin. configuration 88
5.2.4 Optical pumping considerations 93
5.3 Experimental conditions 96
5.4 Results 99 5.5 Discussion 103
5.5.1 Comparison with conventional atomic beams 103 5.5.2 Possible improvements to the experimental technique 104
5.6 Conclusions 105
6 Model of the laser cooling experiment 106
6.1 Introduction 106 6.2 Modelled situation 108 6.3 Atoms considered in the model 110
6.3.1 Z-velocity distribution 110 6.3.2 X-velocity distribution 112 6.3.3 y-velocity distribution 112 6.4 Spatial absorption profiles 114 6.5 Cooling in a high intensity laser field 115
6.5.1 The cooling force 118 6.5.2 Atomic velocities through the cooling laser 119
6.5.3 Number of atoms in the VCAB 121
6.6 Results 122 6.7 Comparison of Experiment and Theory 122
6.8 Discussion 128 6.9 Conclusion 130
7 Conclusions 131 A Temperature control circuit 142
B Laser locking circuit 144 C Time evolution of a J = | state in a B field 146
LIST OF FIGURES
2.1 Littrow configuration external cavity laser diode 10 2.2 Littman-Metcalf configuration external cavity laser diode 12
2.3 Schematic diagram of the first ECLD 14 2.4 Schematic diagram of the second ECLD 17 2.5 Experimental arrangement for saturated absorption spectroscopy . . . 20
2.6 Saturated absorption scans for ®^Rb 23 2.7 Saturated absorption scans for ^^Rb 24 2.8 Experimental arrangement for DAVLL locking 26
2.9 Dispersion signal for DAVLL locking 28 2.10 Experimental arrangement for AC locking 30
2.11 Dispersion signal for AC locking 31 3.1 Experimental arrangement for observation of a vapour cell atomic beam 36
3.2 The vapour cell atomic beam 38 3.3 Partial energy level diagram of ^^Rb 40
3.4 Atomic trajectories excited by the pump and probe lasers 43
3.5 Plot of VCAB signal vs probe laser detuning 45
3.6 Partial energy level diagram of ^^Rb 47 3.7 Plot of VCAB signal vs. probe laser detuning 49
3.8 Plot of the spatial intensity profiles of the chopped and probe lasers . 51
3.9 Transverse velocity distribution of atoms in the VCAB 53 4.1 Basic arrangement of the Larmor precession measurement 64 4.2 Partial energy level diagram of ^^Rb showing the hyperfine transitions
of the chopped and probe lasers 64 4.3 Calculated magnetic moment of atoms after travelling from the
chopped laser to the probe 67 4.4 Experimental arrangement used to observe Larmor precession . . . . 69
4.5 Normalised lock-in amplifier signal as a function of applied magnetic
field 70 4.6 Plots of the experimental and theoretical Larmor precession signals . 72
5.1 Spontaneous force on a two-level atom in a low intensity standing wave 84
5.2 Principle of the laser cooling measurement 86 5.3 Partial energy level diagram of ®^Rb showing the role of the coohng,
chopped and probe lasers 87 5.4 Plot showing the direction of polarisation of light for two
counter-propagating beams in the lin _L lin configuration 89 5.5 Energy level diagram for a J = ^ to J = I transition 90 5.6 Lightshift of a J = ^ ground state in a lin ± lin light field 91
5.7 Experimental arrangement used to observe laser cooling of the VCAB 96
5.8 End view of the vapour cell showing the positions of the three lasers 97
5.9 Spatial intensity profile of the coohng laser 98 5.10 Measured Lock-in amplifier signal as a function of cooling laser detuninglOO
5.11 Peak to peak deviations of the cooled signal relative to the reference
level 102 6.1 Spatial intensity profiles of the two dimensional gaussians used in the
calculations 109 6.2 Initial 2;-velocity distribution of atoms I l l
6.3 Positions of the three laser spots when the cell is viewed end on . . . 113 6.4 Intensity and absorption profiles of the chopped and probe lasers . . . 116 6.5 Spontaneous force on a two-level atom in a high intensity standing
wave 119 6.6 Predicted velocity distribution of atoms emerging from the cooling laserl21
6.7 Theoretical plot showing the effect of the cooling laser on the VCAB
signal 123 6.8 Plots of the experimental and theoretical results for the laser cooling
experiment 125 6.9 Plots of the experimental and theoretical results for the laser cooling
experiment 126 6.10 Scaling factors used in fitting the theoretical to experimental results . 128
6.11 Offsets used in fitting the theoretical to experimental results 129
A.l Schematic of the ECLD temperature control circuit 143
Chapter 1
INTRODUCTION
Atomic beams are extremely useful for performing many types of high resolution atomic physics experiments [1, 2]. An atomic beam is simply a stream of atoms travelling in a well defined direction. The atoms originate from a source, usually an oven, which has a small aperture through which the atoms escape. Typically a second aperture, at some distance downstream, allows only those atoms travelling in the required direction to pass through into a vacuum chamber, forming a coUimated beam in the chamber.
Atomic beams have successfully been used to study many interesting physical phenomena. These include atomic collisions, high resolution spectroscopy, atomic clocks, and laser cooling [1]. Two of the most attractive features of atomic beams are their high flux and high degree of coUimation. For experiments with alkali metals, beam sources usually consist of an oven operated at high temperature (eg. 200°C for rubidium ovens) so that the vapour pressure inside the oven will also be high, resulting in a high density of atoms in the beam. This feature means that high signal to noise ratios can be achieved in atomic beam experiments.
Chapter 1. INTRODUCTION 2
natural linewidths of transitions being probed). Thus atomic beams are highly useful when performing experiments which require sub-Doppler resolution.
There are, however, many problems and difficulties associated with operating and maintaining an atomic beam system. Firstly, high to ultra-high vacuum condi-tions are required, as the chamber through which the beam flows should contain a negligible amount of background gas ensuring that the beam will not be significantly affected by collisions with other atoms or molecules. Thus a high vacuum enclosure, equipped with high vacuum pumps, are a necessity. Secondly, an in vacuo beam source (oven) is required to heat heat a reservoir containing the atoms which form the beam. Realising such an oven in high vacuum can be a difficult task [3]. A final disadvantage is that the high vacuum requirements make the atomic beam system bulky and weighty, generally confining them to a well equipped laboratory setting.
Laser-atom interactions can also be studied in atomic vapour cells, which pro-vide a for more user-friendly alternative. An atomic vapour cell is simply a sealed and evacuated glass container, which contains a low pressure background gas of a particular element. After manufacture, vapour cells do not require any high vacuum equipment for maintenance or operation and they are small and easily transportable. It is also possible to introduce elements (e.g. electric field plates) into a vapour cell at the time of manufacture to increase their versatility (see for example Macgillivray et al. [4]). Vapour cells are considerably cheaper to purchase and for more quickly applied than an atomic beam system. Thus, wherever possible, it is desirable to use vapour cells instead of atomic beams.
Chapter J. INTRODUCTION 3
not allow one to study the time evolution or projection of atoms within the cell as can be done with an atomic beam.
In this thesis, a technique is developed which allows one to study certain physical phenomena, which have previously required an atomic beam, within a sealed glass vapour cell. This is achieved by passing two spatially separated laser beams, co-propagating parallel to each other, through a cell, and detecting atoms which travel from one laser beam to the other. One laser is used to apply a signature or label to the desired velocity group of atoms, and the other selectively detects the labelled atoms. Generally, this will be atoms travelling at right angles to, and in the plane of, both laser beams, forming a parallel atomic beam.
To achieve this, a velocity selective optical pumping scheme was employed. This scheme enabled us to label only those atoms travelling with a specific velocity relative to the direction of laser propagation. A similar velocity selective detection technique was used to detect the labelled atoms.
This study was performed using rubidium, a group 1 element of the periodic table. There were several reasons for doing this. Firstly, optical transitions in rubidium are easily accessible by commonly available diode lasers. Rubidium also has an energy level structure which allows a simple optical pumping scheme to be employed for the labelling and detection. Additionally, rubidium has only one outer shell electron, making it similar in nature to hydrogen, so its behaviour is relatively well understood theoretically.
The following chapters describe in detail how the vapour cell atomic beam (VCAB) was realised and illustrate the usefulness of this technique. To perform the experiments, suitable lasers were required for the labelling and detection of the atoms. External cavity diode lasers were chosen as these had been reported to provide the desired operating characteristics [7, 8]. The design, construction, characterisation and frequency stabilisation of these lasers is described in chapter 2.
Chapter L INTRODUCTION 4
schemes and the method described here incorporates some of these ideas. An analysis of the properties and limitations of the VCAB is also given.
Chapter 2
LASER DIODES
In order to perform the vapour cell atomic beam experiments we required lasers with narrow linewidth, a good frequency tuning range, good long term frequency stability and output powers up to tens of milliWatts. External cavity laser diodes (ECLD) were chosen as they possess the above features and can be constructed from relatively cheap and simple components. Additionally, laser diodes are available at wavelengths suitable for probing the rubidium D2 transition at 780 nm which is the transition used in the experimental work.
In this chapter, a review of some of the important developments in laser diode technology and the impact these have had on atomic physics research is provided. A description of the basic principles of operation of external cavity lasers which use grating feedback follows. The ECLDs designed and constructed in the present work are then discussed in some detail. The lasers were used for saturated absorption measurements of the hyperfine transitions of the rubidium D2 line. Finally, the lasers were locked using two techniques and their stability and linewidth characteristics studied to ensure they could operate reliably at the frequencies required for later experiments.
2.1 I n t r o d u c t i o n and review
Chapter 2. LASER DIODES 6
Laser light is generated by sending an electrical current through an active region, within the semiconductor chip, which is located between n-type and p-type cladding layers. Electrons and holes are produced which recombine in the active region, resulting in the emission of photons. The front and end faces of the chip define the laser cavity and these are typically around 250 ^m apart. Diodes are usually housed in metal cans with an antireflection coated output window. The cans are typically several miUimetres in diameter and similar in length making them very compact and practical devices.
During the past two decades, laser diodes have revolutionised experimental atomic physics. They are low cost, easy to use, available at a range of wave-lengths, have narrow linewidth and good stability making them preferable to dye and titanium-sapphire lasers in many applications. Two excellent reviews by Cam-paro, 1985 [9] and Wieman and HoUberg, 1991 [8] cover in detail the history and major developments of laser diodes and their various applications to atomic physics. Much of the following paragraphs is a brief synopsis of these extensive reviews.
The first application of laser diodes in atomic physics took place in 1968 by Bolger and Diels [10] who used a GaAs diode, cooled to liquid nitrogen temper-ature, to observe multiple photon echoes in caesium. The first real spectroscopic measurements using laser diodes was reported in 1969 by Siahatgar and Hochuli [11] and Hochuli, Halderman and Siahatgar [12]. In both of these experiments, a GaAs diode operating at 77 K was used to probe the caesium D2 transition at 852 nm. A current pulse, with a duration of the order of several microseconds, was used to sweep the laser frequency across the atomic transition in both an atomic vapour [11] and an atomic beam [12].
Chapter 2. LASER DIODES 7
The advent of room temperature InGaAsP and AlGaAs diodes drastically in-creased the usefulness of laser diodes. In 1983, Camparo and Klimcak used a room temperature continuous wave (c.w.) AlGaAs diode to measure the hyperfine struc-ture of the rubidium Di line [14]. The laser wavelength was controlled and scanned by combined adjustment of the operating current and temperature. The fluorescence spectra of the Di line was recorded as the laser was scanned across the transition. Using a simple atomic beam they were able to resolve each of the hyperfine transi-tions and measure an isotope shift of 81 MHz with an uncertainty of ± 5.0 MHz. This highlighted how easy it was becoming to perform high resolution laser spectroscopy using relatively simple and cheap apparatus.
By the mid 80s, laser diodes were becoming widespread in atomic physics. A summary of the various elements studied by this time, using diode laser spectroscopy, can be found in [9]. The spectral characteristics of laser diodes however, were not yet fully optimised. The linewidths of the diodes used in these experiments were of the order of 10 to 100 MHz, substantially broader than the majority of spectral features being studied which are typically of the order of several MHz.
The solution to this problem came with the development of external cavity laser diodes [8]. The principle of operation of ECLDs is described in some detail in section 2.2. Briefly though, an external cavity laser diode uses feedback from an external wavelength selective element to control the lasing frequency of the diode. The ad-vancements brought about by using laser diodes in the external cavity configuration are significant. A drop in the linewidth from tens of MHz down to below 1 MHz meant that lasers were now spectrally narrower than nearly all of the features they were used to investigate. Thus, the laser was no longer the limiting factor to exper-imental resolution. In addition, tuning a laser with external feedback provides an alternative to tuning with the injection current or operating temperature, making the laser more versatile.
Chapter 2. LASER DIODES 8
ECLDs are now used in a plethora of different applications ranging from basic spec-troscopy to laser cooling and trapping. Some examples of more recent applications which are relevant to the vapour cell atomic beam concept are mentioned below.
High resolution spectroscopy of alkali elements using ECLDs is a popular and well established field of research. As an example of this type of work Bowie et al. [20] and Lee et a/.[21] performed saturated absorption spectroscopy, with external cavity laser diodes, to study the Zeeman effect in rubidium. In both cases, various magnetic fields were applied to the Rb vapour and saturated absorption spectra were recorded. The resolution of their systems enabled them to observe Zeeman energy level shifts in fields as low as 1 mT.
Atomic clocks have also been the beneficiary of ECLD technology. In 1991, Monroe et al. use light from laser diodes to cool caesium atoms and use these cooled atoms to observe the atomic clock transition [22]. They also discuss the possibility of using an atomic fountain of cooled atoms to improve the accuracy of the clock. This has since been demonstrated by Clairon et al. and is currently being used to create the most accurate atomic clocks to date [23].
More recently, the field of laser cooling has gained considerable attention and many experiments have used external cavity laser diodes to cool and trap a variety of atoms, see for example [24, 25, 26]. They are now a standard component of most laser cooling experiments in which the cooling transition is accessible by a laser diode. One of the most notable achievements in this area was the realisation of Bose-Einstein condensation in rubidium in 1995 by the JILA group [27].
Chapter 2. LASER DIODES 9
2.2 E x t e r n a l Cavity Diode Lasers
It has already been noted that free running laser diodes are usually not stable enough or sufficiently narrow in linewidth to perform high resolution spectroscopy. There are however, some simple measures which can be employed to narrow the linewidth and stabilise the frequency to a level which makes them far more useful. With the addition of an external cavity and precision temperature control and current supply, laser diodes can be forced to operate single mode with very narrow linewidth (< 1 MHz). The frequency of the diode can be scanned precisely over a large fraction of its gain bandwidth by relatively simple adjustments of the cavity alignment, operating temperature or injection current. Because of this, the most common use of diode lasers in atomic physics is in the external cavity configuration.
External cavities take advantage of the fact that laser diodes are highly sensitive to optical feedback. An external wavelength selective element is used to provide optical feedback to the diode and control its operating wavelength. Typically, a diffraction grating [8] and/or Fabry Perot cavity [28] are used as the external el-ement (s), and it has also been shown [29] that simpler reflective elel-ements can be used. Additionally, laser diodes generally require a precision current supply and temperature control system to ensure stable single mode operation.
Chapter 2. LASER DIODES 10
1 st order diffracted beam Laser diode
Grating
Output
Figure 2.1: Schematic diagram of a Littrow configuration external cavity
laser diode. Light from the laser is coUimated and then incident on a diffrac-tion grating oriented at the Littrow angle, ^L- Part of the light is diffracted back into the diode and part of it is reflected out. The feedback controls the wavelength of the laser.
2.2.1 T h e Littrow configuration
The simplest design for an ECLD which utilises feedback from a diffraction grating is the Littrow configuration. Figure 2.1 shows a schematic of this arrangement. Light from a laser diode is coUimated and directed onto a diffraction grating, oriented at the Littrow angle, 9i,, to the normal to the grating surface, given by:
sin^L = ^ (2.1)
Chapter 2. LASER DIODES 11
by the length of the diode chip) also determine the wavelengths at which lasing will be allowed.
Despite its simplicity there are some problems with the Littrow design. As the angle of the grating is changed, the direction of the output beam also shifts. This can lead to problems as the alignment of the output into an experiment will change if it is required to shift the wavelength. Additionally, unless the axis about which the grating angle rotates is positioned in precisely the right location [30], there will be regular mode hops as the laser frequency is scanned. This is due to the number of wavelengths, N, in the laser cavity changing. As the grating angle is changed, the cavity length should also change in such a way to keep A'' constant. To achieve this with the Littrow configuration a bulky and more awkward design is required.
2.2.2 Littman-Metcalf configuration
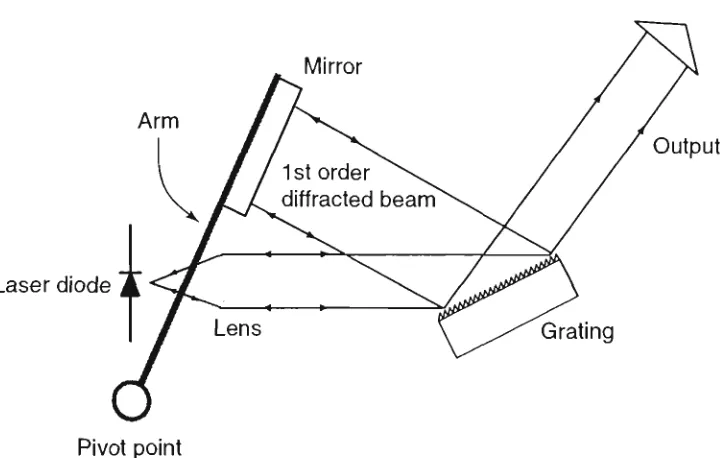
A design which has overcome these problems is the Littman-Metcalf external cavity configuration (figure 2.2). In this arrangement, the angle between the laser and diffraction grating remains fixed. The first order diffracted beam is directed onto a mirror, mounted on a rotating arm. As the arm rotates about the pivot point, the wavelength of the light which travels the complete cavity path (ie. laser diode, diffraction grating, mirror, diffraction grating and back into the diode) changes accordingly.
There are four main advantages of this design, the first being that the direc-tion of the output beam is fixed as both the grating and laser diode do not move. Another feature is that the wavelength selectivity is more precise as the grating is now oriented close to grazing incidence, meaning that more lines are illuminated. Also, one complete path around the cavity involves diffraction from the grating twice which leads to better wavelength selectivity. Finally, by appropriately positioning the pivot point, the laser can easily scan over a large wavelength range without mode hopping.
per-Chapter 2. LASER DIODES 12
IVIirror
Output
Laser diode
Grating
Pivot point
Figure 2.2: Schematic diagram of a Littman-Metcalf cordiguration external cavity laser diode. Light from the laser is coUimated and then incident on a diffraction grating. Part of the light is diffracted onto a rotating mirror and part of it is reflected out. The light diffracted onto the mirror reflects back onto the grating to be diffracted once again into the laser diode.
formance and operating characteristics are superior to Littrow configuration lasers.
2.3 External cavity laser diodes constructed
Chapter 2. LASER DIODES 13
2.3.1 M a c a d a m Lciser
The laser described in this section is based on a modified version of the design of Macadam et al. [7]. A schematic diagram showing the main components of this laser is given in figure 2.3. The primary components of this ECLD are a laser diode, coUimating lens, diffraction grating, mirror mount, piezoelectric disc, an Invar baseplate and an aluminium mounting block.
The laser diode fits snugly in a tube which is held in an aluminium mounting block. A coUimating lens ( / = 5 mm, NA = 0.45) is mounted in a separate threaded tube which screws into that of the laser. This allows the distance between the lens and the diode to be easily and precisely adjusted to obtain the optimum laser colli-mation. Both tubes sit in the aluminium mounting block. All of these components (laser diode, coUimating tube and aluminium mounting block) are in good thermal contact with each other and also the Invar baseplate.
Light from the laser is coUimated and directed onto a diffraction grating (Ed-munds Scientific A43847 gold coated, 1200lines/mm, 750nm blaze), which is ori-ented at the Littrow angle (^L = 27.9° for this grating at 780nm). The diffraction grating is glued onto a mirror mount (New Focus 9806) which allows the vertical and horizontal alignment of the grating angle to be independently adjusted. The adjustment screws on the mount are used for coarse alignment and wavelength se-lection. A PZT disc located between the plate which the grating is attached to, and one of the adjustment screws of the mirror mount, is used for fine control of the grating angle. This allows the laser wavelength to be controlled very precisely via an electronic signal, which is important when scanning the laser over an atomic transition or locking to a transition peak.
Chapter 2. LASER DIODES 14
Invar baseplate
PZT disc
mount
Laser diode / Lens Diffraction grating
Al mounting block
Laser output
Figure 2.3: Schematic diagram of the ECLD, based on the design of [7]. The
Chapter 2. LASER DIODES 15
cavity result in frequency drifts at a rate of 4 GHz/°C and 7 GHz/°C respective!}' for this type of laser [7].
Invar was chosen as the baseplate material because of its extremely low thermal expansion coefficient. The Invar baseplate is temperature controlled by two Peltier coolers driven by a temperature control circuit. The temperature sensor is mounted in the aluminium block near the laser diode. A circuit diagram and explanation of the operation of the temperature control system constructed for this laser are given in Appendix A.
Once the laser was fully constructed and aligned, it was placed in a Perspex box to minimise air currents through the cavity. This improves the temperature stability and helps keep the grating and other components free from dust. As already stated, the Peltier coolers were attached to the bottom of the Invar baseplate. The other side of the Peltiers were attached to a large aluminium heatsink. This was then attached to a larger mild steel base which provided a massive and stable foundation for the laser system. The thermal mass of the Al heatsink and mild steel base was far greater than that of the laser and its components so that the Peltiers could efficiently control the cavity temperature. It was also important to ensure that the laser baseplate and heatsink were thermally isolated to prevent thermal leakage from one to the other.
A precision current source was essential to ensure stable operation of the laser. Instabilities in the operating current translate into instabilities in the operating frequency of the laser (200MHz/mA) [7]. The laser diode was driven by a Newport 505 current driver operated in constant current mode. An attractive feature of this current supply is that it has the option to apply modulation from an external source to the laser diode which was particularly useful for locking the laser.
Chapter 2. LASER DIODES 16
by around 10%.
In the present system, the grating was blazed in the direction of the feedback, to provide maximum optical feedback to the laser diode. This was done to maximise control of the diode using grating feedback. However, it did mean that the power inside the cavity was substantially higher than the output coming off the grating. Typically, with « 20 mW of laser power in the cavity, 5 mW would be coupled into the output.
2.3.2 Arnold laser
The laser described in this section is based on the design of Arnold et al. [19]. The essential features of this laser are the same as for the previous laser however, now all components fit neatly onto a mirror mount. A schematic of this ECLD is given in figure 2.4.
The laser diode and lens (/ = 4.5mm, NA = 0.55) were once again located in a coUimating tube (ThorLabs LT230P-B). This tube was attached to the back plate of a Newport UIOO-P mirror mount. The front plate was machined away to allow space for the laser beam to pass. A small aluminium block was attached to the front plate of the mount with one side machined away at 45°. A PZT disc was glued onto this surface, and a diffraction grating (Richardson Grating Laboratory, gold-coated holographic, 1800 hnes/mm) was glued to the other side of the PZT (^L = 4 4 . 6 °
for this grating at 780nm). This created an external cavity which is shorter and simpler and has less scope for mechanical creep. The mirror mount was attached to an aluminium baseplate which was temperature stabilised by a Peltier cooler. It was not necessary to use an Invar baseplate for this laser as the cavity length is determined by the mirror mount, which operates independent of the baseplate. The Peltier was driven by a commercial temperature controller (Newport 325) and the temperature sensor was located in the coUimating tube near the laser diode.
Chapter 2. LASER DIODES 17
Mirror mount
Al baseplate
Laser diode
Lens
Temp, sensor
Al block with 45° face
PZT disk
Diffraction grating
PZT stack Laser output
Figure 2.4: Schematic diagram of the ECLD, based on the design of [19].
Chapter 2. LASER DIODES 18
One, a PZT stack, is located between the front plate of the mirror mount and the ball end of the adjustment screw. This is used for scanning the wavelength over a large range and its response is not particularly quick (up to several tens of Hz). The other, a PZT disc located between the grating and 45° aluminium block, is used to quickly scan the cavity length and hence the laser frequency over short ranges. It has a frequency response up to several tens of kHz which means it can be used for fast modulation and frequency corrections when locking to a transition peak (see section 2.5).
A Spectra Diode Labs SDL-5401 laser diode was used in this ECLD. These diodes nominally provide 50 mW output power at a wavelength of 780 nm. The grating used in this laser provides significantly less feedback than the one used with the previous laser. As a consequence, the threshold current only dropped by around 5% with feedback aligned. However, this reduced feedback was still strong enough to force the diode into single mode operation. An advantage of this was the substantial increase in the output power off the grating as more of the light is reflected out. Typically, the power coming out of the cavity was between 50% to 55% of the power in the cavity compared with approximately 25% for the previous design. Normal operating conditions for this laser would have about 45 mW in the cavity and 23 mW output, substantially more than 5 mW for the previous laser.
2.4 Saturated absorption measurements
measure-Chapter 2. LASER DIODES 19
ment was performed to examine how well the rubidium atomic transitions could be resolved.
A saturated absorption measurement provides a good indication of the linewidth and mode-hop-free scan range of the lasers. With a suitable laser, it is possible to resolve and scan continuously over all of the features of the saturated absorption spectrum of the rubidium D2 transitions. This was particularly important here as the lasers were to be locked to these features.
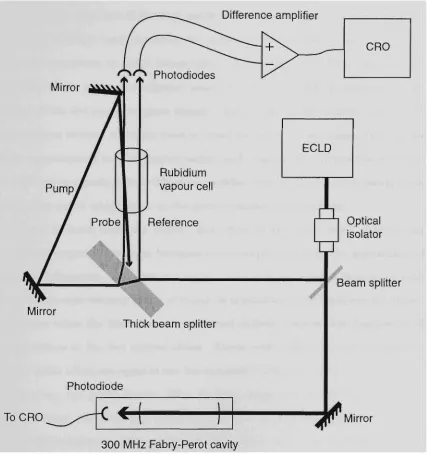
Saturated absorption spectroscopy has long been used as a means to obtain spectroscopic information with sub-Doppler resolution [1]. A schematic of the ex-perimental arrangement used for the saturated absorption measurements is given in flgure 2.5.
Output from an ECLD was split into two beams, one was used in the satu-rated absorption measurement and the other was sent to a spectrum analyser (with 300 MHz free spectral range and finesse greater than 150). The spectrum analyser monitored the relative frequency of the laser as it was scanned across a transition.
The beam for the saturated absorption experiment was then further split into three beams using a thick glass beam splitter. Two weak beams, the reference and probe, were reflected from the front and back surfaces of the beam splitter respectively. Both of these beams co-propagated parallel to each other through a vapour cell and onto photodiodes. The transmitted beam (pump) was reflected around and through the cell in the opposite direction to the probe and reference. It overlapped the probe beam at approximately 180° and did not cross the reference beam.
Chapter 2. LASER DIODES 20
Difference amplifier
Mirror ^ M
Photodiodes
CRO
Rubidium vapour cell
Reference
ECLD
I
O
Optical isolator
Mirror
Thick beam splitter
Photodiode
To CRO
Beam splitter
* »
Mirror
300 MHz Fabry-Perot cavity
Figure 2.5: Schematic of the experimental arrangement for saturated
Chapter 2. LASER DIODES 21
If however, the laser frequency is tuned precisely to an atomic resonance (i.e. for zero velocity atoms), all three laser beams will be exciting the same velocity group of atoms. Because of the high power in the pump beam, it will excite many of the atoms which would normally be excited by the probe. This results in an on-resonance increase in probe transmission. In the absence of the pump laser, the absorption of the probe and reference beams would be identical Doppler broadened profiles. With the pump in place though, sharp peaks in the transmission of the probe become evident when the laser is tuned precisely on resonance. These peaks will be superimposed on the Doppler background. Taking the difference between the two photodiode signals with a difference amplifier removes the Doppler background, leaving only peaks which occur at the precise transition frequencies.
If there is more than one excited state level in the atom being studied, the saturated absorption spectrum becomes more complicated with the appearance of cross-over resonances. These are due to the pump and probe lasers interacting with the same non-zero velocity group of atoms on transitions to different excited states. They occur when the laser frequency is tuned halfway between the frequencies of the transitions to the two excited states. Atoms with nonzero velocity experience Doppler shifts which are equal in size but opposite in direction, for the counter prop-agating pump and probe beams. With the laser tuned halfway between transitions to two different excited states, there will be one velocity group of atoms which are Doppler shifted into resonance with one laser beam to one of the excited states. And, this same velocity group will be Doppler shifted into resonance with the other laser on the transition to the other excited state. As both lasers are interacting with the same velocity group of atoms, the pump laser is again removing atoms which could normally absorb probe radiation. Therefore, the probe transmission will also show sharp peaks when the laser frequency is tuned halfway between two excited states as well as when it is tuned to a true hyperfine transition (a more detailed discussion can be found in [1]).
Chapter 2. LASER DIODES 22
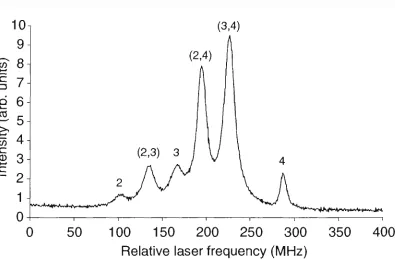
rubidium D2 line were obtained using the ECLDs described above. The intensities of the probe, reference and pump beams were approximately 1 mW/cm^, 1 mW/cm^ and 5mW/cm^, respectively. Figure 2.6 shows saturated absorption scans from the F' = 2 and F' = 3 ground states in ^^Rb. Scans for both ground states of ^^Rb are shown in figure 2.7. The frequency scales were derived from the transmission of a 300 MHz confocal Fabry-Perot spectrum analyser. Transitions to the true excited state hyperfine levels have been labelled by the hyperfine quantum number, F, of the excited state. Crossover peaks have been labelled (in brackets) with the hyperfine quantum numbers of the two excited state levels involved. All of the expected features in these spectra are present and clearly resolved.
These traces indicate that the linewidth of the laser is narrow enough to resolve the spectroscopic features we will study in later experiments. During the course of these measurements, the mode hop free scan range of the lasers was observed to be typically of the order of 3 GHz. This in itself is not particularly critical, however, it is larger than the width of the Doppler broadened transitions indicating that the frequency can be scanned continuously across the ranges required for typical experiments.
2.5 Laser Stabilisation Schemes
External cavities greatly improve the spectral stability and linewidth of laser diodes. However, due to factors such as mechanical creep and temperature and injection current fluctuations, their stability is still not optimal. With the grating feedback, the short-term (100 ms) linewidth is reduced to a few hundred kilohertz. There is however, substantial jitter and long term drift which increase the linewidth to tens, or even hundreds, of megahertz over a period of several hours.
Chapter 2. LASER DIODES 23 w c n i _ ^ >^
^-> CO
c (D
4-3 i?.
0
(1,3) (2,3)'%V>^JJ^y».#A*V*'.'^,^HI'*''"*^ •*»'Vl^M^l^*n^'^Mt**•'^
0 50 100 150 200 250 300
Relative laser frequency (MHz)
350 400
10
9
CO 87
c si COc
CD +-«c
6
5
4
3
2
1
0
(a) Saturated absorption scans for ^^Rb, F' = 2 to F = 1,2 and 3
(3,4)
v^^--'*'A4»'^wJtWV-*'H^
0 50 100 150 200 250 300 350
Relative laser frequency (MHz)
(b) Saturated absorption scans for ^^Rb, F' = 3 to F = 2,3 and 4
400
Figure 2.6: Saturated absorption scans for the 5Si to 5P3 levels of ^^Rb.
2 2 _
Chapter 2. LASER DIODES 24
CO
2.5 n
2.0-n
L
-CO
sit
y
c CD
1.5
1.0
0.5-0
100 200 300 400
Relative laser frequency (MHz)
500
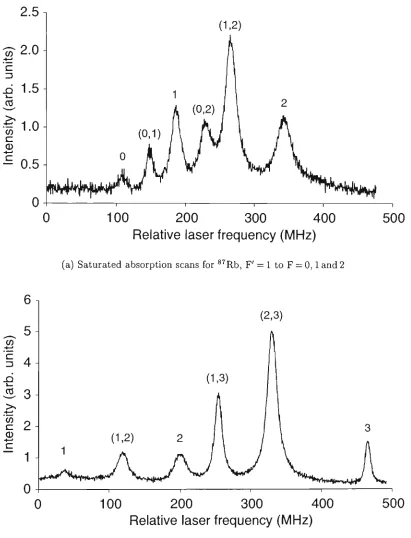
(a) Saturated absorption scans for *^Rb, F' = 1 to F = 0,1 and 2
0
100 200 300 400
Relative laser frequency (MHz)
500
(b) Saturated absorption scans for ^"Rb, F' = 2 to F = 1,2 and 3
Figure 2.7: Saturated absorption scans for the 5Si to SPs levels of ®^Rb.
Chapter 2. LASER DIODES 25
spectral feature.
Several methods for locking lasers this way have been reported, see for example [7, 31, 32, 33]. In these techniques, a photodiode signal, based on resonant absorption, provides a stable frequency reference to which the laser is locked. This photodiode signal is sent into a feedback circuit which drives the frequency selective elements of the ECLD, bringing the laser back to the desired lock point. The feedback signal generated can be sent to the PZT element(s) and/or the laser diode injection current. Typically, the response of a PZT is far slower than that of the injection current but the injection current can only be used to scan the laser over a small range. For this reason, the PZT stack is used for slow (< 100 Hz) corrections to the laser frequency and the injection current or PZT disc are used for fast, small amplitude corrections.
In the present work, two locking techniques have been applied and tested . These are the dichroic-atomic-vapour laser lock (DAVLL) described by Corwin et al. [32] and the AC lock described by Dinneen et al. [31]. These two methods were selected as they are robust and able to lock lasers to the frequencies we required for later experiments. Both of these methods have been shown to stabilise ECLDs to better than 1 MHz over a period of several hours. They also allow the lock point to be scanned over a range of frequencies around resonance.
An electronic circuit, which takes the signal from a photodiode, processes it, and then uses this to drive both the fast (injection current/PZT disc) and slow (PZT stack) frequency selective elements to keep the laser at the desired lock point, was developed. A diagram and brief description of this circuit is given in appendix B.
2.5.1 Dichroic-atomic-vapour laser locking
Chapter 2. LASER DIODES 26
A diagram of the setup used for DAVLL locking is given in figure 2.8. A fraction of the laser output is taken off a beam splitter and sent through a rubidium vapour cell. Permanent ring magnets are placed around the cell to provide a longitudinal magnetic field of approximately 10 mT. Light from the laser which enters the cell is linearly polarised. Linear polarisation can be considered as equal amounts of left and right handed circularly polarised light. In the absence of any magnetic fields, both of these circular polarisation components, a'^ and a^, experience the same absorption as the laser frequency is scanned across an atomic transition. However, with a longitudinal field applied, the Zeeman shift changes the resonant frequency in opposite directions for the two polarisation components. This shifts the absorption profiles for each of the polarisations in opposite directions.
Difference amplifier
Rubidium vapour cell
Polarising beam splitter
I
Opticalisolator
' Beam splitter
Photodiodes
Quarter wave Linear polariser plates
Chapter 2. LASER DIODES 27
After passing through the cell, the two circularly polarised components are con-verted into two orthogonal linear components by a quarter wave plate with its optic axis oriented at 45° to the initial linear polarisation. These are then separated by a polarising beam splitter and directed onto two photodiodes. Taking the difference between the absorption of the two beams (the photodiode signals) gives a curve which is asymmetric about the frequency of the atomic resonance. The difference of the photodiode signals gives the DAVLL signal used to lock the laser.
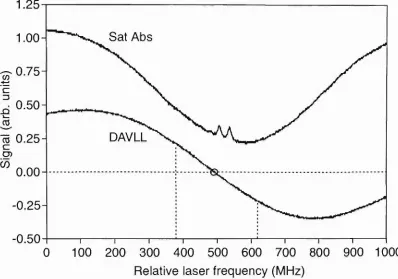
Figure 2.9 shows a typical DAVLL signal when the laser was scanned over the ^^Rb F' = 3 to F = 2,3 and 4 transition, along with a saturated absorption scan for frequency reference. The lock point, circled on the trace, occurs where the dispersion signal crosses zero. By adjusting either the angle of the quarter wave plate or the voltage offset applied to the DAVLL signal, the lock point could be easily scanned over a continuous range of approximately 250 MHz, centred around the hyperfine transition peaks.
The linewidth of lasers locked using this technique was measured by beating two locked lasers together and monitoring the beat note on an RF spectrum anal-yser. The short term linewidth of the lasers was found to be approximately 1 MHz. However, over a longer period, a slow drift in the laser frequency of approximately 10-20 MHz per hour was observed. This was attributed to temperature fluctua-tions in the experimental setup. It has been suggested that small variafluctua-tions in the temperature of optical components such as the polarising beam splitter and quarter wave plate, combined with temperature changes in the vapour cell, reduce the long term stability of this locking technique [32]. It is believed, that these factors, and possibly instabilities in the reference voltages of the locking electronics, led to the long term drift.
Chapter 2. LASER DIODES 28
1.25
1.00-
-0.25--0.50 0
"I 1 1 "1 1 r^ 1 1 1
100 200 300 400 500 600 700 800 900 1000
Relative laser frequency (MHz)
Figure 2.9: Dispersion signal for DAVLL locking. Top trace shows a
satu-rated absorption scan of the ®^Rb F' = 3 to F = 2, 3 and 4 D2 transition (only the two large crossover peaks are visible). Bottom trace shows the DAVLL sig-nal to which the laser can be locked. By adjusting the voltage offset the laser lock point (circled) could be shifted anywhere over the range of approximately 250 MHz as indicated.
This meant that the DAVLL technique would be of hmited use for some of our desired applications so we were forced to use another locking scheme.
2.5.2 AC locking
The AC locking technique, overcomes the slow drift problems encountered with the DAVLL method by locking to the peak of one of the hyperfine or crossover resonances like those shown in figures 2.6 and 2.7. These peaks are insensitive to drifts in laser intensity or the temperature of the cell or other optical components, making this method more reliable. This technique is based on that described in [31].
Chapter 2. LASER DIODES 29
frequency was chosen to avoid resonances in the PZT disc which could make the laser behave erratically. The modulation is achieved by applying a dither to either the injection current or PZT disc of the laser. The amplitude of the modulation was small, less than 1 MHz peak to peak in terms of optical frequency, to avoid any undesired line broadening.
The signal from the photodiode which monitors the saturated absorption is taken into a in amplifier tuned to the frequency of the modulation (24 kHz). The lock-in amplifier extracts the lock-information at this frequency from the total photodiode signal. This yields a signal with dispersion shaped features at the frequencies of the hyperfine transition peaks and crossover resonances.
This scheme has also been realised on the D2 line in rubidium. Figure 2.11 shows a typical dispersion signal produced by the lock-in, along with the saturated absorp-tion scan (which is simply the total photodiode signal) for frequency reference. The dispersion signal crosses zero at positions corresponding to the top of the hyperfine or crossover peaks. These are the positions at which the laser can be locked.
Lasers locked using this technique generally remained locked for periods of sev-eral hours. Because the laser is now locked to a much narrower spectral feature, the linewidth and long terra stability are both significantly better than for the DAVLL technique. A beat signal between two AC locked ECLDs monitored on a RF spec-trum analyser showed a short term width of less than 1 MHz. Over a period of approximately one hour, the beat note was stable to within 2 MHz of its initial frequency.
Also shown in figure 2.10 is a solenoid surrounding the vapour cell. This is so that a variable strength DC magnetic field can be applied to the cell. Note also that there are two quarter wave plates located on either side of the cell, so that both the incident and return beams of the saturated absorption setup have the same handed circular polarisation (ie. both o-+ or both a~).
Chapter 2. LASER DIODES 30
Mirror
Photodiode
Beam splitter
Quarter wave plates
Linear polariser
Figure 2.10: Schematic diagram of the experimental arrangement for AC
locking, after Dinneen et al. [31]. Modulated light from the laser diode is sent into a single beam saturated absorption setup. This is measrured on a photo-diode and this signal is sent to a lock-in amplifier. The lock-in extracts the information which occurs at the modulation frequency, yielding a dispersion curve to be used by the locking circuit to lock the laser.
the atoms. Using either a'^ or a~ light, we optically pump atoms so that essentially only the extreme magnetic sublevels of the ground and excited states are involved in the transition. The Zeeman shifts in these ground and excited sublevels are opposite in direction, and hence will result in an apparent shift of the atomic resonance frequency. By controlling the magnetic field applied to the cell, we can control the shift in resonance frequency and hence tune the position of the lock point.
Chapter 2. LASER DIODES 31
1.25
100 150 200 250 300 350 Relative laser frequency (MHz)
400
Figure 2.11: Dispersion signal for AC locking. Top trace shows a saturated
Chapter 2. LASER DIODES 32
zero field resonance. Later, in the laser cooling studies (chapter 5), it was necessary to precisely scan the frequency of a laser over a small range around the F' = 2 to F == 3 transition in *^Rb. This locking technique allowed us to do so quite simply through the application of suitable magnetic fields.
2.6 Conclusions
Chapter 3
T H E V A P O U R CELL A T O M I C BEAIM
Creating an atomic beam in a vapour cell involved the development of a velocity se-lective optical pumping scheme which used two spatially separated lasers. One laser was used to label a particular velocity group of atoms, and another laser detected these atoms in a different position in the cell. In this chapter, a description of the vapour cell atomic beam system is provided along with an analysis of some of the important physical properties of the beam.
In section 3.1 a review of related vapour cell work using spatially separated lasers is presented. A general description of the labelling and detection mechanism is then given. A detailed explanation of the optical pumping scheme used to select and detect the right velocity groups of atoms with the D2 transition in rubidium, is provided in section 3.3. The transverse velocity distribution of the VCAB is then calculated and compared to a real atomic beam. A discussion of the results and some limitations of the present scheme are provided in section 3.5.
3.1 Review of separated laser beam experiments
Vapour cell experiments utilising spatially separated laser beams have been reported by several groups. These techniques can be traced back to the early 1970's when Letokhov et al. proposed that separated pump and probe beams could be used to observe saturated absorption features, provided the lifetime of the excited state was longer than the average time taken for atoms to travel from one laser beam to the next [34].
This suggestion was realised experimentally by Baba in 1981 [35] in a methane cell
Chapter 3. THE VAPOUR CELL ATOMIC BEAM 34
(resonance A = 3.39 pm). The lifetime of the methane excited state was estimated to be about 10 ms, substantially longer than the time taken for the majority of atoms to travel the distance between the two laser beams. Lamb dips in the absorption of one of the beams were observed and found to be due to atoms excited by the other laser beam. In another report, Baba et al. extended this technique to the measurement of optical Ramsey resonances [36].
Phillips et al. proposed a velocity selective optical pumping scheme which used the Doppler shift to select and measure molecules with a speciflc velocity [37]. They demonstrated that it would be possible to measure molecules which have been in-volved in collisions with a background gas, by scanning the laser frequency across the Doppler profile. The velocity resolution they reported was comparable to what could be obtained using a conventional molecular beam. Later, in 1978, they used this technique to measure the angular scattering distribution of sodium atoms after collisions with argon [38].
In 1980 Nakayama et al. used polarisation spectroscopy to measure the Larmor precession of sodium atoms as they travelled between two adjacent laser beams [39]. Their scheme consisted of one laser split into a strong circularly polarised pump beam and a weaker linearly polarised probe beam. These beams were spatially separated and propagated antiparallel to each other through a vapour cell. The probe laser passed through a set of crossed polarisers on either side of the vapour cell so that under normal conditions no signal was measured. Atoms which passed through the pump beam were spin polarised. Any of these atoms which crossed the path of the probe would alter its polarisation and lead to some transmission through the crossed polarisers. An external magnetic field was applied which caused the spin polarised atoms to precess and this would "unwrite" the polarisation induced by the pump.
Chapters. THE VAPOUR CELL ATOMIC BEAM 35
Similar results to these were observed with the present VCAB as detailed in chapter 4.
A somewhat questionable report on the observation of atom collimation in a standard gas vapour cell was given by Wang et al in 1993 [40]. They claim to have observed channelling of atoms through the nodes of an intense standing wave field. As stated in their paper however, their experiment did not have the resolution required to properly observe laser coohng, nor did they adequately consider the optical pumping processes. What they claim to be laser cooling appears to be better explained by optical pumping. As will be shown later, it is necessary to go to some lengths to attain the resolution required to observe laser cooling and then separate this from optical pumping. The resolution of their system was approximately two orders of magnitude worse than what we found to be suitable (chapter 5).
More recently, Skalla et al. have used separated beams in a vapour cell to perform Ramsey-type spectroscopy in sealed glass cells [41]. The pump laser in their case was pulsed, with a pulse duration much shorter than the Larmor period. Atoms were probed by a weaker laser at various positions in different shaped cells. The absorption of the probe was monitored as a function of time after the pump pulse and the spin signals were observed as periodic oscillations in the absorption signal. They also propose a novel scheme for the measurement of the Aharonov-Casher phase using their vapour cell atomic beam system.
In summary, experiments with spatially separated laser beams have proven to be useful in a number of applications ranging from simple spectroscopy, to more complex polarisation studies. The potential for further development of these techniques is clear providing much of the impetus for the present work.
3.2 Basic A r r a n g e m e n t for V C A B E x p e r i m e n t s
Chapter 3. THE VAPOUR CELL ATOMIC BEAM 36
Chopper
Chopped laser
Rubidium vapour cell
z
Probe
laser /
->-x
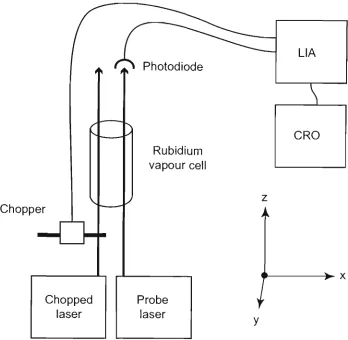
Figure 3.1: Experimental arrangement for observation of a vapour cell atomic beam. Two separated lasers travel parallel to each other through a Rb vapour cell. One is chopped at a frequency of approximately 2 kHz. The other (probe) is monitored on a photodiode and the photodiode signal is sent to a lock-in amplifier tuned to the frequency of the chopper. LIA = lock-in amplifier, CRO = oscilloscope. Both lasers propagate in the ^-direction.
detect the labelled atoms (figure 3.1). A photodiode, chopper and lock-in amplifier are needed for signal detection.
The chopped laser is used to label to the desired velocity group of atoms (i.e. those travelling perpendicular to the two laser beams). This is achieved by optically pumping these atoms into a state which is not resonant with the probe laser. That is, the chopped laser modifies the atomic ground state population distribution. The chopped laser passes through a mechanical chopper which blocks and unblocks the laser at a frequency of approximately 2 kHz. Thus the labelling (modulation of the ground state populations) also occurs with this periodicity.
Chapter 3. THE VAPOUR CELL ATOMIC BEAM 37
laser, and its transmission is monitored on a photodiode. The absorption it expe-riences is dependent on (among other things) the number of atoms in the ground state it is resonant with. Any modulation of the number of atoms in this ground state (caused by the chopped laser) will show up as a modulation in the absorption of the probe.
The number of atoms which interact with the chopped laser and then contribute to the total absorption of the probe is relatively small. (A simple geometric calcu-lation predicts that with 1 mm diameter beams, separated by 5 mm, only 3% of the atoms absorbed by the probe laser will have intersected the shopped laser path). Thus a lock-in amplifier, tuned to the frequency of the chopper, is used to extract any signal which occurs at that frequency. It follows that any signal observed on the lock-in must be due to atoms which have traversed both lasers, since the chopped laser is the only source of any 2 kHz modulation.
The vapour cell atomic beam appears as in figure 3.2. Atoms travelling perpen-dicular to both lasers, from the chopped to the probe, form a "ribbon" of atoms that constitute the beam.
3.3 V C A B in a rubidium cell
Chapter 3. THE VAPOUR CELL ATOMIC BEAM 38
Rubidum vapour cell
Chopped laser • - X
Probe laser
Figure 3.2: The vapour cell atomic beam. Atoms travelling from the chopped
laser to the probe form a ribbon beam of atoms. Spectroscopic velocity se-lection detects only those atoms travelling perpendicular to both laser beams and these atoms constitute an atomic beam in a vapour cell.
3.3.1 Preliminary considerations
A rubidium vapour cell is an evacuated glass cell with several small droplets of rubidium metal placed inside. The vapour pressure of the rubidium droplets provides a low pressure gas of atoms in the cell. Atoms in the gas travel in all directions with a Maxwellian distribution of velocities. From this gas we wish to select only those atoms travelling in a specific direction. It is important then that other atoms in the cell do not interfere with the selected atoms via collisions. This means that the mean free path of atoms between collisions needs to be substantially greater than the distance between the two lasers.
Chapter 3. THE VAPOUR CELL ATOMIC BEAM 39
Amfp, of rubidium atoms between collisions, given by [5]
where n is the number density of atoms, OQ = Trrf^ is the total scattering cross section and d is the diameter of a Rb atom, equal to 495 pm [43]. For rubidium atoms at room temperature, A^fp Ri 150 m. This is far greater than the dimensions of the cell and therefore it can be concluded that the effects of interatomic collisions will be negligible.
3.3.2 V C A B in ^^Rb
In order to realise the VCAB in ^'''Rb two separate lasers of slightly different fre-quency were required to select and detect the desired velocity group of atoms. Figure 3.3 is a partial energy level diagram for ^''Rb which shows the hyperfine transitions of the chopped and probe lasers.
The chopped laser frequency is tuned so that atoms with zero velocity component along the direction of laser propagation (z-axis) will be resonant on the F' = 2 to F = 2 transition. Once excited to the F = 2 state, these atoms can relax back down to either the F' = 1 or F' = 2 ground states. As resonant atoms traverse this laser field, they may experience many cycles of excitation and relaxation, after which a readily measurable number of atoms will have been optically pumped into the F' =: 1 ground state. It should be emphasised at this point that only atoms moving perpendicular to the chopped laser will be excited to the F = 2 state. Atoms with a velocity component along the direction of laser propagation which Doppler shifts them out of saturated line profile, and hence will not be pumped out.
Chapter 3. THE VAPOUR CELL ATOMIC BEAM 40
F = 3
F = 2
F = 1
F = 0
267.2 MHz
F' = 2
157.1 MHz
72.3 MHz
Chopped laser
^
> 5P3/2
J
Probe laser
^
6834.7 MHz > 5S1/2
F' = 1
I
JFigure 3.3: Partial energy level diagram of ^^Rb, showing the chopped and
Chapter 3. THE VAPOUR CELL ATOMIC BEAM 41
on the F' = 2 to F = 2 transition. The F' = 2 to F = 3 transition was selected for the probe because it is the strongest one available and will therefore be most sensitive to small changes in the number of absorbers. Atoms with non-zero z-velocities will again be Doppler shifted out of resonance with the probe.
Absorption of the probe laser depends upon the number of atoms in the F' = 2 ground state. Therefore any change in the population of this ground state due to the action of the chopped laser will be reflected in the absorption of the probe. The photodiode and lock-in amplifier detection system selects and amplifies features from the total photodiode signal at the frequency of the chopper, yielding a signal which only contains information about atoms which have travelled from the chopped laser to the probe.
Similar effects would be seen if the chopped and/or probe lasers were tuned to transitions from the F' = 1 ground state. However, transitions from the F' = 2 state are generally stronger, giving rise to more optical pumping and hence larger signals. Atoms travelling with ^-velocities such that other hyperfine transitions are Doppler shifted into resonance may also be excited by either laser (section 3.3.2.1). This leads to signals arising from other velocity groups of atoms. This makes the signal observed on the lock-in quite complicated. It can be shown however, that when the probe and chopped lasers are tuned resonant with the transitions de-scribed above, only atoms travelling perpendicular to the lasers are detected. The case when the frequency of the probe laser is scanned to detect atoms with nonzero transverse velocities is considered in section 3.3.2.2.
3.3.2.1 Atomic velocity groups in the V C A B with b o t h lasers locked
Chapter 3. THE VAPOUR CELL ATOMIC BEAM 42
number of atoms with velocities that bring them resonant with the chopped laser on these other transitions.
For an atom to be excited to the F = 1 excited state, it must experience a Doppler shift, Au, of 157 MHz. The Doppler shift is given by
Ai/ = kv^ (3.2)
where v^ is the velocity component of the atom in the direction of laser propagation and A; = ^ is the wavenumber of the light. Thus, atoms with a small range of velocities around 122 m/s in the 2-plane will be excited to the F = l state. From there, they may relax back to either the F' = 1 or F' = 2 ground states. The result of this will be a net population transfer to the F' = 1 state similar to that which occurs for Vz = 0 atoms.
Atoms with a velocity of 208 m/s toward the laser (i.e. -u^ — -208 m/s) will ex-perience a Doppler shift of -f 276 MHz and be excited to the F = 3 state. However, the dipole transition selection rules (AF = 0, ±1) forbid any transitions from this excited state to the F' = 1 ground state. Therefore these atoms will all relax back down to the F' —2 state and no appreciable population transfer can be detected. However, depending on the polarisation of the lasers, there is some pumping of atoms among the ground state magnetic sublevels, which can affect the absorption of the probe. Using linearly polarised lasers (where the quantisation axis defined by the polarisation direction) atoms tend to get pumped into the middle (mp — 0) magnetic substate [44]. With many of the atoms in this state the probe absorption will again be affected giving rise to a smaller signal for this velocity group of atoms.
Chapter 3. THE VAPOUR CELL ATOMIC BEAM 43
to the important velocity groups of atoms.
>k t,
Vz = 122 m/s (157 MHz) 1
Vz = 0 m/s (0 MHz) 2
Vz = -208 m/s (-267 MHz) 3
V .
Chopped laser
\
/ 1 Vz = 330 m/s (424 MHz)
2 Vz = 208 m/s (267 MHz)
3 Vz = 0 m/s (0 MHz)
Probe laser
Figure 3.4: Atomic trajectories excited by the pump and probe lasers. The
velocities given refer to the velocity groups excited to the various excited state hyperfine levels labelled
This figure shows the three velocity groups labelled, and the three velocity groups which can be detected. There is, however, only one velocity group which is resonant with both lasers and that is the Vz^Om/s group. This means that with both lasers tuned as shown in figure 3.3, the only signal that will be observed on the lock-in will be due to atoms travelling perpendicular to both lasers. With this combination of lasers then, the vapour cell atomic beam consists only of atoms travelling perpendicular to both lasers.
3.3.2.2 A t o m velocities in the V C A B when the probe laser is scanned
Chapter 3. THE VAPOUR CELL ATOMIC BEAM 44
being detected on each of the three possible hyperfine transitions that the probe can excite.
When measuring this situation experimentally, the situation is simplified by two factors. Firstly, the relative strengths of the probe transitions are not the same. Probe excitation to the F = 3 excited state occurs far more readily than excitation to the other states. Thus the absorption on this transition yields the largest signal. Secondly, the other velocity groups of atoms are at some velocity away from the centre of the Doppler profile. Therefore, there will be fewer atoms involved, again reducing the size of observed signals for atoms on these other transitions.
3.3.2.3 ^^Rb R e s u l t s
The setup of figure 3.1 was realised with the chopped laser locked to the F' = 2 to F = 2 transition and the probe laser frequency was scanned around the F' = 2 to F = 3 resonance. The lock-in amplifier signal, recorded as a function of probe laser detuning, is shown in figure 3.5. The frequency scale was derived from the saturated absorption scan shown on the trace which had been calibrated with a Fabry-Perot spectrum analyser as in section 2.4. The intensities of the lasers were 5.0mW/cm^ and 4.5mW/cm^ for the chopped and probe lasers respectively. The laser beams were separated by 4.1 ± 0.1 mm and the spot sizes were small compared to this separation (see section 3.4 for more detail).
There are two traces shown in this figure, the top trace is a saturated absorption scan of the probe laser over the F' = 2 to F = 1,2 and 3 states, with the hyperfine peaks labelled. This provides a reference so that the probe detuning could be pre-cisely monitored.
![Figure 2.4: Schematic diagram of the ECLD, based on the design of [19]. is glued to a PZT disc which is glued to an aluminium block](https://thumb-us.123doks.com/thumbv2/123dok_us/7911470.1313603/28.570.95.489.203.558/figure-schematic-diagram-ecld-based-design-glued-aluminium.webp)
![Figure 2.8: Schematic diagram of the experimental arrangement for DAVLL locking, after [32]](https://thumb-us.123doks.com/thumbv2/123dok_us/7911470.1313603/37.570.101.484.372.663/figure-schematic-diagram-experimental-arrangement-davll-locking.webp)