See discussions, stats, and author profiles for this publication at: http://www.researchgate.net/publication/283289117
Phenotypic Diversity Studies on Selected
Kenyan and Tanzanian Rice (Oryza sativa L)
Genotypes Based on Grain and Kernel Traits
ARTICLE
· NOVEMBER 2015
DOI: 10.4172/2375-4338.1000150READS
14
12 AUTHORS
, INCLUDING:
Festus Wambua
Kenyatta University
6
PUBLICATIONS
0CITATIONS
SEE PROFILE
Dorothy Nyamai
Kenyatta University
8
PUBLICATIONS
1CITATION
SEE PROFILE
Rose Chemutai
Kenyatta University
2
PUBLICATIONS
0CITATIONS
SEE PROFILE
Mathew Piero Ngugi
Kenyatta University
45
PUBLICATIONS
32CITATIONS
Phenotypic Diversity Studies on Selected Kenyan and Tanzanian Rice (Oryza
sativa L) Genotypes Based on Grain and Kernel Traits
Mawia Musyoki A1*, Wambua Kioko F1, Agyirifo Daniel1, Nyamai Wavinya D1, Matheri Felix1, Langat Chemtai R1, Njagi Mwenda S1, Arika Arika W1, Gaichu Muthee D1, Ngari Ngithi L1, Ngugi Piero M1 and Karau Muriira G2
1Department of Biochemistry and Biotechnology, School of Pure and Applied Sciences, Kenyatta University, P.O. Box 43844-00100, Nairobi, Kenya 2Molecular Biology Laboratory, Kenya Bureau of Standards, Nairobi, Kenya
Abstract
Phenotypic characterization of rice (Oryza sativa L.) provides useful information regarding preservation of diversity and selection of parental genotypes with superior traits in plant breeding program. The main objective of the present study was to characterize 13 selected rice genotypes from Kenya and Tanzania based on 7 grain and kernel traits. Minitab 15.0 software was used to analyze data. The 7 traits showed highly significant differences among the improved and local landraces. A dendrogram was constructed from data set of mean values of grain and kernel traits and showed two super clusters; I and II. Principal component analysis revealed that all the seven quantitative traits significantly influenced the variation in these genotypes.
*Corresponding author: Mawia Musyoki A, Department of Biochemistry and
Biotechnology, School of Pure and Applied Sciences, Kenyatta University, Nairobi, Kenya; Tel: +254 711 953 234; E-mail: [email protected]
Received September 19, 2015; Accepted October 01, 2015; Published October 03, 2015
Citation: Mawia Musyoki A, Wambua Kioko F, Daniel A, Nyamai Wavinya D, Felix
M, et al. (2015) Phenotypic Diversity Studies on Selected Kenyan and Tanzanian Rice (Oryza sativa L) Genotypes Based on Grain and Kernel Traits. J Rice Res 3: 150. doi:10.4172/2375-4338.1000150
Copyright: © 2015 Mawia Musyoki A, et al. This is an open-access article
distributed under the terms of the Creative Commons Attribution License, which permits unrestricted use, distribution, and reproduction in any medium, provided the original author and source are credited.
Keywords
: Oryza sativa L; Dendrogram; Principal component analysisIntroduction
Rice (Oryza spices) is a monocotyledonous plant belonging to the
family Granineae and subfamily Oryzoidea. It is ranked second to wheat among the most cultivated cereals in the world. Due to its importance as a food crop, rice is being planted on approximately 11% of the Earth’s cultivated land area. During crop improvement strategies, selection on breeding lines depends on a given set of criteria found suitable to a particular environment and for specific application. This process has led to development of morphologically related genotypes. Phenotypic similarity poses threats of epidemic of pests and diseases. To address this problem, phenotypic characterization is important in breeding program to avoid this inherent danger of phenotypic uniformity. In addition, landraces offers valuable genetic materials that can be utilized in future crop development and improvement programs. High yielding varieties which are the back bone of green revolution have led to erosion
of landraces and wild varieties of rice5. Importance of landraces can
never be ignored in agriculture system. This is because improvement in existing varieties depends upon desirable genes which are possibly present in landraces and wild varieties only. Therefore, characterization of phenotypic diversity on existing landraces of rice reveals important traits of interest that can be utilized in rice improvement programs. A number of research studies on phenotypic diversity assessment of various rice varieties around the world based on grain and kernel traits have been carried out. However, phenotypic diversity studies on rice genotypes from Kenya and Tanzania based on grain and kernel traits has not yet been studied before. Therefore, the objectives of this study
were to determine the phenotypic diversity on selected rice (Oryza
sativa L) genotypes from Kenya and Tanzania along other 2 genotypes
from Philippine based on 7 grain and kernel traits and to identify the traits that contribute to the total variation among the rice genotypes studied. Information generated from phenotyping these genotypes can be utilized in rice breeding programs [1-6].
Materials and Methods
Plant materials
A total of 13 rice genotypes comprising of local landraces and
improved rice genotypes were collected from Mwea Irrigation Agricultural Development Centre (MIAD) in Mwea, Kenya and Kilimanjaro Agricultural Research Institute in Moshi, Tanzania. The name, country of origin and category of the rice genotype chosen for the study are given in (Table 1).
Measurement of grains and kernel traits
The following seven (7) phenotypic traits were measured in this study; grain length (GL), grain breadth (GB), grain length/breadth (G-L/B), kernel length (KL), kernel breadth (KB), kernel length/ breadth (K-L/B) and 100 grain weight (100 GW). For each of the rice genotype, 10 grains were randomly selected and their measurement taken using a digital vernier caliper. Weight of 100 rice grains from each genotype was determined using an electronic weighing balance (Mettler toledo), and average weight ± standard error mean recorded.
Data management and analysis
Citation: Mawia Musyoki A, Wambua Kioko F, Daniel A, Nyamai Wavinya D, Felix M, et al. (2015) Phenotypic Diversity Studies on Selected Kenyan and Tanzanian Rice (Oryza sativa L) Genotypes Based on Grain and Kernel Traits. J Rice Res 3: 150. doi:10.4172/2375-4338.1000150
Page 2 of 4
Results
Measurement of grain and kernel traits
The measurement of the grain and kernel traits for the 13 rice genotypes and their mean values are shown in Table 2. From the table,
it can be seen that Supa, a local landrace rice genotype from Tanzania
had the highest value of the grain length (10.48) while ITA 310, an
improved rice genotype from Kenya had the lowest value of the grain
length (9.00). In terms of grain breadth, Supa, a local landrace rice
genotype from Tanzania had the highest value of the grain breadth
(2.14) while ITA 310, an improved rice genotype from Kenya had the
lowest value of grain breadth (1.79). Furthermore, it was observed
that Wahiwahi, a local landrace rice genotype from Tanzania reported
the highest value of grain length/breadth ratio (5.26) whereas IR64,
an improved rice genotype from Philippine had the lowest value of grain length/breadth ratio (4.60). Moreover, Supa, a local landrace rice genotype from Tanzania had the highest value of the kernel length
(7.78) while ITA 310, an improved genotype from Kenya recorded the
lowest value of kernel length (6.54). In terms of kernel breadth, Supa,
a local landrace rice genotype from Tanzania had the highest value of
the kernel breadth (1.90) while ITA 310, an improved genotype from
Kenya recorded the lowest value of kernel breadth (1.60). In terms of
kernel length/breadth ratio, Kilombero, a local landrace rice genotype
from Tanzania had the highest value of the kernel length/breadth ratio
(4.45) while BW 196, an improved genotype from Kenya had the lowest
value of the kernel length/breadth ratio (3.68). In terms of grain weight,
Supa, a local landrace rice genotype from Tanzania had the highest
value of the grain weight (2.91) while ITA 310, an improved genotype
from Kenya recorded the lowest value of grain weight (1.67) (Table 2).
Cluster analysis
A dendrogram was constructed from data set of mean values of the 7 grain and kernel traits and showed two super clusters; I and II as
shown in (Fig 1). Super cluster I comprised of Kilombero, Wahiwahi
and Supa genotypes both indigenous rice genotypes from Tanzania.
On the other hand, super cluster II comprised of 10 rice genotypes; 5 improved rice genotypes from Kenya, 2 improved rice genotypes from Philippine, 1 improved rice genotype from Tanzania and 2 indigenous rice genotypes from Tanzania. Super cluster II was more diverse and could further be divided into 2 sub groups.
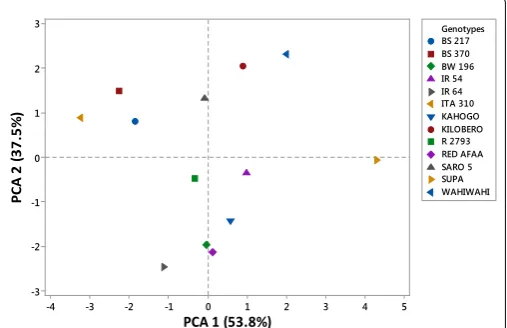
Principal component analysis (PCA)
The PCA was performed for all the 7 grain and kernel traits among the 13 rice genotypes as indicated in table. Out of seven, two principal components exhibited more than one Eigen value and showed about 91.3% variability among the traits studied. The PC1 had 53.8%, PC2 showed 37.5% and PC3 exhibited 5.4% variability among the genotypes for the traits under study. Principal component one (PC1), principal component two (PC2) and principal component three (PC3) had
Eigen values of 3.77, 2.62, 0.38 and 0.14 respectively. The first PC was
highly and positively correlated to grain length, grain breadth, kernel length and 100 grain weight. However, it was negatively correlated to grain length/breadth ratio. In the second PC, grain length/breadth ratio, kernel length and kernel length/breadth ratio were highly and positively correlated traits. On the other hand, it was highly and negatively correlated to grain breadth and kernel breadth. The third PC exhibited high positive correlation between kernel length and kernel length/breadth ratio. However, it was highly and negatively correlated to grain length and grain length/breadth ratio as shown in fig. Based on the 7 grain and kernel traits, the 13 rice genotypes were clustered into four groups as shown in figure 1. The first quadrant was made up of Kilombero and Wahiwahi. The second quadrant grouped Saro 5, BS 217, ITA 310 and BS 370 together. R 2793, IR 64 and BW 196 were grouped into third quadrant. The forth quadrant consisted of Red Afaa, Kahogo, IR 54 and Supa genotypes (Table 3 and Figure 2).
Discussion
Diversity analyses of germplasm collections of several crop species
Variety Origin Category of rice
R 2793 Kenya Improved variety
BS 217 Kenya Improved variety
BS 370 Kenya Improved variety
BW 196 Kenya Improved variety
ITA 310 Kenya Improved variety
SARO 5 Tanzania Improved variety
IR 64 Philippine Improved variety
KILOBERO Tanzania Local land race
RED AFAA Tanzania Local land race
KAHOGO Tanzania Local land race
SUPA Tanzania Local land race
IR 54 Philippine Improved variety
WAHIWAHI Tanzania Local land race
Table 1: Names, origin and category of the rice genotypes used in this study.
Genotype G.L G.B TraitsG L/B K.L K.B K L/B 100 GW
R 2793 (A) 9.49 ±0.18bcd 1.96 ±0.05bc 4.86± 0.11ab 6.87±0.08bc 1.74±0.03bcd 3.95±0.03bcde 2.46±0.17abc
BS 217 (B) 9.34±0.25cd 1.87 ±0.02bcd 5.00 ±0.11ab 6.82±0.14bc 1.66±0.02cd 4.11 ±0.04abcd 2.70±0.12ab
BS 370 (C) 9.03±0.14d 1.80 ±0.02cd 5.01± 0.08ab 7.02±0.10bc 1.65 ±0.02cd 4.27 ±0.08ab 1.96 ±0.19cde
BW 196 (D) 9.52±0.08bcd 1.99 ±0.04ab 4.79± 0.09ab 6.72±0.06c 1.83± 0.02ab 3.68 ±0.05e 2.18 ±0.18bcde
ITA 310 (E) 9.00 ±0.06d 1.79 ±0.02d 5.03± 0.06ab 6.54±0.08c 1.60±0.04d 4.10 ±0.08abcd 1.67 ±0.09e
Saro 5 (F) 9.75 ±0.15abcd 1.93 ±0.04bcd 5.08 ±0.12ab 6.95±0.16bc 1.68 ±0.04bcd 4.16±0.11abc 2.61±0.13ab
IR 64 (G) 9.02 ±0.14d 1.96 ±0.02b 4.60 ±0.08b 6.56±0.09c 1.76 ±0.02abc 3.72 ±0.05de 2.27±0.04bcd
Kilobero (H) 9.97 ±0.28abc 2.01± 0.03ab 4.96 ±0.09ab 7.37±0.19ab 1.68 ±0.05cd 4.45±0.16a 1.84±0.08de
Red Afaa (I) 9.43 ±0.15bcd 2.02 ±0.05ab 4.70 ±0.12b 6.62±0.05c 1.79 ±0.05abc 3.73±0.13de 2.84±0.04a
Kahogo (J) 9.49± 0.17bcd 2.01± 0.03ab 4.72± 0.10b 6.88±0.10bc 1.79±0.02abc 3.85 ±0.06cde 2.52 ±0.09ab
Supa (K) 10.48 ±0.26ab 2.14± 0.02a 4.82 ±0.12ab 7.78±0.19a 1.90±0.01a 4.09 ±0.10abcd 2.91 ±0.02a
IR 54 (L) 9.75 ±0.11abcd 2.02± 0.03ab 4.85 ±0.10ab 7.02±0.05bc 1.77 ±0.03abc 3.98 ±0.04bcde 2.43 ±0.08abc
Wahiwahi (M) 10.44 ±0.28a 1.99± 0.03ab 5.26 ±0.13a 7.30±0.12ab 1.74 ±0.04bcd 4.20 ±0.07abc 2.83 ±0.06a
have revealed considerable variability for a wide range of traits. The wide range of diversity in phenotypic traits have proved a useful tool in classification of plants and the information obtained could be of high interest to plant breeders in development of plant species with desirable agronomic and nutritional qualities [7,8]. From the ANOVA table, it was evident that the means of the measured traits varied significantly
among the 13 rice genotypes included in this study. The differences in mean values of grain length across the 13 rice genotypes studied could be as a result of different expression levels of GS3 gene that confers grain length in rice. In addition, the differences in mean values of grain breadth and grain weight across the 13 rice genotypes studied could be as a result of different expression levels of GW2 gene within the rice genome. Reduced expression of GW2 gene increases grain breadth, resulting in enhanced grain weight, whereas over expression decreases grain breadth and weight. Moreover, the differences in mean values of kernel length across the 13 rice genotypes studied could be as a result
of different expression levels of Kne gene that confers kernel length
in rice. These results were consistent with findings of. Genotypes that were clustered together indicated that they shared similar traits. For
example, three improved rice genotypes namely BS 370, BS 217 and
ITA 310 both from Kenya were grouped together and this showed
that they have similar grain and kernel traits. Genetic improvement of these genotypes could have resulted in sharing of similar genes that influenced their phenotypic characteristics. On the other hand,
genotype R 2793 and BW 196 both improved genotypes from Kenya
formed separate clusters implying that they are phenotypically distinct from each other as far as grain and kernel traits are concerned [9-12].
Principal component analysis measures the importance and contribution of each component to the total variance while each coefficient of proper vectors indicates the degree of contribution of every original variable with which each principal component is associated. In PC1, the traits that accounted for most of the 53.8% observed variability among 13 genotypes included grain length, grain breadth, kernel length, kernel breadth and 100 grain weight. Therefore, this implied that these traits contributed most to the diversity captured in the first principal component. Grain length/breadth ratio, kernel length and kernel length/breadth ratio were the most important traits that highly contributed to variation patterns among the genotypes studied in PC2. Moreover, in PC3 only 4 traits contributed highly to variation patterns among the genotypes studied. They included: grain length, grain length/breadth ratio, kernel length and kernel length/ breadth ratio. Kernel length contributed to variation across all the three principal components indicating that is one of the most important agronomic traits in rice. These results agree with the findings of. The phenotypic diversity witnessed among the rice genotypes studied could be used as possible parents for rice improvement program [13,14].
Conclusion
Phenotyping of germplasm materials is an important undertaking in genetic resource conservation to ensure efficient conservation management as well as its effective utilization especially in breeding programs. In this study, 13 rice genotypes were characterized to assess their phenotypic diversity and showed considerable variability based on the 7 grain and kernel traits. There was a moderate significant difference in mean values of the measured traits. Out of the 7 traits
measured, Supa had the highest number of 5 traits with highest mean
values, that is, grain length, grain breadth, kernel length, kernel breadth
and grain weight while ITA 310 had the highest number of 5 traits
with lowest mean values, that is, grain length, grain breadth, kernel length, kernel breadth and grain weight. Cluster analysis based on the 7 grain and kernel traits clustered the 13 rice genotypes into 2 major groups. Cluster I was less diverse since it consisted of only 3 genotypes while cluster II was more diverse and consisted of 10 genotypes. Such groupings are useful to breeders in identifying possible genotypes that may be used as parents in breeding for any of the phenotypic traits that were studied. The PCA revealed that all the traits contributed
SUPA WAH IWAH I KILO MBE RO IR 64 ITA
310 BS 37
0 BS 21
7 IR 54 SARO
5
RED AFAA BW 19
6
KAHO GO R 27
93 33.34 55.56 77.78 100.00 Rice genotypes Si m ila ri ty I II
Figure 1: Dendrogram from mean values of grain and kernel traits among
13 rice genotypes.
5 4 3 2 1 0 -1 -2 -3 -4 3 2 1 0 -1 -2 -3
PCA 1 (53.8%)
PC A 2 (3 7. 5% ) RED AFAA SARO 5 SUPA WAHIWAHI BS 217 BS 370 BW 196 IR 54 IR 64 ITA 310 KAHOGO KILOBERO R 2793 Genotypes
Figure 2: Clustering of 13 rice genotypes based on 7 grain and kernel traits.
PC 1 PC2 PC3
Eigen value 3.77 2.62 0.38
% Total Variance 53.8 37.5 5.4
% cumulative 53.8 91.3 96.8
Traits Eigen vectors
Grain Length (cm) 0.457 0.234 0.352
Grain Breadth (cm) 0.473 -0.214 0.101
Grain Length/Breadth -0.034 0.566 -0.613
Kernel Length (cm) 0.408 0.312 0.474
Kernel Breadth (cm) 0.395 -0.368 -0.072
Kernel Length/Breadth 0.023 0.587 0.482
100 Grain weight (g) 0.494 0.036 -0.169
Citation: Mawia Musyoki A, Wambua Kioko F, Daniel A, Nyamai Wavinya D, Felix M, et al. (2015) Phenotypic Diversity Studies on Selected Kenyan and Tanzanian Rice (Oryza sativa L) Genotypes Based on Grain and Kernel Traits. J Rice Res 3: 150. doi:10.4172/2375-4338.1000150
Page 4 of 4
significantly to variation patterns among the genotypes studied. Above all, the information generated will reduce the overall time required by rice breeders to screen large populations for potential breeding stock.
References
1. Vaughan DA, Morishima H, Kadowaki K (2003) Diversity in the Oryza genus. Current opinion in plant biology, 6: 139-146.
2. Walia US, Walia MK (2007) Scope of direct seeded rice in India. In Proc. Biennial Conf. ISWS on New and Emarging Issues in Weed Science, 2-3. 3. Khush GS (2005) What it will take to feed 5.0 billion rice consumers in 2030.
Plant molecular biology, 59: 1-6.
4. Patra BC (2000) Collection and characterization of rice genetic resources from Keonjhar district of Orissa. Oryza, 34: 324-326
5. Fowler C, Mooney P (1990) Shattering: Food, Politics and Loss of genetic diversity. University of Arizona Press, Tucson.
6. Holden J, Peacock J, Williams T (1993) Gens, Crops and the Environment. Cambridge University Press, Cambridge.
7. Yang RC, Jana S, Clarke JM (1991) phenotypic diversity and associations of some potentially drought-responsive characters in durum wheat. Crop Science, 31: 1484-1491.
8. Maduakor HO, Lal R (1989) Root system top-growth and yield of cassava (Manihot esculenta) as affected by plant population in an arid areas. Root Crops, 15: 115-122.
9. Takano-Kai N, Jiang H, Kubo T, Sweeney M, Matsumoto T, et al. (2009) Evolutionary history of GS3, a gene conferring grain length in rice. Genetics 182: 1323-1334.
10. Xian JS, Wei H, Min S, Mei Z, Zhu HXL (2007) A QTL for rice grain width and weight encodes a previously unknown RING-type E3 ubiquitin ligase. Nature genetics, 39: 623-630.
11. Ahn SN, Bollich CN, McClung AM, Tanksley SD (1993) Restriction Fragment Length Polymorphism analysis of genomic regions associated with cooked-kernel elongation in rice. Theoretical and Applied Genetics 87: 27-32. 12. Basabdatta D, Samik S, Mrityunjay G, Tapas KG (2012) Assessment of
diversity amongst a set of aromatic rice genotypes from India. International Journal of Biodiversity and Conservation, 4: 206-218.
13. Sanni KA, Fawole I, Ogunbayo A, Tia D, Somado EA, et al. (2012) Multivariate analysis of diversity of landrace rice germplasm. Crop Science 52: 494-504. 14. Takeda K (1990) Inheritance of grain size and its implications for rice breeding.
In: Proceedings of the Second International Rice Genetics Symposium. IRRI, Manila, 181-189.
OMICS International: Publication Benefits & Features Unique features:
• Increased global visibility of articles through worldwide distribution and indexing • Showcasing recent research output in a timely and updated manner • Special issues on the current trends of scientific research Special features:
• 700 Open Access Journals • 50,000 editorial team • Rapid review process
• Quality and quick editorial, review and publication processing
• Indexing at PubMed (partial), Scopus, EBSCO, Index Copernicus and Google Scholar etc • Sharing Option: Social Networking Enabled
• Authors, Reviewers and Editors rewarded with online Scientific Credits • Better discount for your subsequent articles
Submit your manuscript at: http://www.omicsonline.org/submission
Citation: Mawia Musyoki A, Wambua Kioko F, Daniel A, Nyamai Wavinya D,