Contingency Analysis of 5 Bus Sub-Station
System: A Case Study
Nihalkumar Raj 1, Dr Ram Jee Gupta 2
M.Tech Student, Department of Electrical Engineering, BITsindri, Dhanbad, Jharkhand, India1 Assistant Professor, Department of Electrical Engineering, BIT sindri, Dhanbad, Jharkhand, India2
ABSTRACT: One of the essential aspects of modern power system security is the consideration of any contingencies arise due to planed or unplanned equipment outages leading to system over load or abnormal system voltages. So many techniques have been developed in the past few years to solve this problems in this work present a study report for contingency analysis caused by transformer outage in distribution substation system has been done In the present work a case study of 5 bus system fed from either of the two available sources in the campus of BIT sindri has been done. During contingency analysis outage of transformer and transmission lines have been observed.
KEYWORDS:Contingency analysis, Ranking, Remedial action scheme, Load flow, FDLF
I. INTRODUCTION
Study of power system contingencies is an important activity in power system planning and operating environment. Contingency studies determine the effects of equipment outage on the rest of the power system. In general, an outage gives rise to transient phenomena in the electrical and electromechanical states of a power system. However, the main thrust of contingency studies carried out in power system control centres is for determining the steady-state effects of an outage. The transient contingency problem is also an important one, but its study is hampered by a lack of adequate analytical techniques and by the difficulty of exercising control in the short time span available for corrective action. To study the effect of an outage it is only necessary to perform a load-flow with the outage taken into account. However, it is necessary to develop a fast and sufficiently accurate approximation to the outage load flow so that a large number of contingency studies can be performed in a short time. The starting point in most load flow approximations is the separation of real power-phase angle dependence (P-O) from the reactive power-voltage magnitude dependence (Q-V). Since the phase angles across the power system elements are normally small, voltage and magnitudes at buses are close to their nominal values, the separation of (P-e) from (Q-V) dependence is a reason- able procedure. This assumption will be made in this paper also. A commonly used method for contingency analysis is based upon the use of distribution factors. This technique is reviewed briefly in the following section.
The distribution factor method of contingency analysis is very fast in its execution time and for that reason is widely used in real-time applications as well as planning studies. This technique is known to be particularly suited to the study of real power redistribution following an outage. It is not as accurate in dealing with problems of reactive power flow redistribution and accompanying effects on bus voltages. Contingency analysis is one of the major components in today’s modern energy management systems.
in outage studies has been dealt in [5].Contingency screening or contingency selection is an essential task in contingency analysis.
This helps to reduce the numerous computations; the bounding method [6] reduces the number of branch flow computation by using a bounding criterion that helps in reducing the number of buses for analysis and is based on incremental angle criterion. The 1P-1Q method for contingency selection has been presented in [7]. The use of fast decoupled load flow [8-9] proves to be very suitable for contingency analysis
II.RELATED WORK
This work has been done in MATLAB environment as detailed in belowalgorithms and with the help of two important performance indices(PIP and PIV ) that identify the severity of system due to outage of line or transformer and second
step is Load flow analysis using power system GUI in MATLAB
III. DETERMINATION OF CONTINGENCY STATUS WITH REFERRED TO BUS
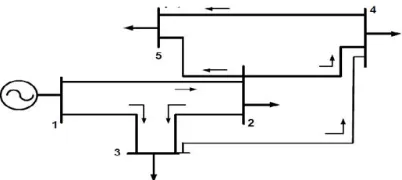
System under examination is BIT Sindri sub-station, 5 Bus test system with 100 MVA base. It consist of 7 two winding transformer connected at different location. BIT Sindri enjoys electricity supply from DVC through TISCO and from JSEB. Two lines of 11KV with the help of AB switch the power from either of lines according to requirement.
Step 1: Make the single line diagram of the test system.
Step 2: Input the data for each and every component of the test system as required. Step 3: Save the data file and then load.
Step 4: Solve the Power Flow using MATLAB graphic user interface (GUI) for the test system without any contingency.
Step 5: Simulate for the Power Flow results.
Step 6: Step by Step remove each transmission line and simulate for the Power Flow and Continuation Power Flow for finding maximum loading parameter for each transmission line.
Step 7: Arrange the result obtained in ascending order w.r.t.the PIP and PIV for each transmission line.
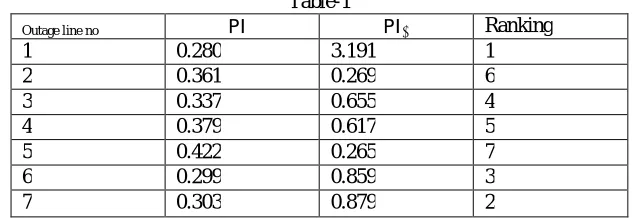
Table-1
Outage line no PI PI Ranking
1 0.280 3.191 1 2 0.361 0.269 6 3 0.337 0.655 4 4 0.379 0.617 5 5 0.422 0.265 7 6 0.299 0.859 3 7 0.303 0.879 2 The performance indices and contingency ranking using FDLF for 5-bus system Values of PIP for 5 bus system
Fig -2 Outage line number
System Details
MVA Base=100 MVA System Frequency = 50 Hz Bus Nominal Voltage =11KV Bus Maximum Voltage = 11.5 KV Bus Minimum Voltage = 10.4 KV
0 0.05 0.1 0.15 0.2 0.25 0.3 0.35 0.4 0.45
Table 2 Load Data
Load data for seven transformers in BIT campus
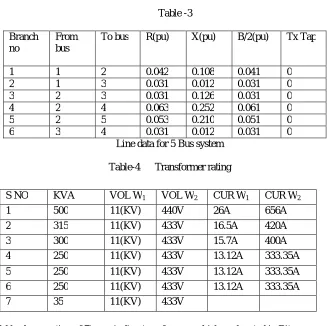
Table -3 Branch
no
From bus
To bus R(pu) X(pu) B/2(pu) Tx Tap
1 1 2 0.042 0.108 0.041 0 2 1 3 0.031 0.012 0.031 0 3 2 3 0.031 0.126 0.031 0 4 2 4 0.063 0.252 0.061 0 5 2 5 0.053 0.210 0.051 0 6 3 4 0.031 0.012 0.031 0
Line data for 5 Bus system Table-4 Transformer rating
Table shows rating of 7two winding transformers which are located in Bit campus BUS NUMBER P(KW) Q(KVAR) V(PU)
1 0.00 0.00 1 2 10.00 0.10 1 3 10.00 0.10 1 4 0.00 0.00 1 5 10.00 0.10 1 6 10.00 0.10 1 7 11.00 0.10 1
S NO KVA VOL W1 VOL W2 CUR W1 CUR W2
IV.RESULTS
Bus voltage magnitude profile in (pu)
Fig.3
Shows per unit voltage at different buses without outage of any transmission line using power GUI in MATLAB TABLE 4
Bus voltage in pre and post contingency state Table-5
The results obtained from simulation of above system are given in table for the various load levels
0 0.2 0.4 0.6 0.8 1 1.2 1.4
1 2 3 4 5
BUS NUMBER PRE CONTINGENCY VOLTAGE (PU)
POST CONTIGENCY VOLTAGE (PU) 1 1.060 1.060
2 1.047 0.891 3 1.024 0.886 4 1.024 0.880 5 1.018 0.861
LOAD LEVEL
(PU)
LINE FLOW LINE LOSSES
REAL POWER(PU)
REACTIVE POWER(PU)
REAL POWER(PU)
V. CONCLUSION
In this work, the contingency selection and ranking which are important for contingency analysis have been done by evaluating two important performance indices namely; active and reactive power performance index (PIP &PIv). These indices were calculated for various test bus systems using the Fast Decoupled Load Flow (FDLF) algorithm. It has been observed that overall distribution system of BIT Sindri some of the transformer are overloaded, and got outdated due to overloading transformer efficiency got decreased and loss increased
REFERENCES
[1] Wood A.J and Wollenberg B.F., “Power generation, operation and control”, John Wiley & Sons Inc., 1996.
[2] Stott B, Alsac O and Monticelli A.J, “Security Analysis and Optimization”, Proc. IEEE, vol. 75,No. 12, pp. 1623-1644,Dec 1987.
[3] Lee C.Y and Chen N, “Distribution factors and reactive power flow in transmission line and transformer outage studies”, IEEE Transactions on Power systems, Vol. 7,No. 1,pp. 194-200, February 1992.
[4] Singh S.N and Srivastava S.C, “Improved voltage and reactive distribution factor for outage studies”, IEEE Transactions on Power systems, Vol. 12, No.3, pp.1085-1093, August 1997.
[5] Peterson N.M, Tinney W.F and Bree D.W, “Iterative linear AC power flow solution for fast approximate outage studies”, IEEE Transactions on Power Apparatus andSystems, Vol. PAS-91, No. 5, pp. 2048-2058, October 1972.
[6] Brandwjn V and Lauby M.G, “Complete bounding method for a.c contingency screening”, IEEE Transactions on Power systems, Vol. 4, No. 2, pp. 724-729, May 1989.