Abstract
VASQUEZ, DIEGO. Plate-End Debonding of Longitudinal Near-Surface Mounted Fiber Reinforced Polymer Strips on Reinforced Concrete Flexural Members. (Under the direction of Dr. Rudolf Seracino)
Adhesively bonding fiber reinforced polymers (FRP) to the faces of reinforced concrete elements has proven to be an effective strengthening technique. However it has some drawbacks that are overcome by the near-surface mounted (NSM) retrofitting technique, in which FRP is bonded into grooves cut in the concrete cover. Being a relatively recent technique, appropriate analytical models are not currently available to predict all possible forms of debonding.
In this research thesis, a comprehensive literature review showed the plate-end debonding mechanism to be the least understood of all three possible debonding mechanisms in NSM strengthened flexural elements, and hence a new rational plate-end debonding analytical model was proposed. The development of the model was aided by detailed finite element analyses and the reviewed literature.
Plate-End Debonding of Longitudinal Near-Surface Mounted Fiber
Reinforced Polymer Strips on Reinforced Concrete Flexural
Members
by
Diego L. Vásquez Rayo
A thesis submitted to the graduate faculty of North Carolina State University
in partial fulfillment of the requirements for the degree of
Master of Science
Civil Engineering
Raleigh, NC May 2008
APPROVED BY:
________________________ Dr. Rudolf Seracino (Chair)
________________________ Dr. Sami Rizkalla
Biography
Table of Contents
List of Tables……….... v
List of Figures………... vi
Notation……….. viii
1. Introduction………. 1
1.1. Background………... 1
1.2. Objectives……….. 2
1.3. Scope………. 2
1.4. Thesis Layout……… 3
2. Literature Review………... 4
2.1. Introduction……… 4
2.2. Beam Retrofitting with Fiber Reinforced Polymers………. 4
2.3. Retrofitting Techniques………... 7
2.4. Debonding Mechanisms………. 12
2.5. Existing Design Models Applicable to NSM Strengthening………... 16
2.5.1. IC Debonding………. 16
2.5.2. CDC Debonding……… 20
2.5.3. PE Debonding……… 25
2.5.3.1. Oehlers and Nguyen……….. 25
2.5.3.2. Hassan and Rizkalla……….. 35
2.6. Existing Experimental Results and Evaluation of Theoretical Models………... 39
2.6.1. Hassan and Rizkalla………. 43
2.6.2. El-Hacha and Rizkalla……….. 48
2.6.3. Barros and Fortes………. 53
2.6.4. Teng et al.……….. 57
2.6.5. Kotynia………... 60
2.6.6. Barros et al.………... 62
2.6.7. Conclusions………... 66
2.6.7.1. Seracino et al.’s Generic IC Debonding Model………. 67
2.6.7.2. CDC Debonding Model………………. 69
2.6.7.3. Oehlers and Nguyen’s Modified PE Debonding Model………... 71
2.6.7.4. Hassan and Rizkalla’s Model………... 72
2.6.7.5. Other Considerations………. 72
3. Development and Validation of Finite Element Models……….. 74
3.1. Modeling……… 74
3.2. Results………... 81
4.1. Transverse Shear Stress τXY………. 87
4.2. Longitudinal Shear Stress τXZ……… 91
4.3. Normal Stress σXX………101
4.4. Resultant Stress………... 103
4.5. Failure Criteria………..106
4.5.1. Mohr-Coulomb Failure Criterion……….106
4.5.2. Mattock and Hawkins Failure Criterion………. 107
4.6. Assessment of the Proposed Model………. 112
5. Conclusions……… 118
5.1. Summary………...118
5.2. Conclusions……….. 119
5.3. Future Research……….. 121
6. References……….. 124
Appendices……… 129
List of Tables
Table 2.1. Hassan and Rizkalla test results………... 44
Table 2.2. Hassan and Rizkalla test results analysis………... 45
Table 2.3. El-Hacha and Rizkalla test results……… 50
Table 2.4. El-Hacha and Rizkalla test results analysis……… 51
Table 2.5. Barros and Fortes test results………... 54
Table 2.6. Barros and Fortes test results analysis……… 55
Table 2.7. Teng et al. test results……… 58
Table 2.8. Teng et al. test results analysis………. 59
Table 2.9. Kotynia test results……….. 61
Table 2.10. Kotynia test results analysis……… 62
Table 2.11. Barros et al. test results……… 64
Table 2.12. Barros et al. test results analysis……… 65
Table 2.13. Summary of experimental and theoretical failure loads for NSM FRP strengthened beams in bending……….. 68
Table 2.14. Estimated fraction of stirrup shear developed in beams failing by CDC debonding……… 71
Table 3.1. Material properties used in finite element modeling……….. 80
Table 4.1. Variation of lr with change in strip thickness ts……….. 101
Table 4.2. Summary of theoretical failure loads including the proposed model……….113
Table 4.3. Performance of PE debonding models………... 114
List of Figures
Figure 2.1. Typical FRP and mild steel stress-strain curves
(Teng et al. 2001)………... 7
Figure 2.2. Typical beam retrofitting techniques………... 9
Figure 2.3. Normal bond stresses induced by a) circular bar, b) strip………... 11
Figure 2.4. IC debonding mechanism………. 13
Figure 2.5. CDC debonding mechanism……… 14
Figure 2.6. PE debonding mechanism……… 15
Figure 2.7. Model of push-pull test specimen……… 16
Figure 2.8. Shear stress-slip models of plate to concrete joints………. 17
Figure 2.9. Definition of IC debonding failure plane………. 18
Figure 2.10. CDC debonding model for point load……….. 22
Figure 2.11. CDC debonding resistance of tension plated beams………. 23
Figure 2.12. Strain profile of a side plated beam……….. 26
Figure 2.13. Bending moment transmission model on a side plate………... 27
Figure 2.14. Distribution of bond stress resisting Mp ………... 28
Figure 2.15. Axial force transmission model on a side plated beam (view from top obeam)………... 29
Figure 2.16. Debonding stresses at the ends of side plates………... 31
Figure 2.17. Experimental calibration of the mathematical model (Oehlers and Nguyen, 2000)……….. 33
Figure 2.18. Bonded surfaces of EB side plates and NSM plates………. 34
Figure 2.19. NSM plate debonding model………. 36
Figure 2.20. Mohr-Coulomb failure criterion……….. 38
Figure 2.21. Strain and force distributions for layered analysis………. 40
Figure 2.22. IC debonding assumed failure planes for multiple strips………... 41
Figure 2.23. Typical specimen details (Hassan and Rizkalla, 2003)………. 43
Figure 2.24. Theoretical shear stresses on plate-to-concrete interface (Hassan and RIzkalla, 2003)……….. 46
Figure 2.25. Theoretical shear stresses on plate-to-concrete interface from Hassan and Rizkalla’s model………... 48
Figure 2.26. El-Hacha and Rizkalla specimen details and test set-up……….. 49
Figure 2.27. Plate-end shear stresses given by Hassan and RIzkalla’s model for El-Hacha and Rizkalla (2004) specimens………. 52
Figure 2.28. Specimen details and test set-up (Barros and Fortes, 2005)………... 53
Figure 2.29. Strengthened beams after failure (Barros and Fortes, 2005)………... 54
Figure 2.30. Typical specimen details and test set-up (Teng et al., 2006)……….. 58
Figure 2.31. Test setup and specimen details (Kotynia, 2006)……….. 60
Figure 2.33. NSM strengthened specimens after failure
(Barros et al., 2007)………. 64
Figure 2.34. CDC failure model for Barros et al. (2007) specimens……….. 66
Figure 3.1. Typical finite element model of Teng et al.’s specimens………. 76
Figure 3.2. Typical finite element model of Hassan and Rizkalla’s specimens……….. 77
Figure 3.3. Stress-strain curve assumed for steel reinforcement………... 78
Figure 3.4. FRP material properties reference axes………. 79
Figure 3.5. Experimental and finite element load-deflection response for Teng et al.’s specimens……….. 83
Figure 3.6. Experimental and finite element load-deflection response for modeled Hassan and Rizkalla’s specimens……… 83
Figure 4.1. Stresses in concrete adjacent to the adhesive layer near the strip ends of an NSM strip considered in the proposed model formulation……….. 85
Figure 4.2. Typical relative magnitude of strip-end stresses for different load levels……….. 86
Figure 4.3. Typical distribution of shear stress τXY from finite element analyses……….. 87
Figure 4.4. Strip bending moment transmission on an NSM strip……….. 89
Figure 4.5. Distribution of bond stress resisting Ms ………. 90
Figure 4.6. Typical shear stress τXZ distribution along the NSM strip before and after cracking of the concrete section……… 93
Figure 4.7. Strain distribution on an NSM strip strengthened beam……….. 94
Figure 4.8. Interfacial area resisting the axial force Fs in the NSM strip……… 95
Figure 4.9. Length of lr estimated from finite element analyses………. 97
Figure 4.10. Effect of change in the location of the section’s neutral axis on the τXZ distribution………. 100
Figure 4.11. Variation of lr with change in strip thickness ts……… 101
Figure 4.12. Magnitude of σXX at the strip end for different load levels………. 102
Figure 4.13. Conceptual interpretation of tensile stress σXX………103
Figure 4.14. a) Mohr’s circle representation for the resulting plane state of stress, b) state of stress at τmax………. 105
Figure 4.15. Mohr-Coulomb failure criterion……….. 107
Figure 4.16. Mattock and Hawkins’ experiments sketch and mechanism considered for the strength of a cracked shear plane………108
Figure 4.17. Mattock and Hawkins failure criterion……….. 110
Figure 4.18. Confinement and aggregate interlock forces on NSM strip………….. 117
Notation
(EA)c = Axial rigidity of concrete section (EA)frp = Axial rigidity of FRP plate or strip (EI)cmp = Flexural rigidity of composite section
(EIeff)cmp= Flexural rigidity of composite section including effective moment of
inertia
(EI)frp = Flexural rigidity of FRP plate or strip
(EI)RC = Flexural rigidity of reinforced concrete section Afrp = Cross-section area of FRP plate or strip
Ar = Strip-end area resisting the axial force on an NSM FRP As = Area of longitudinal steel reinforcement
bc = Beam web breadth
bf = Length of the IC debonding failure plane parallel to the concrete surface btfp = Width of FRP plate
df = Length of the IC debonding failure plane perpendicular to the concrete
surface
e = Distance from the point of CDC crack initiation to the resultant of loads applied over LO
e = Base of the natural algorithm
Ec = Elastic modulus of concrete
Efrp = Modulus of elasticity of FRP plate or strip f’c = Concrete cylinder compressive strength fct = Tensile strength of concrete
Fp = Axial force induced in the FRP plate due to bending Fps = Applied prestressing force
ftef = Effective tensile strength of concrete Ga = Shear modulus of epoxy adhesive
h = Beam depth
hp = FRP plate depth
hpcmp = Distance from the centroid of the composite section to the centroid of the
FRP plate
hs = FRP strip depth
hs,cmp = Distance from the centroid of the composite section to the centroid of the
FRP strip
Icr = Cracked moment of inertia of the transformed strengthened section Ieff = Effective moment of inertia
Ig = Gross moment of inertia of the transformed strengthened section J = Constant defined by the axial rigidity and geometric properties of a pull
test joint
KM,KW = Ratios of the applied moment and load within LO respectively, to the
shear at the beam end
Lcrit = Critical length to develop full IC debonding resistance
LO = Distance from the point of CDC crack initiation to the nearest beam
support
lo = Distance from a beam support to the nearest plate end Lper = IC debonding interface failure plane length
lr = Axial shear stress resisting length Ma = Applied moment
Mcmp = Moment on the composite section
Mc = Moment in concrete section calculated at the end of the FRP strip Mcr = Cracking moment of concrete section
Mcs = Moment on the composite section calculated at the end of the FRP strip Mp = Moment on the FRP plate
MRC = Moment on the concrete section
Ms = Moment in FRP strip calculated at the end of the strip P = Applied concentrated load
PIC = IC debonding resistance
Pplate = Lesser of the IC debonding capacity of the plate and the ultimate tensile
capacity of the FRP plate
ta = Thickness of adhesive layer
tb = Additional assumed breadth of IC debonding plane to either side of FRP td = Additional assumed depth of IC debonding plane above FRP
tp = FRP plate thickness ts = FRP strip thickness
ttfp = Thickness of tension face FRP plate
Vc = Code-given shear capacity of the concrete section alone Vexp = Experimental CDC debonding shear
Vs = Code-given stirrup shear strength
x = Distance measured along an FRP plate or strip from different points depending on the model
yeff = Distance from FRP strip to the neutral axis of the section
αp = 1 for mean confidence limit
ΔVc = Difference between the plated and the unplated CDC debonding shear
δ = Slip between the plate and the concrete on a pull test
δmax = Maximum slip between the plate and the concrete on a pull test
εp = Strain at the centroid of FRP plate
1. Introduction
1.1. Background
It is a well-known fact that maintaining aging infrastructure operational and safe while complying with economic, environmental and time constraints, currently poses a great challenge to engineers worldwide. These constraints call for more efficient solutions than the total or partial replacement of a structure.
One of such solutions has proven to be strengthening with externally bonded fiber-reinforced polymers (FRP), for either bending or shear in flexural members or as confinement in compression members. For the case of strengthening of flexural members, although the technique has been successfully used in field applications, externally bonded FRP has drawbacks that may limit its use under certain conditions, such as the tendency to debond at low strains, meaning a less efficient use of the material, lengthy preparation of the concrete surface prior to installation of the FRP, exposure of the FRP to the elements and vandalism, and possible interference with floor or pavement finishes.
However, as the NSM is a relatively recent strengthening technique, its behavior under certain failure conditions is not yet fully understood, and the existing analytical models to predict the debonding resistance of NSM strengthened sections do not cover all the possible retrofitting configurations and loading conditions that can be encountered in field applications.
Considering the many advantages and superior performance that the NSM technique has proven to have, completing the theoretical foundation to enable its safe and efficient application in the field would be of great benefit to the civil engineering industry.
1.2. Objectives
The objectives of the research presented in this thesis are:
1. Evaluate the performance of the theoretical models applicable to the debonding resistance of NSM FRP strips currently available in the literature, and identify the most outstanding gaps in knowledge.
2. Based on the findings of the previous objective, formulate a rational model for the plate-end debonding resistance of concrete flexural members strengthened with NSM FRP strips.
1.3. Scope
1. A comprehensive literature review to identify all the currently available analytical debonding models and experimental results relevant to strengthening with NSM FRP strips.
2. Assessment of the performance of the analytical debonding models against experimental results, to identify the most outstanding gaps in knowledge. 3. Based on the findings of the previous tasks, a detailed finite element analysis
to achieve a better understanding of the plate-end debonding mechanism. 4. Formulation of a rational analytical plate-end debonding model for flexural
elements strengthened with NSM FRP strips, based on the findings of the literature review and the finite element analysis.
1.4. Thesis Layout
In addition to this introduction, this thesis comprises the following Chapters: Chapter 2 presents the findings of the literature review and of the assessment of the different debonding models against experimental results.
Chapter 3 describes the finite element models developed with the aim of studying the stress distribution around the plate-ends of NSM FRP strips.
Chapter 4 provides the details of the derivation of a new analytical model to predict the plate-end debonding strength of NSM FRP strips, and compares its performance with that of the existing theoretical models.
2. Literature Review
2.1. Introduction
This chapter presents basic information regarding beam retrofitting with fiber reinforced polymers (FRP) and describes the most broadly used techniques for strengthening of reinforced concrete beams using these materials. The fundamental modes of failure of beams retrofitted with FRP are also presented and the existing theoretical models developed to predict the different types of failure are described. Finally, the most relevant experimental results currently available in the literature are presented, followed by a thorough analysis of their results using the available theoretical models with the aim to evaluate their adequacy.
2.2. Beam Retrofitting with Fiber Reinforced Polymers
Kingdom, 10,000 concrete bridges need structural attention; in Europe, it is estimated that the repair of reinforced concrete structures due to corrosion of reinforcement costs over $600 million annually; and in Canada, the required repair costs for parking structures alone are estimated in the range of $6 billion (Hassan, 2002).
During the mid 1960’s the technique of adhesively or mechanically bonding steel plates to the faces of structural elements became very popular due to its relative low cost in comparison to the other then available retrofitting methods (Hassan 2002). Although the method performed well, and even though structures retrofitted over 30 years ago have been reported to still be performing adequately (Beber et al., 2001), the method has some drawbacks, including susceptibility of the steel plates to corrosion, costly installation due to the high weight of the plates and difficult application to curved surfaces. For these reasons, during the last twenty years, interest has grown in research and field applications of FRP as a material for strengthening structures, as its high tensile capacity and stiffness, light weight and corrosion resistance help overcome the drawbacks of strengthening with steel plates.
installation on the structure without the need for heavy equipment or extensive labor, while having much higher corrosion resistance than steel plates. Some durability issues regarding the application of FRP for civil structures are yet to be further investigated, including the degradation of the FRP itself and loss of bond strength due to exposure to ultraviolet radiation, moisture, high temperatures and high pH environments (Chin et al., 1997; Hassan, 2002).
FRP composites are formed by fibers embedded in a resin matrix which binds the fibers together. Typically two types of fibers are used for retrofitting, glass fiber (GFRP) and carbon fiber (CFRP). Polymeric resins are used as both the matrix of the FRP and as the adhesive for bonding FRP to concrete (Teng et al., 2001). The tensile strength of these resins is much higher than that of concrete, such that in properly retrofitted structures failure invariably occurs in the concrete adjacent to the bonded surface. As shown in Figure 2.1, both GFRP and CFRP generally fracture at strains well below the fracture strain of steel but at much higher stresses. However the tensile strength and elastic modulus of CFRP are much higher than those of GFRP, so for the same tensile capacity, a CFRP laminate has a smaller cross sectional area than a GFRP laminate (De Lorenzis and Teng, 2007).
0 500 1000 1500
1 1.5
2000 2500 3000
0.5
0 2 2.5 3
CFRP
GFRP
Mild steel
Stre
ss (MP
a)
Strain (%)
Figure 2.1. Typical FRP and mild steel stress-strain curves (Teng et al. 2001)
2.3. Retrofitting Techniques
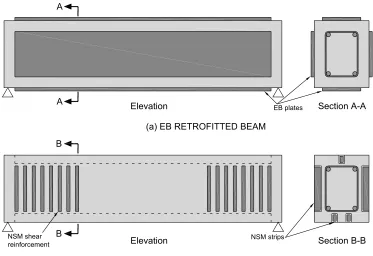
Figure 2.2 illustrates two different techniques for strengthening concrete beams; the externally bonded (EB) technique, that consists of attaching plates either adhesively or mechanically to the outer faces of a beam or slab, and the near-surface mounted (NSM) technique, in which bars or strips are adhesively bonded in grooves cut in the concrete cover. Typically the strengthening is applied to the tension face of the element, but depending on the type of strengthening required the FRP can also be attached to the compression face or to the sides of a beam for shear strengthening.
including the ACI Committee 440, the FIB (Féderation Internationale du Béton) Bulletin 14, among others. However the technique has some drawbacks that deter designers from its use under certain conditions, considerable preparation of the concrete surface prior to installing the plate is required, and as the plate is attached to the surface of the beam it makes it prone to deterioration due to weather and vandalism. It can also interfere with floor finishes or pavement construction when installed in negative moment regions. Finally, research has shown that externally bonded plates debond early at low strains, which leads to unsafe brittle failures and does not allow for the full capacity of the material to be developed. An example of this is found in El-Hacha and Rizkalla (2005), where concrete beams strengthened in flexure using EB CFRP strips with an ultimate tensile strain of 1.1% anchored at the ends with CFRP jackets, failed by debonding of the strips at an average strain in the CFRP of 0.46%.
as only dust needs to be removed from the groove prior to installing the FRP. Tests have also shown that NSM reinforcement debonds at higher strains than EB reinforcement. El-Hacha and Rizkalla (2004) tested several beams strengthened with either EB or NSM FRP plates of equivalent axial stiffness, finding that for plates of equal length EB FRP reached on average a maximum strain of 0.51%, while NSM FRP reached on average a maximum strain at failure of 1.24%.
Elevation
NSM shear
reinforcement NSM strips
Section A-A A
A
B
B
(a) EB RETROFITTED BEAM
(b) NSM RETROFITTED BEAM
EB plates
Elevation Section B-B
Figure 2.2. Typical beam retrofitting techniques
Although field applications of NSM FRP strengthening are not as common compared to EB retrofitting, the technique has already been applied with satisfactory results. In 1999 a construction error led to the necessity of strengthening a joint between a precast concrete element and a cast in situ concrete structure on a bridge. As the zone that required strengthening was to lie directly below an asphalt pavement, FRP was considered as an alternative to steel due to its corrosion resistance, and the NSM technique over EB retrofitting for simplicity of installation and for providing a safer location for the FRP to resist the expected periodical pavement resurfacing and deck sealing works, including high temperatures when pouring asphalt. The client, The Swedish Road Authority, considered the strengthening work successful and today accepts the technique as a method of strengthening concrete bridges (Taljsten et al., 2003).
Pultruded FRP composites for NSM applications are available in the form of round, square or oval bars, which can have a smooth surface or be deformed to improve the mechanical bond with the epoxy adhesive, or in the form of thin strips of different widths. In practical applications, the choice of FRP cross-sectional shape depends on the constraints imposed by the member to strengthen, such as the cover depth, and on the availability and cost of a specific shape (De Lorenzis and Teng, 2007).
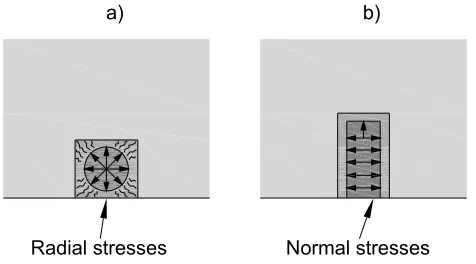
hence minimizing the bond stresses for a given tensile force. Additionally the normal stresses induced by the longitudinal bond stresses act in the case of strips mainly towards the thick lateral concrete as shown in Figure 2.3, while in round bars the radial component of the bond stresses is resisted by circumferential tensile stresses in the epoxy cover, which may lead to the formation of longitudinal splitting cracks in the adhesive and the surrounding surface layer of concrete (De Lorenzis and Teng, 2007). As a result, the higher strains that can be achieved in the FRP using strips mean increased ultimate capacity of the strengthened beam as well as increased ductility and moment redistribution capacity (El-Hacha and Rizkalla 2004; Hassan and Rizkalla 2003). For these reasons this research focuses on the behavior of NSM strips or “plates”, as they have shown to have in general superior performance than NSM round or square bars.
Radial stresses Normal stresses
a) b)
Figure 2.3. Normal bond stresses induced by a) circular bar, b) strip
this type of reinforcement in design codes (De Lorenzis and Teng, 2007), and so extensive research is still required.
Field applications and research has shown that beams strengthened with adhesively bonded plates exhibit distinctive failure modes that depend on the beam’s geometry and on the characteristics of the reinforcement used. Identifying these debonding mechanisms is essential in order to quantify the resistance of adhesively bonded plates and ultimately to design safe and reliable strengthening solutions.
2.4. Debonding Mechanisms
Three major debonding modes of failure have been identified through research and practical applications of beam and slab retrofitting with bonded plates of different materials, and will be referred to in this document as intermediate crack (IC) debonding, critical diagonal crack (CDC) debonding and plate end (PE) debonding. Different authors refer to these debonding mechanisms by different names; however they all constitute in essence the same modes of failure. Although these mechanisms were initially identified for EB plates, recent research (Smith and Teng, 2002, 2003; Teng et al., 2003) has shown that NSM FRP strips in general exhibit similar failure modes.
as the tensile strength of the adhesive used to bond the plate is much greater than that of concrete. When these cracks join and reach the plate ends, causing the strain in the plate to decrease, IC debonding is said to have taken place (Oehlers and Seracino, 2004).
P P
IC debonding crack EB plate IC crack
propagation direction
Flexural crack
Figure 2.4. IC debonding mechanism
important role in the CDC debonding capacity of a section, as once a CDC has formed, further displacement along the crack will effectively pull on the plate spanning the crack, inducing tension and cracking on the plate-to-concrete interface, much like a flexural crack induces tension on the bonded interface when IC debonding occurs. This tension induced by a diagonal crack must be resisted by the bonded length between the plate end and the diagonal crack, and therefore this length has great influence on how much resistance to CDC debonding a plate can have.
CDC debonding crack CDC crack
propagation direction
EB plate Critical
diagonal crack displacement
P
CDC
Figure 2.5. CDC debonding mechanism
P P
PE debonding crack EB plate
PE crack propagation direction
Figure 2.6. PE debonding mechanism
These three different failure modes have been observed experimentally and characterized separately to allow for their study and analytical quantification. As EB FRP typically debonds at low strains, interaction between different debonding mechanisms does not occur on members strengthened with this technique. However under certain load and support conditions on NSM retrofitted elements it is possible to have more than one failure mode acting at the same time on an element, as higher debonding strains mean cracking can develop at more than one location along the plate. Hence, care must be taken in the analysis of NSM strengthened elements, to establish whether one particular failure mode is dominating the behavior or the capacity of the structure is being affected by a combination of failure mechanisms.
2.5. Existing Design Models Applicable to NSM Strengthening
As opposed to the externally bonded retrofitting technique, for which extensive research has been carried out for over a decade now, the existing knowledge on near-surface mounted strengthening is much more limited, and hence models to predict failure on elements retrofitted with this technique are currently not available for all the identified failure mechanisms. This section presents the models currently available in the literature applicable to NSM strengthened beams for each of the three main debonding mechanisms presented in Section 2.4.
2.5.1. IC Debonding
Seracino et al. (2006) developed a unified model to predict the IC debonding resistance of beams or slabs retrofitted with any type of adhesively bonded FRP plate (EB or NSM). The model is based on experimental results of push-pull tests (which are known to provide a lower bound to the IC debonding resistance of strengthened reinforced concrete members (Oehlers and Seracino 2004)) and equilibrium and compatibility of plate-to-concrete joints of the type shown in Figure 2.7.
P
x
δ
Concrete Plate
L τ
(2.1) It has been shown (Yuan et al. 2004) that the differential equation defining the behavior of this type of joint is given by
0 ) (
2 2
=
− δ
δ
Jf dx d
where δ is the slip between the plate and the concrete, x is the distance from the unloaded end of the plate, f(δ) is a function defining the local interface shear stress-slip relationship, and J is a constant defined by the material and geometric properties of the joint. Mohamed Ali et al. (2006) and Chen et al. (2005) showed that although the typical shear stress-slip relationship f(δ) is bilinear as shown by the solid line in Figure 2.8, it can be idealized by a single softening branch as given by the dashed line in the same figure, without decrease of accuracy in the predicted debonding resistance, as δ1 is typically an order of magnitude less than δmax and the area under the two curves (which represents the fracture energy) is the same.
elastic micro-cracking debonding
bi-linear
idealized
0
τmax
τ
δ1 δmax
Figure 2.8. Shear stress-slip models of plate-to-concrete joints
(2.2) (2.3) ) ( ) ( max max
max δ δ
δ τ
δ = −
f
where τmax and δmax are the maximum shear stress and the maximum slip in the
shear stress-slip model respectively.
The key difference in the development of the unified model that would allow it to be applicable for both EB and NSM retrofitting is introduced in the derivation of the constant J, which, as opposed to the original EB model where only the geometry of the plate is considered, takes into account the geometry of the interface debonding failure plane ⎥ ⎥ ⎦ ⎤ ⎢ ⎢ ⎣ ⎡ + = c frp per EA EA L J ) ( 1 ) ( 1
where Lper is the interface debonding failure plane length as shown in Figure 2.9,
and (EA)frp and (EA)c are the axial rigidities of the plate and the concrete
components respectively. In Figure 2.9 tb and td allow for the fact that debonding typically occurs in the concrete adjacent to the adhesive-concrete interface, and is taken as 1 mm.
Lper
td
df
tb
bf
failure plane NSM plate
concrete surface NSM plate Lper td df tb bf
failure plane EB plate
EB plate
(2.4)
(2.5)
(2.6)
(2.7) Substituting Equations 2.2 and 2.3 into Equation 2.1 and solving the differential equation, and simplifying taking into account that (EA)c is far greater than (EA)frp, a
closed form solution for the IC debonding resistance PIC is produced
frp per
IC L EA
P = τmaxδmax ( )
This debonding resistance will develop provided the bonded length (L in Figure 2.7) is equal or greater to the critical length Lcrit given by
λ π
2 = crit L
where
frp per EA
L ) (
max max 2
δ τ λ =
This solution for PIC is unique in that it is applicable to either EB plates or NSM strips. Furthermore, it was proposed that τmaxδmax, which is twice the area under the
bond stress-slip curve in Figure 2.8 and hence twice the fracture energy, is a function of the concrete cylinder compressive strength f’c and the aspect ratio of the
interface failure plane defined as
f f f
b d =
(2.8)
(2.9) where df is the length of the failure plane perpendicular to the concrete surface
(depth into the concrete) and bf is the length of the failure plane parallel to the
concrete surface, as shown in Figure 2.9. φf is an important factor in the debonding
model, as it is a measure of the confinement provided by the concrete cover, and the primary reason for improved effectiveness of NSM over EB retrofitting.
Using a function in the form
n c m f f
C '
max
maxδ ϕ
τ =
a statistical analysis was undertaken using push-pull tests results to determine the constants C, m and n. The resultant optimized expression for design is given by
frp per
c f p
IC f L EA
P =α 0.85ϕ0.25 '0.33 ( )
where units are Newtons and millimeters, and αp=1 for mean predictions, allows the
prediction of the IC debonding resistance as a function only of material and geometric properties.
2.5.2. CDC Debonding
(2.10) contribution of adhesively bonded tension face plates in the CDC cracking resistance of the section. Stirrups are not taken into account for this type of failure as EB plates typically debond at very low strains, hence not allowing the steel stirrups to develop any strain.
In this method, the shear required to form the critical diagonal shear crack is first calculated as e K K L h t h b f m f b h x V W M O tfp tfp ct p tef c plate cr dat − + ⎟ ⎟ ⎠ ⎞ ⎜ ⎜ ⎝ ⎛ ⎟⎟ ⎠ ⎞ ⎜⎜ ⎝ ⎛ + + + = − 2 2
2 ( 0.5 )
2 ) ( ) ) ((
where, as shown in Figure 2.10, x is the horizontal distance from the point where the CDC crack is expected to initiate (the point of load application for the case of a point load) to a point where the crack intercepts the plate, h is the beam depth, bc is the
web width of the beam, mp is the modular ratio of the plate material stiffness to that
of the concrete Efrp/Ec, fct is the tensile strength of the concrete, btfp and ttfp are the
width and thickness of the plate respectively, (h+0.5ttfp) is the vertical distance from
the plate centroid to the point of applied load, LO is the distance from the point of
CDC crack initiation to the nearest beam support (for the case of a point load), KM
and KW are ratios of the applied moment and load within LO respectively, to the
shear at the beam end, e is any distance from the point of CDC crack initiation to the resultant of loads applied over LO (zero in the case of a point load) only in a shear
(2.11)
(2.12)
(2.13)
(2.14)
(2.15) [N and mm]
[N and mm]
[m] 3 . 0 3 / 2 ' 100 156 . 0 − ⎟ ⎠ ⎞ ⎜ ⎝ ⎛
= f h
ftef c
Figure 2.10. CDC debonding model for point load in simply supported beam
Once a CDC crack has formed, the shear force required to cause sliding along the crack for concentrated applied loads is given by
W c c plate c ps c pres u dat K h x h x h b f f f f h f f f V − ⎟ ⎟ ⎠ ⎞ ⎜ ⎜ ⎝ ⎛ − ⎟ ⎠ ⎞ ⎜ ⎝ ⎛ + ⎟ ⎟ ⎠ ⎞ ⎜ ⎜ ⎝ ⎛ ⎟⎟ ⎠ ⎞ ⎜⎜ ⎝ ⎛ = − 1 1 ) ( ) ( ) ( 4 . 0 ) ) (( 2 ' ' 4 3 2 1 σ ρ where ' ' 1 5 . 3 ) ( c c f f
f = for 5 < f’c < 60 MPa
⎟⎟ ⎠ ⎞ ⎜⎜ ⎝ ⎛ + = h h
f2( ) 0.27 1 1 for 0.08 < h < 0.7
f3(ρ)=0.15ρ+0.58 , = ×100 h b
A
c s
ρ for ρ < 4.5
x Load
Possible CDC orientation LO
EB plate
h
(2.16) h b f P h b f F f f c c plate c c ps plate c ps ' ' '
4 ⎟⎟ =1+2 +4
⎠ ⎞ ⎜⎜ ⎝ ⎛σ , h b F c ps ps = σ
where As is the total area of longitudinal reinforcement crossing the CDC, Fps is any
applied prestressing force and Pplate is the lesser of the IC debonding capacity of the
plate and the ultimate tensile capacity of an FRP plate or yield load of a metallic plate.
Plotting Equations 2.10 and 2.12 for values of x between the point of CDC initiation and the beam support for both the plated and the unplated beam yields a graphic as shown in Figure 2.11. The curves for unplated sections are calculated simply by using zero as plate dimensions and Pplate equal to zero. It can be noted
that the plating of the beam has the effect of increasing both the cracking and the sliding shear resistances of the section.
Figure 2.11. CDC debonding resistance of tension plated beams Cracking - plated Cracking - unplated
Sliding - plated
Sliding - unplated E
C
D
x Shear
Shear to cause CDC debonding
Location at which CDC cracking is likely to occur
Lcrit
Load
The dashed in Figure 2.11 lines indicate the section’s cracking and sliding capacities along the shear span. These capacities are affected by the location of the plate end, as Pplate in the sliding equation can only be developed fully beyond a
distance from the plate end equal to the IC debonding development length Lcrit, and
because the cracking shear drops to that of an unplated section beyond the plate end (point E in Figure 2.11). Hence there will be a transition zone in which the sliding shear will drop gradually from that of a plated to that of an unplated section along the development length of the plate (segment C-D in Figure 2.11). The point at which the cracking and the sliding shear capacities intersect indicates the point at which CDC debonding is predicted to form and the load at which it would occur. It must be noted that this CDC debonding capacity is affected by the previously described IC debonding capacity, which can be calculated by different methods.
Although this method was developed for EB plates, minor alterations can be made to it that reflect the different geometry of a NSM plate, in an attempt to predict the CDC debonding capacity of members strengthened using this technique. By replacing the term (h+0.5ttfp) in Equation 2.10 for (h-0.5btfp), the fact that the plate is
installed into the concrete cover is taken into account. Additionally, to make Pplate
and Lcrit consistent with NSM behavior, both terms can be calculated using the
2.5.3. PE Debonding
Review of all currently available literature indicated that two models for predicting PE debonding can be applicable to NSM retrofitted elements. They are presented in this section.
2.5.3.1. Oehlers and Nguyen
Oehlers and Nguyen (2000) formulated a PE debonding capacity model for plates bonded to the side faces of beams in bending. Although intended for EB plates, the debonding mechanism in which the model is based suggests that with minor modifications to account for an NSM type of geometry it may be applicable to plates bonded to the tension face of beams in bending.
Using mechanics principles the forces acting in a plate adhesively bonded to the sides of a beam in bending are first quantified, after which expressions are developed for the way those forces are transmitted from the concrete to the plates and for how they interact with each other. Using these expressions a model to calculate the moment capacity of the retrofitted beam is formulated and calibrated using experimental results to account for the complexities of the debonding mechanism.
(2.17) (2.18) (2.19) cmp cmp frp p RC RC EI M EI M EI M ) ( ) ( ) ( = = = φ
where MRC, Mp and Mcmp are the moments in the concrete section, the plates and the
composite section respectively, and (EI)RC, (EI)frp and (EI)cmp are the flexural
rigidities of the concrete section, the plates and the composite section respectively, the moment to cause debonding of a plate can be expressed as
cmp frp cmp p EI EI M M ) ( ) ( =
From Figure 2.12, the strain at the centroid of a plate εp is given by
φ εp =hp,cmp
where hp,cmp is the distance from the centroid of the composite section to the
centroid of the plate.
εp
A
A Section A-A Strain profile
φ Mcmp
Mcmp hp,cmp N.A.cmp N.A.p hp dc bc
tp hp
(2.20)
(2.21) The axial force induced in the plate due to bending Fp can then be expressed as
φ εp frp pcmp frp
frp
p A E EA h
F = =( ) ,
where Afrp and Efrp are the cross sectional area and the elastic modulus of the plate,
respectively. Substituting Ф from Equation 2.17 gives
cmp cmp cmp p frp p EI M h EA F ) ( ) ( , =
Now that the forces acting on the plate have been quantified, the transmission of those forces from the concrete to the plate is studied, assuming again linear elastic behavior at the ends of the plate, which are expected to be away from the high moment region of the beam. Assuming that although initially the moment on the plate is transmitted over the area hpxhp in Figure 2.13 (a), premature debonding is likely to occur at the corners of the plate and hence Mp will eventually be transmitted
on the circular area of diameter hp as shown in Figure 2.13 (b).
b) Allowing for debonding
Mcmp Mp hp hp Fp N.A.cmp N.A.p hp,cmp Premature debonding
a) Perfectly bonded
Mcmp Mp hp hp Fp N.A.cmp N.A.p hp,cmp Perfectly bonded
(2.22)
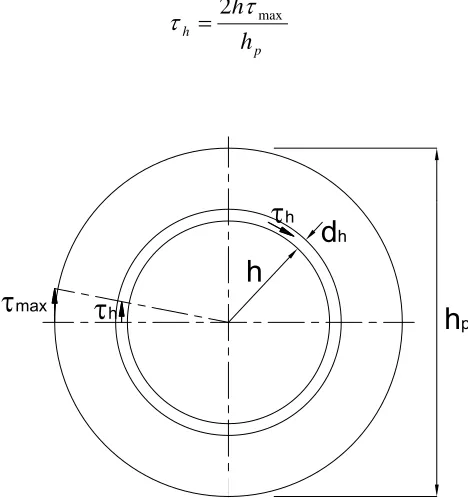
(2.23) From Figure 2.14, the shear stress τh at a distance h from the center of the
transmission zone varies linearly according to
p h
h h max
2 τ
τ =
h
pτ
maxτ
hτ
hd
hh
Figure 2.14. Distribution of bond stress resisting Mp
The differential increment in moment due toτh is then given by
p h
h dh h
hdh h
dM max
3
4 2π τ = π τ =
Integrating over the circular stress transmission area and substituting for Mp in
(2.24)
(2.25) cmp
p
frp cmp
EI h
EI M
) (
) ( 16
3 max
π
τ =
Considering now the transmission of the stresses on the interface induced by axial force on the plate, it can be seen from Figure 2.15 that the axial force Fp acts at
a distance tp/2 from the plate to concrete interface; this eccentricity induces forces Fa
normal to the interface to balance the couple Fptp/2. The couple formed by the Fa
forces must then be proportional to the plate thickness, as indicated by the distance
k1tp in Figure 2.15.
bc k2 tp
Fp
Finite element stress distribution at interface
fa tp sa fa
tp k1 tp
Fa Fa
Fsh Compressive
stress
Tensile stress
Figure 2.15. Axial force transmission model on a side plated beam (view from top of beam)
From the equilibrium of forces acting on the plate
1
(2.26)
(2.27)
(2.28) The distribution of stresses normal to the bonded interface found through finite element analyses is shown adjacent to the upper plate in Figure 2.15. It can be seen that the tensile stresses, that have a peak stress fa are concentrated over a short
distance at the plate end that is proportional to the plate thickness k2tp. Defining the
shape of the tensile stress distribution as sa, where the mean tensile stress is safa,
p p a a
a s f k t h
F =( )( 2 )
Substituting Equation 2.25 into Equation 2.26, with Fp=fptphp , where fp=Efrpεp
p frp a a k E
f = ε
Substituting Equations 2.17 and 2.19 into Equation 2.27 gives the maximum normal stress across the interface as
cmp p cmp cmp frp a cmp p frp a a h EI M E k h E k
f , ,
) ( =
= φ
Debonding of the plate is assumed to occur when the principal stress at the plate end reaches the tensile capacity of the concrete. The shear stressτsh in Figure 2.16
(2.29)
(2.30)
(2.31) hp
dc
bc
tp
fa
τmax
τsh
fa
τmax
τsh
Figure 2.16. Debonding stresses at the ends of side plates
Using Mohr’s circle to calculate the principal stress in terms of fa andτmax, and
equating it to the concrete tensile capacity fct, an expression for the debonding stress
capacity is obtained:
2 2
max (0.5 )
5 .
0 a a
ct f f
f = + τ +
Equation 2.29 can be written as
a R
a
ct f k f
f =0.5 + τmax +0.5
where kR=f(τmax, fa). Assuming kR is a constant, Equation 2.30 can be written as
max
τ
R a
ct f k
f = +
(2.32) (2.33) (2.34) (2.35) cmp p frp cmp cmp ct cmp p p B A h E M EI f h t k k , , ) ( = ⎟ ⎟ ⎠ ⎞ ⎜ ⎜ ⎝ ⎛ +
which can be written as
Y X k
kA + B =
where cmp p p h t X , = p frp ct cmp p frp cmp cmp ct E f h E M EI f Y ε = = , ) (
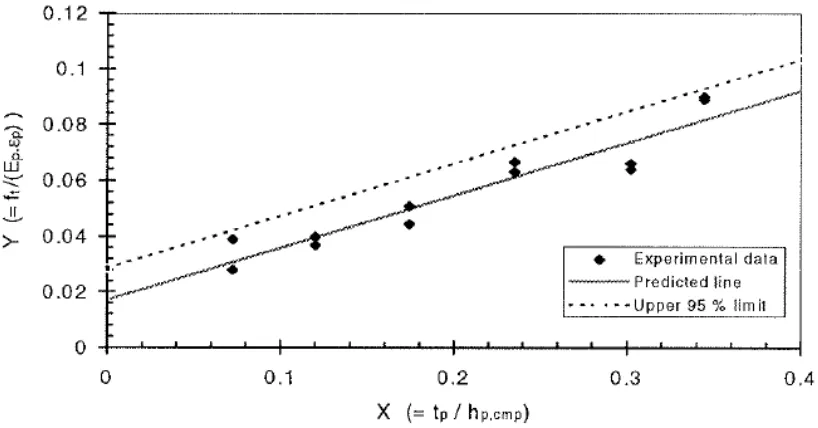
The constants kA and kB in Equation 2.33 were determined experimentally from
tests carried out by Oehlers and Nguyen on six beams in four-point bending, strengthened with short adhesively bonded side plates on both sides of different widths and thicknesses located in the constant moment region. The measured debonding moments for plates on each side of the beams were taken as Mcmp and
the specimens’ material and geometric properties used for the different variables in 2.34 and 2.35. From Figure 2.17 kA is given by the Y intercept as 0.0185 and kB is
(2.36) Figure 2.17. Experimental calibration of the mathematical model (Oehlers and Nguyen, 2000)
Substituting kA and kB into Equation 2.32 an expression for the plate end
debonding moment capacity of the side plated retrofitted beam is obtained
) 185 . 0 0185
. 0 (
) (
,cmp p
p frp
cmp ct
cmp
t h
E
EI f M
+ =
Up to this point a summary of the derivation of Oehlers and Nguyen’s PE debonding model for EB side plates has been given in this Section, with the aim of understanding how the model works. Next, the considerations made to use this model for PE debonding of NSM strips are discussed.
behavior could be made by doubling the debonding moment capacity to reflect the greater bonded area of the NSM technique.
Bonded surface EB plate
Bonded surface NSM plate
Figure 2.18. Bonded surfaces of EB side plates and NSM plates
Care must be taken when using this approach for NSM plates, as the model was calibrated experimentally for plates whose centroid was in the tensile region of the beam and at a distance from the centroid of the composite section between 0.09 and 0.43 times the effective depth of the concrete section. Typically for the applications considered in this document a NSM plate will be in the tensile region of the beam, but as plates are much narrower and closer to the extreme tension fiber of the beam, their centroid will be outside the range of distances from the centroid of the composite section for which the model was calibrated.
(2.36)
2.5.3.2. Hassan and Rizkalla
Hassan and Rizkalla (2003) proposed a model based on a combined shear-bending model introduced by Malek et al. (1998) for EB plates, but accounting for the double bonded area of NSM plates and the continuous reduction in flexural stiffness of a concrete section in bending. A summary of the derivation and use of the model is presented in this Section.
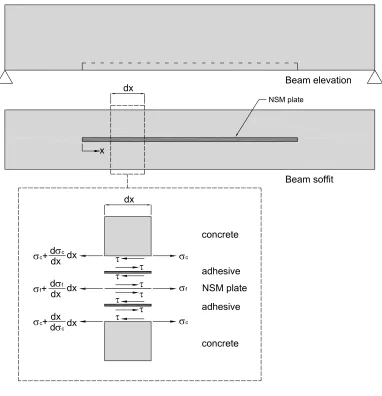
Using mechanics principles, and considering as a starting point the equilibrium of an infinitesimal section of NSM plate subject to axial tension as shown in Figure 2.19, an expression that can be used to establish the debonding capacity of the strengthened section is developed. Debonding of the plate is considered to occur due to only shear stressτ in the axial direction, and in deriving its value the stress in the concrete adjacent to the adhesive layer, σc in Figure 2.19, is taken into account, which introduces axial stress resulting from bending of the beam.
The derivation of σc is conditioned by the load configuration, and hence the final debonding stress capacity expression is specific for a certain load condition. For the case of a simply supported beam subjected to a single concentrated load the final expression for the axial shear stress on the plate to concrete interface is
⎥ ⎥ ⎦ ⎤ ⎢
⎢ ⎣ ⎡
+
= −
eff eff x
eff eff o s
I nPy e
I y nPl t
2 2
2
ω ω τ
(2.38) (2.37)
dx
dx
σc+dσc
dx dx τ σc
τ τ
τ
adhesive NSM plate
σf σf+ dσf
dx dx
concrete
σc+
dσc
dx
dx τ σc
τ
τ τ
adhesive
concrete x
NSM plate
Beam elevation
Beam soffit
Figure 2.19. NSM plate debonding model
frp s a
a E t t
G 2
2 =
ω
c frp E E n=
Ga is the shear modulus of the adhesive, ta is the thickness of the adhesive layer, ts
(2.39)
(2.40) strip and the concrete respectively, P is the applied concentrated load, e is the base of the natural algorithm, yeff is the distance from the strip to the neutral axis of the
section, lo is the distance from a beam support to the nearest plate end, x is the
distance measured from the plate end as shown in Figure 2.19 and Ieff is the
expression developed by Branson and Trost (1982)
) ( 3 ) ( 3
1 crtransformed a cr d transforme g a cr eff I M M I M M
I ⎟⎟
⎠ ⎞ ⎜ ⎜ ⎝ ⎛ ⎟⎟ ⎠ ⎞ ⎜⎜ ⎝ ⎛ − + ⎟⎟ ⎠ ⎞ ⎜⎜ ⎝ ⎛ =
where Mcr and Ma are the cracking and applied moments respectively, and Ig and Icr
are the gross and cracked moments of inertia of the transformed strengthened section respectively. By including Ieff in the model the gradual decrease in flexural
stiffness of the concrete section due to flexural cracking is taken into account.
For the case of a simply supported beam subjected to two concentrated loads the axial shear stress on the plate to concrete interface becomes
⎥ ⎥ ⎦ ⎤ ⎢ ⎢ ⎣ ⎡ +
= − x
eff o eff eff eff s e I l nPy I nPy
t ω ω
τ
2
greatest at x=0, meaning that the plate end is the most critical point and hence debonding of the plates would always be expected to initiate here.
Having quantified the shear stress on the plate to concrete interface, a failure criteria based on the concrete capacity is introduced, as the shear strength of the FRP and the adhesive is typically well above that of concrete. Knowing the compressive and tensile strength of concrete, the Mohr-Coulomb line can be represented as shown in Figure 2.20
f'ct τmax
pure tension circle
τ
pure shear circle pure
compression circle
Mohr-Coulomb line
f'c
σ
Figure 2.20. Mohr-Coulomb failure criterion
(2.41) ct
c ct c
f f
f f
+ =
' '
max
τ
where f’c and fct are the compressive and tensile strengths of concrete, respectively.
The retrofitted beam will then fail at a load P for which the shear stress given by Equations 2.36 or 2.40 equalsτmax given by Equation 2.41.
The following section presents all available experimental results on strengthening with NSM plates, and compares them with results obtained using the proposed theoretical models in order to evaluate their adequacy.
2.6. Existing Experimental Results and Evaluation of Theoretical Models
With the aim of evaluating the accuracy with which the models presented in Section 2.5 can predict the debonding resistance of a section to the different failure modes, all experimental results available in the literature of tests carried out on reinforced concrete beams strengthened with near-surface mounted FRP strips were checked against theoretical predictions.
section as shown in Figure 2.21, the strain in the concrete and steel reinforcing is determined to achieve longitudinal equilibrium maintaining εIC at the FRP plate level, using the appropriate material properties for each layer (the tensile strength of concrete was ignored). In other words, the section analysis was done assuming the flexural capacity of the strengthened sectional is governed by IC debonding of the NSM FRP strip.
Through an iterative process the neutral axis depth is found based on equilibrium of forces, and finally the applied moment on the section is calculated as the sum of moments about the neutral axis arising from the forces on the different layers that make up the beam section. Considering the load configuration of the beam, the moment at the critical section can easily be transformed into applied load for comparison with reported experimental results.
N.A. N.A.
NSM plate
εIC PIC
A
A
A
A
Section A-A distributionStrain
Forces on concrete, rebar and FRP
For specimens strengthened with FRP strips in more than one groove, the interface debonding failure plane that defines the terms φf=df/bf and Lper in Equation
2.9, was calculated both as one that covers individual NSM strips, as shown in Figure 2.22 a), and as a single failure plane encompassing all the strips such that failure occurs as a group, as illustrated in Figures 2.22 b) and c). This was done with the aim of identifying what the most appropriate approach would be, given that Seracino et al.’s model was not specific as to how φf should be defined. The area of
FRP used in Equation 2.9 was the total area of the number of FRP strips surrounded by the chosen failure plane. Once the IC debonding strain in the FRP is calculated assuming either one of the failure planes, the subsequent section analysis is carried out using the total area of FRP strengthening.
Failure plane Failure plane Failure plane bf
df df df
bf bf
c) b)
a)
Figure 2.22. IC debonding assumed failure planes for multiple strips
Equation 2.12, PIC and Lcrit from Equations 2.9 and 2.5 respectively, of the unified IC
debonding model presented in Section 2.5.1, were used. The differences in PIC and Lcrit induced by the different assumed failure planes discussed before showed to
produce negligible differences in the CDC debonding capacities of the specimens. The PE debonding capacity of the specimens was calculated theoretically using the Oehlers and Nguyen method given in Section 2.5.3.1. The specimen’s PE debonding moment capacity was calculated by direct application of Equation 2.36, and then multiplying that value by 2 to account for the double bonded area of NSM strips.
The model developed by Hassan and Rizkalla presented in Section 2.5.3.2 was also used to calculate failure loads for the different specimens. Through this method the interfacial shear stress was calculated for different applied loads, using either Equation 2.36 or Equation 2.40 depending on the load configuration of the specimen, and then compared with the failure criteria given by Equation 2.41; the load for which the interface shear stress equaled the failure criteria indicated the plate end debonding load. In Equations 2.36 and 2.40, x was always taken as zero, because this value maximizes the calculated shear stress. An iterative process of calculating the interface shear stress for different load levels is necessary as Equations 2.36 and 2.40 are a function of the effective moment of inertia of the transformed section Ieff, which decreases as the applied moment increases. Hassan
given cross section is always found to take place at the plate end, where x equals zero. In the following sections the experimental programs most relevant to NSM strengthening available in the literature are summarized, and their results used to assess the adequacy of the existing debonding analytical models.
2.6.1. Hassan and Rizkalla
Hassan and Rizkalla (2003) tested nine 2.5 m span reinforced concrete T beams of cross-section and reinforcement as shown in Figure 2.23, eight of which were strengthened with a single 1.2x25 mm NSM CFRP strip of varying length bonded into a 5x25 mm groove in the tension concrete cover, while one was tested without FRP reinforcement for reference. The beams’ cross-section and reinforcement were designed to induce flexural failure at midspan and to avoid concrete crushing failure at low applied loads.
Table 2.1. Hassan and Rizkalla test results
Beam Strengthened
length (mm) load (kN) Failure Failure strain in FRP (%) Failure mechanism
B8 2400 80 1.31 FRP rupture
B7 2100 80 1.29 FRP rupture
B6 1900 75 1.28 FRP rupture
B5 1700 79 1.27 FRP rupture
B4 1500 74 1.18 Debonding at both ends of the strip and at midspan. Final debonding controlled by plate end debonding
B3 1000 60 0.71 Debonding at both ends of the strip and at midspan. Final debonding controlled by plate end debonding
B2 500 54 0.17 Plate end debonding
B1 300 53 0.049 Plate end debonding
B0 Reference 52 - Steel yielding followed by concrete crushing
it failed by FRP rupture. Further increase of the strengthened length on beams B6 through B8 showed to have little effect on the ultimate capacity of the strengthened section as it would be expected, since the failure of these beams would be governed by rupture of the FRP plate.
Table 2.2 shows experimental failure loads and theoretical debonding loads calculated using the different models identified in Section 2.6. The shaded values indicate the lowest calculated failure load (without considering the theoretical loads of Hassan and Rizkalla’s model) and hence the predicted debonding mechanism for each specimen.
Table 2.2. Hassan and Rizkalla test results analysis
Theoretical prediction Experimental results
IC CDC PE
Beam
Failure load (kN)
Failure strain (%)
Failure load (kN)
Failure load (kN)
Hassan & Rizkalla model (kN)
Failure load (kN)
Failure strain in FRP (%)
B8 66.08 1.62 116.00 812.40 FRP rupture 80.00 1.31
B7 66.08 1.62 116.00 203.10 FRP rupture 80.00 1.29
B6 66.08 1.62 116.00 135.40 FRP rupture 75.00 1.28
B5 66.08 1.62 116.00 101.55 70.00 79.00 1.27
B4 66.08 1.62 114.00 81.24 55.00 74.00 1.18
B3 66.08 1.62 110.00 54.16 37.50 60.00 0.71 B2 66.08 1.62 110.00 40.62 27.50 54.00 0.17 B1 61.70 1.42 110.00 36.93 25.00 53.00 0.05
debonding model that it is based on IC debonding of pull-push tests, which as mentioned before, provide a lower bound of the IC debonding on beams. Regarding the theoretical results for beam B4, it must be noted that although the final debonding of the CFRP strip took place at the plate ends, debonding was also observed experimentally at flexural cracks for bonded length 1000 mm and 1500 mm, which indicates that IC debonding was also likely to occur in beams B4 ad B3, hence making it difficult to discern theoretically what the debonding mechanism would be for these beams.
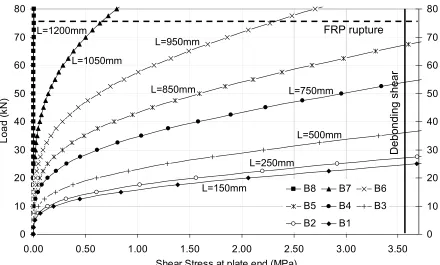
Hassan and Rizkalla’s model was developed as part of the same research from which these experimental results derived. The theoretical shear stresses calculated by Hassan and Rizkalla using Equation 2.36 for different applied loads are shown in Figure 2.24.
It can be seen from the authors’ analysis that for strengthened lengths 1700 mm and higher (L in Figure 2.24 represents the strip length measured from midspan to a strip end) the strips theoretically exceed their rupture load before reaching the predicted debonding plate-to-concrete interface shear stressτmax, and hence the
predicted failure was rupture of the FRP, which agrees with the experimental results. For strengthened lengths 1500 mm and below (beams B4 through B1), the debonding loads are the ordinates of the curves corresponding to shear stress τmax
in Figure 2.24. Compared to experimentally measured debonding loads, shown as
Pd in Figure 2.24, which are not the experimental ultimate loads from Tables 2.1 and
2.2 at which the strips detached from the beam, but the loads at which signs of debonding were first recorded, the model predictions showed to be in good agreement with the experimental results, having errors of less than 10%.
The same analysis done by Hassan and Rizkalla was carried out and the results are illustrated in Figure 2.25. Using the same theoretical FRP rupture load and debonding shear calculated by Hassan and Rizkalla, Figure 2.25 shows that FRP rupture was predicted for beams B8 through B6 but not for B5, and that compared to experimentally measured debonding loads (Pd in Figure 2.24), these predictions are
0 10 20 30 40 50 60 70 80
0.00 0.50 1.00 1.50 2.00 2.50 3.00 3.50
Shear Stress at plate end (MPa)
Lo
ad
(
kN
)
0 10 20 30 40 50 60 70 80
B8 B7 B6
B5 B4 B3
B2 B1
Figure 2.25. Theoretical shear stresses on plate-to-concrete interface from Hassan and Rizkalla’s model
2.6.2. El-Hacha and Rizkalla
El-Hacha and Rizkalla (2004) tested eight 2.5 m span reinforced concrete T beams of cross-section and reinforcement as shown in Figure 2.26. Different types of EB and NSM strengthening were applied to seven of the specimens, out of which two were strengthened using NSM CFRP strips (beams B2 and B3) and one strengthened using NSM GFRP strips (beam B4), and hence only these results were analyzed here. Test variables between these beams were the strips dimensions and strengths, although the FRP reinforcement was designed to maintain the axial stiffness (EA) of the strips constant, which according to classical beam theory would induce identical load-deflection behavior for all specimens. To achieve this, and due
FRP rupture
Debonding shear
L=150mm
L=250mm
L=500mm L=750mm L=850mm
L=950mm L=1050mm
to the different strengths of the FRP used, different numbers and sizes of strips were required. In the case of beam B4 strengthened with GFRP, five strips were installed in three grooves as shown in Figure 2.26, two bonded together in the outer grooves and one in the middle groove. All FRP reinforcement was terminated 50 mm short of the supports, hence a strengthened length of 2400 mm was constant for all specimens.
Figure 2.26. El-Hacha and Rizkalla specimen details and test set-up
Table 2.3 shows experimentally measured failure loads and strains in the FRP, as well as the failure mechanisms described by the authors and observed in photographs of the specimens after failure. It can be noted from the nearly equal failure loads that similar strengthening was achieved in the specimens by
2500 Load
A
A
300
300
150
51x51 MW5.6xMW5.6
50 50
2 No. 13 2 No. 16 2 No. 13
SECTION A-A STRENGTHENING DETAIL
B2
2 2x16 mm CFRP strips Rupture stress 1525 MPa 6.4x19 mm grooves 75
B3
2 1.2x25 mm CFRP strips Rupture stress 2000 MPa 6.4x25 mm grooves 75
B4