ISSN(Online): 2319-8753 ISSN (Print): 2347-6710
International Journal of Innovative Research in Science,
Engineering and Technology
(An ISO 3297: 2007 Certified Organization)
Website: www.ijirset.com
Vol. 6, Issue 9, September 2017
Reliability Analysis of Frames
Karthik C B1, Amit Kumar Onkar2, Manjuprasad M3, Dinesh S V4
Post Graduate Student, Dept. of Civil Engg, Siddaganga Institute of Technology, Tumakuru, India1
Senior Scientist, Structural Technological Division, CSIR-National Aerospace Laboratories, Bengaluru, India2
Cheif Scientist, Structural Technological Division, CSIR-National Aerospace Laboratories, Bengaluru, India3
Professor and Head, Dept. of Civil Engg, Siddaganga Institute of Technology, Tumakuru, India4
ABSTRACT: In this paper, reliability analysis of framedstructures are considered. Here, the uncertainties in geometry, loads and strength are considered with required distributions. The performance functions for bending stress, shear stress and deflection are derived from the finite element analysis. The performance functions are studied using Rackwitz-Fiessler algorithm and Hasofer-Lind reliability index is determined. A MATLAB program is developed for computing reliability index by using performance function and the statistical data.
KEYWORDS: Reliability Analysis; Rackwitz-Fiessler Algorithm; Reliability Index; Probability of failure.
I. INTRODUCTION
Structural reliability analysis plays an important role in the analysis and design of structures. The main purpose of structural reliability analysis is due to many sources of uncertainty in the structural design. This may be due to uncertainties in material parameters or mathematical modeling. The parameters of the load and load carrying capacity of the structures are not deterministic quantities. Every engineering structure must satisfy the safety and serviceability requirement under the service load over it, which means it must be reliable against collapse and serviceability, such as excessive deflection and cracking. A typical structural reliability analysis deals with models that are mathematical idealizations of the physical processes. The idealization requires the definition of basic variables describing the geometry, loads and material properties. In the present work, reliability analysis is carried out by considering two example problems namely a simply supported beam and a portal frame. Reliability analysis is performed using Hasofer-Lind Reliability Index method in conjunction with Rackwitz-Fiessler Algorithm (AFOSM method) and the results are compared with those obtained using Monte-Carlo simulations.
II. RELIABILITY ANALYSIS
A. Reliability
Reliability is the probability of a structure performing its intended function adequately for the period intended under the given operation conditions. Reliability can be taken as the probability of endurance and is equal to one minus the probability of failure(1-Pf). Let the resistance of the structure be R and the load on the structure to be S. The structure is
supposed to fail when R is less than S and its probability of failure is specified as
ISSN(Online): 2319-8753 ISSN (Print): 2347-6710
International Journal of Innovative Research in Science,
Engineering and Technology
(An ISO 3297: 2007 Certified Organization)
Website: www.ijirset.com
Vol. 6, Issue 9, September 2017
Fig 1. PDF of R and S[1]
µZ=µR -µS
σ2Z= σ2R - σ2S
β=µZ/ σZ
B. Hasofer-Lind Reliability Index
Hasofer and Lind proposed a new approach which linearizes the LSF about a point which lies on the failure surface and corresponds to the maximum likelihood of failure occurrences. In this method the reliability is measured through the Hasofer–Lind safety index, which is defined as the minimum distance from the origin to the failure surface in the reduced (standard normal) co-ordinate system. The limitation of this method is that it is applicable only when the random variables are normal.
C. Hasofer-Lind Reliability Index and Rackwitz-Fiessler method
Rackwitz and Fiessler extended the Hasofer and Lind approach to include the distribution information of the random variables. Compared to other optimization algorithms, this algorithm requires the least amount of storage and a lower number of computations. For most situations this method not only converges, but also converges faster. However, under certain conditions the method may fail to converge and when the limit state function is highly complex and non-linear, it may converge slowly or even result in divergence. The algorithm is as follows
1. Formulate the limit state function. Determine the probability distributions and appropriate parameters for all random variables Xi (i=1, 2,…, n) involved.
2. Obtain an initial design point { ∗} by assuming values for n-1 of the random variables Xi. (Mean values are
often a reasonable choice.) solve the limit state function g=0 for the remaining random variable. This ensures that the design point is on the failure boundary.
3. For each of the design point values ∗ corresponding to a non-normal distribution, determine the equivalent normal mean µ and standard deviation using the below equations
µ = ∗− [ ( ( ∗))] (4)
=
( ∗)φ[ ( ( ∗))]
4. Determine the reduced variables { ∗} corresponding to the design point.
∗ =
∗ µ
(5)
ISSN(Online): 2319-8753 ISSN (Print): 2347-6710
International Journal of Innovative Research in Science,
Engineering and Technology
(An ISO 3297: 2007 Certified Organization)
Website: www.ijirset.com
Vol. 6, Issue 9, September 2017
{ } = : , where =−
(6)
6. Calculate an estimate of β using the following formula.
β= { } { ∗}
{ } { }, where {
∗} = ∗ ∗ :
∗
(7)
7. Calculate a column vector containing the sensitivity factors using
α= { }
{ } { }
8. Determine a new design point in reduced variables for n-1 of the variables using
∗= β (8)
9. Determine the corresponding design point values in original coordinates for the n-1 values in step 7 using
∗=µ + ∗ (9)
10. Determine the value of the remaining random variables (i.e., the one not found in step 8 and 9) by solving the limit state function g=0.
11. Repeat step 3-10 until β and the design point { ∗} converge.
III. PERFORMANCE FUNCTION
A. Assumptions
To define the limit state function,the following assumptions are made 1. Applied load to structure consists of live and dead load.
2. Applied steel is st37.
3. Failure probability is investigated in elastic region. 4. Structure with compact section is I-shape.
B. Model for analysis
ISSN(Online): 2319-8753 ISSN (Print): 2347-6710
International Journal of Innovative Research in Science,
Engineering and Technology
(An ISO 3297: 2007 Certified Organization)
Website: www.ijirset.com
Vol. 6, Issue 9, September 2017
C. Performance function for beam
1. For bending stress mode g(M) = Fy−
.
(10)
Fy: Yield stress , L:Length of the member, w:Load, Sx: Section Modulus
2. For shear stress mode g(v) =
√ −
(11)
h: Height of the beam, tw: Thickness of the web
3. For deflection mode
g(v) = − (12)
E: Modulus of Elasticity,
D. Performance function for frame.
From fig 3,the structure and the loading conditions are symmetrical hence limit state equation for element AB is same for element DE and limit state equation for element BC is same for element CD.
1. For bending stress mode For element AB
g(M) = Fy−
( )
( )
(13)
For element BC
g(M) = Fy−
( )
( )
(14)
2. For shear stress mode For element AB
g(v) =
√ − ( )
(15)
For element BC
g(v) =
√ −
(16)
3. For Deflection mode For element AB
g(v) = − (( ( / )) ) (17)
For element BC
g(v) = − ( )
( )
ISSN(Online): 2319-8753 ISSN (Print): 2347-6710
International Journal of Innovative Research in Science,
Engineering and Technology
(An ISO 3297: 2007 Certified Organization)
Website: www.ijirset.com
Vol. 6, Issue 9, September 2017
IV. RELIABILITY ANALYSIS.
The reliability analysis is carried out based on the random variables shown in table below. Table 1 Statistical data of variables.
A. Reliability Analyisis of beam
In the below table the reliability indices of beam under various failure modes are shown.
Table 2 Failure probability of beam using AFOSM method Failure Mode Reliability Index Failure
Probability Bending Stress 4.86 2.89*10-6
Displacement 4.58 1.11*10-5
Shear Stress 8.29 4.49*10-16
Table 3Failure probability of beam usingMCS Failure Mode Reliability Index Failure
Probability Bending Stress 4.95 3.37*10-7
Displacement 5.21 9.44*10-8
Shear Stress 8.40 2.23*10-17
Reliability analysis of beam is also performed for different magnitudes of loadunder different failure modesusing AFOSM method and shown in Tables 4 -6.
Variable Unit PDF Mean COV
W kg/cm Gumble 20 0.12
L cm Log-Normal 550 0.07
Sx cm3 Log-Normal 904 0.05
E kg/cm2 Gumble 2.03*106 0.1
fy kg/cm2 Log-Normal 2400 0.1
Ix cm4 Gumble 16270 0.05
h cm Log-Normal 36 0.05
tw cm Normal 0.8 0.05
ISSN(Online): 2319-8753 ISSN (Print): 2347-6710
International Journal of Innovative Research in Science,
Engineering and Technology
(An ISO 3297: 2007 Certified Organization)
Website: www.ijirset.com
Vol. 6, Issue 9, September 2017
Table 4 Bending Stress failure mode
W β Pf Direction Cosines
αSx αL αw αFy
20 4.86 2.89*10-6 -0.24 0.53 0.44 -0.67 25 3.83 0.0002 -0.24 0.57 0.47 -0.62 30 2.96 0.0049 -0.24 0.59 0.49 -0.57 35 2.22 0.0334 -0.24 0.61 0.51 -0.54 40 1.58 0.1129 -0.24 0.62 0.52 -0.52 45 1.03 0.2345 -0.23 0.63 0.54 -0.49 50 0.53 0.3455 -0.23 0.63 0.55 -0.48
Table 5 Shear Stress failure mode
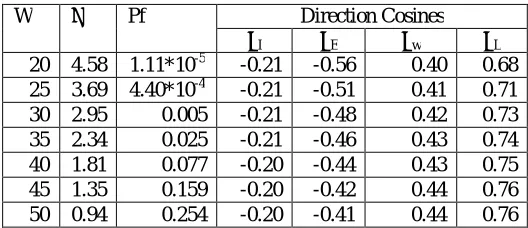
Table 6 Deflection Mode of Failure
B. Reliability Analysis of Frame
The reliability indices of frame element AB under various failure modes are given in Tables 7 and 8.
Table 7Failure Probability for element AB using AFOSM method Failure Mode Reliability Index Failure Probability Bending Stress 7.08 7.20x10⁻¹³
Displacement 8.93 2.13x10⁻¹⁹ Shear Stress 9.59 4.40x10⁻²²
W Β Pf Direction Cosines
αh αtw αw αFy αL
20 8.29 4.49*10-16 -0.09 -0.09 0.19 0.12 -0.96 25 7.81 2.22*10-14 -0.13 -0.12 0.24 0.15 -0.93 30 7.31 9.66*10-13 -0.16 -0.99 0.29 0.19 -0.90 35 6.81 3.33*10-11 -0.18 -0.18 0.33 0.22 -0.87 40 6.31 8.56*10-10 -0.20 -0.20 0.37 0.24 -0.84 45 5.83 1.58*10-8 -0.22 -0.22 0.40 0.26 -0.81 50 5.37 2.10*10-7 -0.24 -0.24 0.43 0.28 -0.78
W Β Pf Direction Cosines
αI αE αw αL
ISSN(Online): 2319-8753 ISSN (Print): 2347-6710
International Journal of Innovative Research in Science,
Engineering and Technology
(An ISO 3297: 2007 Certified Organization)
Website: www.ijirset.com
Vol. 6, Issue 9, September 2017
Table 8Failure Probability for element AB usingMCS
Similarly, reliability indices of frame element BCunder various failure modesare given in Tables 9 and 10
Table 9Failure Probability for element BC using AFOSM method Failure Mode Reliability Index Failure Probability Bending Stress 4.17 1.5x10⁻⁵
Displacement 6.50 4.01x10⁻¹¹ Shear Stress 8.36 3.13x10⁻¹⁷
Table 10 Failure Probability for element BC usingMCS Failure Mode Reliability Index Failure Probability Bending Stress 4.22 1.22x10⁻⁵
Displacement 6.58 2.35x10⁻¹¹ Shear Stress 8.41 2.05x10⁻¹⁷
V. RESULTS
Based on statistical features of random variables, failure probability for specified modes of beam is summarized as follows. Results of failure probability for assumed beam is negligible. According to Table 2, the highest failure probability corresponds to displacement and the lowest failure probability is achieved in shearing stress.In Tables 4-6,the probability of beam for the failure modes are compared. As shown in the table, the failure probability of displacement is more than bending stress for load less than 30 kg/cm. However, for load more than 30 kg/cm failure mode in bendingstress is more critical.For the frame considered, the element AB is safer than the element BC.This is because load is directly acting on the member BC. Both elements are safer for shear compared to bending and deflection.
REFERENCES
1. Achintya Haldar, Shankar Mahadevan,“ Probability, Reliability and Statistical Methods in Engineering Design”, Jhon Wiley & Sons, Inc. New York.
2. André T. Beck and André S. D, “Reliability Analysis of I-Section Steel Columns Designed According to New Brazilian Building Codes”, Journal of Brazilian society of mechanical science and engineering vol.xxx no.2, Brazil 2008, pp.152-159.
3. Bhatnagar S.D, Sehgal V.K & Krishan Gopa, “Computational Technique for Reliability Analysis and Design of Steel Beam”, International Journal of Information Technology and Knowledge Management vol.2, India, 2010, pp.511-513.
4. Fiessler. B, Neumann, H.J., and Rackwitz, R. “Quadratic Limit States in Structural Reliability”. Journal of Engineering Mechanics,ASCE, Vol. 1095. No. 4, pp.. 661-676, 1979.
5. Hamed Abshari, M. Reza Emami Azadi and Madjid Sadegh Azar, ”Reliability Analysis of Steel Structures under Buckling Load in Second-order Theory”, Advances in Research 2(12), Iran,2014, pp.950-966.
6. Manjunath G.S, Dr. K Manjunath, Sandeep Kumar D.S, “Probability Failure of Steel Structure”, International Research Journal of Engineering and Technology vol.2, India, 2012, pp.569-672.
7. Mohammad Masoud Azhdari Moghaddam & Medi Moudi, “Analysis of Beam Failure Based on Reliability System Theory Using Monte Carlo Simulation Method” International Conference on Applied Computer Science, Iran,pp.516-519.
8. OmishoreA& Kala Z, “Reliability Analysis of Steel Structures with Imperfections”, NSCC, Czech Rebublic, 2009, pp.277-298. 9. Rosenbleuth, E., and Esteva, L. “Reliability Bases for Some Mexican Codes” ACI Publication SP-31, pp.1-41, 1972.
10. Satyanarayana M.V.R., Yesuratnam G ,RavindraV, “ Study of performance evolution of reliability of truss girder railway bridge by Hasofer- Lind method”, International journal of advanced scientific and technical research vol.7, India, 2015, pp.101-114.
Failure Mode Reliability Index Failure Probability Bending Stress 7.17 3.74x10⁻¹³
![Fig 1. PDF of R and S [1]](https://thumb-us.123doks.com/thumbv2/123dok_us/1589342.1195891/2.595.216.427.154.385/fig-pdf-of-r-and-s.webp)