Human Population Structure and Its Effects on Sampling Y Chromosome
Sequence Variation
Michael F. Hammer,*
,†,1Felisa Blackmer,* Dan Garrigan,
‡Michael W. Nachman
†and Jason A. Wilder*
*Genomic Analysis and Technology Core, Division of Biotechnology and†Department of Ecology and Evolutionary Biology, University of Arizona, Tucson, Arizona 85721 and‡Department of Biology, Arizona State University, Tempe, Arizona 85287
Manuscript received October 21, 2002 Accepted for publication April 10, 2003
ABSTRACT
The excess of rare variants in global sequencing studies of the nonrecombining portion of the Y chromosome (NRY) has been interpreted as evidence for the effects of human demographic expansion. However, many NRY polymorphisms are geographically localized and the effect of different geographical sampling on patterns of NRY variation is unknown. We use two sampling designs to detect population structure and its effects on patterns of human NRY polymorphism. First, we sequence 26.5 kb of noncoding Y chromosome DNA from 92 globally distributed males representing 35 populations. We find that the number of polymorphisms with singleton variants is positively correlated with the number of populations
sampled and that there is a significant negative correlation of Tajima’sD(TD) and Fu and Li’sD(FD)
statistics with the number of pooled populations. We then sequence the same region in a total of 73 males sampled from 3 distinct populations and find that TD and FD values for the 3 pooled and individual population samples were much less negative than those in the aforementioned global sample. Coalescent simulations show that a simple splitting model of population structure, with no changes in population size, is sufficient to produce the negative values of TD seen in our pooled samples. These empirical and simulation results suggest that observed levels of NRY population structure may lead to an upward bias in the number of singleton variants in global surveys and call into question inferences of population expansion based on global sampling strategies.
P
ATTERNS of genetic variation within and among under weak purifying selection;Tajima1989a;Fuand Li1993;Braverman et al. 1995).human populations contain information about the
Two standard test statistics, Tajima’s D(TD;Tajima origin and demographic history of our species. The bulk
1989a) and Fu and Li’sD* (FD;FuandLi1993), mea-of the evidence from nuclear and mitochondrial DNA
sure whether the observed frequencies of segregating studies has been claimed to support a recent African
mutations are compatible with the frequencies expected origin of anatomically modern humans (Cann et al.
under the standard neutral model. Population growth, 1987;Vigilantet al. 1991;Batzeret al. 1994;
Cavalli-directional selection, or the presence of weakly deleteri-Sforza et al. 1994; Tishkoff et al. 1996; Hammer et
ous mutations may lead to an excess of low-frequency al. 1998;Underhillet al. 2001). However, contrasting
variants and negative TD and FD values, while popula-views of human demography have emerged from
analy-tion contracanaly-tion and balancing selecanaly-tion may cause an ses of different components of the genome. Early work
excess of intermediate-frequency variants and positive on mtDNA suggested that human populations expanded
TD and FD values (Tajima1989a;FuandLi1993). As in size from a small initial population (Di Rienzoand
the number of published human nuclear DNA
sequenc-Wilson 1991; Rogers and Harpending 1992;
Har-ing data sets grows, a consensus frequency distribution
pending1994). The mtDNA data exhibited an excess
pattern has not yet emerged. Many nuclear loci show of rare mutations over neutral equilibrium expectations,
TD values that are positive or close to zero and, hence, which could be a signature of recent population growth
do not provide support for a population expansion from (SlatkinandHudson1991). Alternatively, this pattern
a small initial size (Harding et al. 1997; Hey 1997; could result from the action of natural selection (e.g.,
Zietkiewiczet al. 1998;HarrisandHey1999; Nach-linkage to a site under directional selection or to sites
manandCrowell2000;Przeworskiet al. 2000;Koda
et al.2001;Martinez-Ariaset al.2001;Nachman2001; Pluzhnikovet al. 2002). However, negative TD values at
This article is dedicated to the memory of David C. Rowe.
other loci have been interpreted to support the mtDNA-1Corresponding author:Biosciences West Bldg., Department of
Ecol-based population expansion hypothesis (Kaessmannet
ogy and Evolutionary Biology, University of Arizona, Tucson, AZ
85721. E-mail: [email protected] al. 1999;Shen et al.2000;Alonso andArmour 2001;
Stephens et al. 2001; Thorstenson et al. 2001; Yu et problem with this interpretation is that most NRY poly-morphisms tend to be geographically localized (Job-al.2001).FayandWu(1999) have shown that simple
ling and Tyler-Smith 1995; Seielstad et al. 1998;
changes in population size may lead to radically
differ-Hammeret al. 2001) and polymorphisms that occur as ent frequency spectra for markers with different
effec-singletons in global studies are often later found at tive population sizes, such as mtDNA and autosomes.
intermediate frequencies in SNP genotyping surveys of Nevertheless, it has been suggested that there is too
larger samples from individual populations (Hammer much heterogeneity in frequency spectra among loci to
et al. 2001). Furthermore, the NRY exhibits one of the be compatible with either the standard neutral model
highest levels of among-group variance and population or a simple long-term exponential growth model
(Har-structure of any known human genetic system (Hammer
pending and Rogers 2000; Przeworski et al. 2000;
et al. 2001;Romualdiet al. 2002). For this reason,
cau-WallandPrzeworski2000).
tion is required when interpreting patterns of NRY varia-One of the problems associated with interpreting
tion on the basis of the assumption of panmixia. these patterns of human DNA variability concerns the
Our purpose here is to examine sequence variation sampling strategies employed by different investigators.
on the NRY using both global and population-based Current sampling schemes vary between two extremes:
sampling designs to assess the effects of population global sampling, in which a small number of individuals
structure and/or population growth on patterns of NRY from many different populations are used in sequencing
diversity. First, we sequence 26.5 kb of noncoding DNA surveys, and population-based sampling, in which larger
from the Y chromosomes of 92 globally distributed numbers of individuals from fewer populations are
se-males, and then we sequence the same region from a quenced. It is important to ask to what degree different
sample of 73 males drawn from three distinct popula-sampling designs lead to increased variance in observed
tions: the Khoisan from Africa (n ⫽ 25), the Khalkhs patterns among loci. Recently, Ptakand Przeworski
from Mongolia (n⫽24), and Papua New Guinean high-(2002) found evidence that summaries of the allele
fre-landers (n⫽24). The results are consistent with substan-quency spectra at a large number of autosomal and
tial levels of population structure and suggest that global X-linked loci are affected by sampling design. For
exam-sampling designs may bias NRY sequence surveys toward ple, they found that surveys that sample few individuals
an excess of polymorphisms with singleton variants. from many localities recover more rare alleles than
those that sample many individuals from few localities. Despite the intense interest in the nonrecombining
por-SUBJECTS AND METHODS tion of the Y chromosome (NRY) for inferring human
demographic history, there have been no analyses of Subjects:DNA sequences were screened for polymor-the effect of sampling design on observed patterns of phism in two sampling panels. Panel A included a sam-variation. The NRY has the lowest level of polymorphism ple of 92 human males, including 28 from Africa (10 of the 24 human chromosomes (International SNP Khoisan, 6 East Bantu, 5 West Bantu, 3 Mbuti, 2 Biaka,
Map Working Group 2001). Estimates based on se- 1 Ethiopian, and 1 Egyptian), 13 from the Americas (3
second was based on a global panel of 57 males (17 sub- site. Tajima’sD(Tajima1989a) and Fu and Li’sD(Fu andLi1993) were calculated to test the observed muta-Saharan Africans, 15 Asians, 11 Europeans, 7 Native
Americans, and 7 Oceanians;Hammeret al. 2001). All tion frequency distribution for deviations from neutral expectations. Analysis of molecular variance (AMOVA) sampling protocols were approved by the Human
Sub-jects Committee at the University of Arizona. taking into account the number of mutational differ-ences among haplogroups and exact tests of population PCR amplification and mutation detection:Panels A
and B were screened for NRY polymorphism using two differentiation (Raymondand Rousset1995) were car-ried out using the ARLEQUIN computer application different approaches. Denaturing high-performance
liquid chromatography (DHPLC) was used to screen (Schneideret al. 2000).
Computer simulations: To distinguish the expected for polymorphisms in the following regions on the NRY:
(1) 11.3 kb of the arylsulfatase D pseudogene (ARSDP; contributions of population structure, growth, and sam-pling design on patterns of NRY variation, we simulated GenBank accession no. AC002992), (2) two Y␣5 Alu
elements within the 16E4 and 486,O,2 clones (GenBank samples according to three different models of the neu-tral coalescent process. To begin, we examined the ef-accession nos. AC003094 and AC002531, respectively),
and (3) four noncoding regions originally identified in fect on TD of the sample size taken from an exponen-tially growing panmictic population, for sample sizes up anonymous clones used as probes to detect restriction
fragment length polymorphism variation on the NRY to 600 chromosomes. Second, we examined the effect on TD of the number of demes sampled from a finite of humans and great apes (AllenandOstrer1994).
These regions (referred to as anonymous clone regions) island model of population structure (Maruyama1970), both with and without population growth. Lastly, we include 1.3 kb within clone 4-1 (DYS188), 1.1 kb in
clone 3-1 (DYS189), 1.1 kb in clone 3-11 (DYS190), and employed a model of population structure in which pairs of populations share common ancestry in a hierar-1.5 kb in clone 3-8 (DYS194).DYS194is present on the
NRY in four copies andDYS190 is duplicated. A total chical fashion, with no migration between demes. This last model will be called the population bifurcation ofⵑ10.6 kb of anonymous clone region sequence was
analyzed. Sequence information from these regions was model. We also examined the effect on TD of the num-ber of demes sampled from the population bifurcation used to design primers to amplify shorter fragments
for DHPLC analysis. Internal primers (available from model, both with and without growth.
For each model of population structure, the number authors upon request) were used to generate
overlap-ping products for DHPLC analysis and for automated of sampled demes varied between 5 and 35. No unsam-pled demes were included in the model. For each of DNA sequencing.
All PCR products producing chromatograms with these sampling schemes, an additional level of sampling effect was examined, which includes (1) sampling only profiles differing from those of the homoduplex
con-trols were subjected to DNA sequencing. DNA sequenc- 2 haploid individuals from each deme and (2) sampling 20 haploid individuals per deme. A two-phase model of ing was performed by standard procedures to identify
mutations that altered mobility in DHPLC chromato- population growth was implemented by assuming that the onset of growth occurred 103 generations in the grams. We were extremely conservative in choosing
products for DNA sequencing so as to identify and con- past (tg⫽103). Before timetg, the population is assumed to be stationary in size, atN ⫽ 103 (N is the effective firm all possible polymorphisms. The entire 11.3-kb
ARSDP and 10.6-kb anonymous clone regions were se- number of haploid individuals). Then, at time tg, the population grows exponentially toN ⫽105in the cur-quenced from several individuals to assess the error rate
in DHPLC. No additional polymorphisms were discov- rent generation. Gene genealogies were constructed ac-cording to the coalescent probabilities given bySlatkin ered by sequencing that were not found by DHPLC.
The following regions were amplified and subjected andHudson (1991) for a growing population. A total of 40 mutations were then added to each resulting gene-directly to DNA sequencing: (1) 2.7 kb of the YAP region
(Hammer1995) and (2) 941 bp of the region upstream alogy, according to an infinite sites model.
For the island model of population structure, both of the SRY gene (Whitfield et al. 1995). Contiguous
sequence was assembled for each individual and aligned strong (Nm⫽1.0,mis the rate of migration per deme per generation) and weak (Nm⫽10⫺3) migration were using the computer program SEQUENCHER (Gene
Codes, Ann Arbor, MI). considered. In this implementation of the island model,
mis held constant each generation and migration occurs Data analysis: Nucleotide diversity, (Nei and Li
1979), and the proportion of segregating sites,(Watt- symmetrically between all demes (Hudson 1990). To parameterize the population bifurcation model, we erson1975), were calculated using the program DNASP
(RozasandRozas1999). Under mutation-drift equilib- adopted the Bayesian approach ofWilsonet al. (2003). Under this model, the first population split occurs rium, bothandestimate the neutral parameter 2Ne
E()⫽5⫻103generations ago. The prior distribution (Hammeret al. 1997, 1998;Underhillet al. 1997;Shen et al. 2000; Underhillet al. 2001). When considering of subsequent population splitting times is jointly
uni-form over the interval (0,). Additionally, each deme values, Africans were about two to four times more diverse than non-Africans. This discrepancy was not as was assumed to constitute an equal proportion of the
total population size and these proportions were de- apparent when considering: non-Africans as a whole had higher values than Africans; however, no single scribed by a Dirichlet prior distribution. Each
simula-tion bout consisted of 1000 replicates. non-African continental region had a higher than
Africans (Table 2).
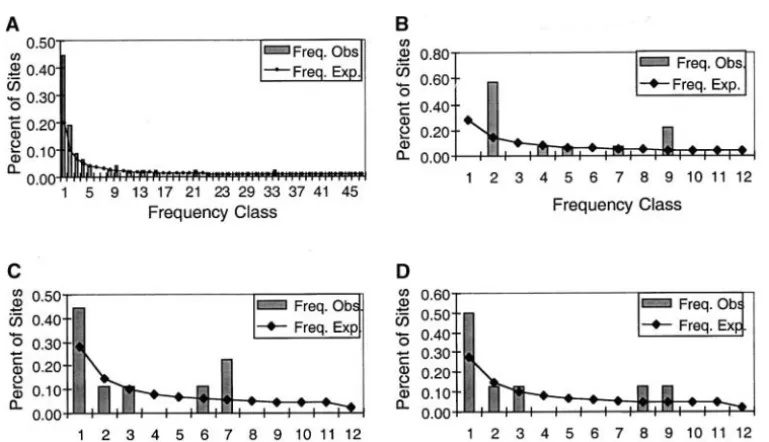
Patterns of nucleotide diversity in global samples:
RESULTS The 26.5-kb noncoding region examined here exhibited
statistically significant negative TD and FD values (P⬍
Nucleotide diversity in global samples:A total of 26.5
0.05) for the sample of 92 Y chromosomes (Table 1), kb of NRY DNA was screened for polymorphism in a
reflecting a more than twofold excess of singletons over sample of 92 globally distributed Y chromosomes. The
neutral expectations (Figure 2A). A similar observation screened regions—11.3 kb of the ARSDP, 2.7 kb of the
was made in previous studies of NRY variation using a YAP region (Hammer 1995), 941 bp upstream of the
global sampling strategy (Underhillet al. 1997;Shen SRY gene (Whitfieldet al. 1995), 994 bp encompassing
et al. 2000), although earlier studies based on fewer two Y␣5 Alu elements, and 10.5 kb of anonymous DNA
numbers of samples resulted in TD values closer to zero (AllenandOstrer1994)—were all noncoding. A total
(Hammer 1995; Whitfield et al. 1995). We noted a of 49 polymorphic sites were within the 26.5-kb
noncod-statistically significant negative correlation between TD ing region (Figure 1). Three cases of mutational
homo-values in Table 1 and the sample size of each study plasy were detected because recurrent mutations were
(r⫽ ⫺0.796,r2⫽0.634,P⫽0.010). A slightly stronger found on different NRY haplogroup backgrounds. This
negative correlation resulted when we considered the brought the total number of mutations to 52: 46 were
relationship between TD and the number of “popula-single nucleotide substitutions (SNPs), 5 were
inser-tions” sampled (r⫽ ⫺0.843,r2⫽0.711,P⫽0.004). No tion/deletion of a single nucleotide (indels), and 1 was
significant correlation was observed between TD and an insertion of an Alu element (YAP;Hammer1994).
the length of the region surveyed (P⫽ 0.40). Nucleotide diversity ( ⫾ SD) values varied slightly
To further address the relationship between the fre-across the five noncoding regions (ARSDP, 0.009 ⫾
quency distribution and the number of populations sur-0.001%; YAP, 0.018 ⫾ 0.004%; SRY, 0.015 ⫾ 0.005%;
veyed, we measured variation within each continental anonymous DNA, 0.010 ⫾ 0.001%), with the highest
region separately for the 92 Y chromosomes in this sur- value observed for the Y␣5 Alu elements (0.088 ⫾
vey (Table 2), as well as in the published survey ofShen 0.009%). Nucleotide diversity for the entire 26.5-kb
re-et al. (2000). We calculated TD and FD for the total gion was 0.014⫾ 0.001%, a value very similar to
esti-sample, for combined non-Africans, and for each conti-mates based on other global NRY polymorphism surveys
nental region (i.e., Africans, Asians, Europeans, Ocea-(Table 1). This suggests that the methods used to detect
nians, and Native Americans). For each of these five NRY polymorphisms (DHPLC and direct DNA
sequenc-NRY regions (26.5 kb, SMCY, DFFRY, DBY, and UTY1), ing of PCR products) are comparable. For example, if
a negative correlation between TD or FD and the num-DHPLC were actually less efficient at detecting
polymor-ber of populations sampled was observed. For the 26.5-phism, we would expect studies based on this method
kb region reported here (Figure 3, A and B), as well as to yield a lower proportion of singletons. In fact, the
for three of the four genes reported byShenet al. (2000) studies that used DNA sequencing did not find a higher
(excluding DFFRY), FD produced a more significant proportion of polymorphisms with singleton variants
negative correlation than did TD (data not shown). For than the studies based on DHPLC. This supports earlier
three of the five regions (26.5-kb noncoding, SMCY, studies demonstrating the high sensitivity and low error
and DBY), there was a statistically significant negative rate of DHPLC (O’Donovanet al. 1998).
correlation between FD and the number of populations Levels of nucleotide variability were generally higher
analyzed (e.g.,Pⱕ0.01), while the correlations for the in African than in non-African populations (Table 2),
consistent with other studies of NRY SNP variation other two regions (DFFRY and UTY) were marginally
Figure1.—Polymorphic sites in 26.5 kb of noncoding DNA on 92 Y chromosomes from Africa, Europe/Middle East, Asia,
Oceania, and the Americas. Numbering at the top of the figure indicates the position of each polymorphic site in reference to
the following sequences: (1) arylsulfatase pseudogene (ARSDP); (2) anonymous (AllenandOstrer1994) clones 4-1 (DYS188),
3-1 (DYS189), 3-11 (DYS190), and 3-8 (DYS194); (3) Y␣5 Alu elements within the 16E4 and 486,O,2 clones, respectively; and (4)
2.6-kb YAP sequence (Hammer1995), SRY gene region (Whitfieldet al. 1995). Nucleotide positions at the two Y␣5 Alu sequences
are defined in reference to base positions after the 3⬘end of sequencing primers designed to the clone sequences AC003094
statistically significant (e.g., P ⫽ 0.05 and P ⫽ 0.06, respectively; data not shown). When all five regions were combined (Figure 4), the correlation between FD and number of populations sampled was highly statistically significant (r ⫽ ⫺0.756, r2 ⫽ 0.577, P ⬍ 0.0001). A nonparametric Spearman rank correlation test also found a statistically significant monotonic decrease be-tween FD and the number of populations sampled (r⫽ ⫺0.8005,T⫽ ⫺7.56,P⬍0.0001). Despite these clear patterns, it is important to point out that not all the data points in Figures 3 and 4 are independent since some of the small samples are subsets of the larger samples.
Patterns of nucleotide diversity in population sam-ples:To discern the effects of sampling on patterns of human NRY nucleotide diversity, we sequenced the same 26.5-kb noncoding region on the Y chromosomes of 73 males representing three distinct populations: the Khoisan of Namibia (n ⫽ 25), Papua New Guinean highlanders (n⫽24), and Mongolian Khalks (n⫽24). In the total sample, we identified 30 SNPs and 3 indels (Figure 5). The nucleotide diversity in this sample ( ⫽ 0.014⫾0.001%) was almost identical to the for the global survey of 92 chromosomes. However, singletons (s ⫽ 10) made up a smaller proportion (33.3%) of the segregating sites within populations than within the global sample (s⫽24 or 47.1%). This was reflected in less negative and statistically nonsignificant TD and FD values in the combined sample of 73 chromosomes (P⬎ 0.10; Table 3). The three populations each exhibited different frequency distributions (Figure 2, B–D). The Khoisan had no singletons and several intermediate-frequency sites, while 7 of 11 of the Mongolian polymor-phisms were singletons and only 2 were at intermediate frequency. The Papua New Guinean (PNG) frequency distribution was characterized by a lower percentage of singletons (4 of 9 polymorphisms), 2 intermediate-frequency sites, and 1 high-intermediate-frequency polymorphism. All TD values were slightly or moderately negative, rang-ing from⫺0.007 (P⬎0.10) in the Khoisan to⫺0.701 (P⬎0.10) in the Mongolians, but none was statistically significant (Table 3). In contrast, the FD value for the Khoisan was positive and statistically significant (FD⫽ 1.51,P⬍ 0.02), signifying a deficiency of singletons.
Population structure: In the population-based sam-ple, only 4 of the 23 nonsingleton polymorphisms and a single NRY haplogroup were shared among the popu-lations (Figure 5). Two polymorphisms were shared among all three populations, 1 SNP was shared between PNG and Mongolians, and 1 indel (YAP) was shared between the Khoisan and Mongolians. While this low number of shared polymorphisms/haplogroups relative to exclusive polymorphisms is suggestive of NRY popula-tion structure, two addipopula-tional analyses supported the hypothesis of strong population structure. AMOVA re-vealed that 43% of the total variance was partitioned among populations (⌽ST⫽0.43;P⬍0.00001) and
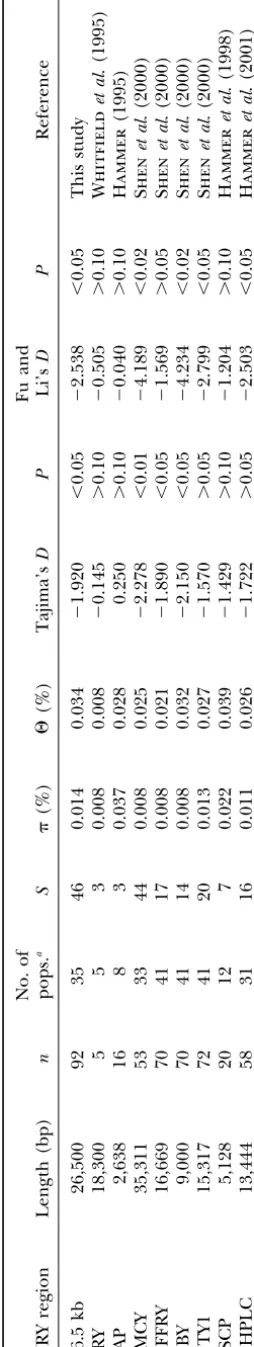
popu-TABLE 1 Nucleotide p olymorphism on the NRY No. of Fu and NRY region L ength (bp) n pops. a S (%) ⌰ (%) T ajima’s DP Li’s DP Reference 26.5 kb 26,500 92 35 46 0.014 0 .034 ⫺ 1.920 ⬍ 0.05 ⫺ 2.538 ⬍ 0.05 This study SRY 18,300 5 5 3 0 .008 0.008 ⫺ 0.145 ⬎ 0.10 ⫺ 0.505 ⬎ 0.10 Whitfield et al . (1995) YAP 2,638 1 6 8 3 0 .037 0.028 0.250 ⬎ 0.10 ⫺ 0.040 ⬎ 0.10 Hammer (1995) SMCY 35,311 53 33 44 0.008 0 .025 ⫺ 2.278 ⬍ 0.01 ⫺ 4.189 ⬍ 0.02 Shen et al . (2000) DFFRY 16,669 70 41 17 0.008 0 .021 ⫺ 1.890 ⬍ 0.05 ⫺ 1.569 ⬎ 0.05 Shen et al . (2000) DBY 9,000 7 0 4 1 1 4 0 .008 0.032 ⫺ 2.150 ⬍ 0.05 ⫺ 4.234 ⬍ 0.02 Shen et al . (2000) UTY1 15,317 72 41 20 0.013 0 .027 ⫺ 1.570 ⬎ 0.05 ⫺ 2.799 ⬍ 0.05 Shen et al . (2000) SSCP 5,128 2 0 1 2 7 0.022 0 .039 ⫺ 1.429 ⬎ 0.10 ⫺ 1.204 ⬎ 0.10 Hammer et al . (1998) DHPLC 13,444 58 31 16 0.011 0 .026 ⫺ 1.722 ⬎ 0.05 ⫺ 2.503 ⬍ 0.05 Hammer et al . (2001) n , number of chromosomes; S , number o f segregating sites. aNumber o f populations or ethnic groups.
TABLE 2
Amount and distribution of polymorphism within 26.5 kb by geographic region
No. of Fu and
Population pops. n S (%) ⌰(%) Tajima’sD P Li’sD P
All samples 35 92 46 0.0135 0.0341 ⫺1.920 ⬍0.05 ⫺2.638 ⬍0.05
Africans 7 28 20 0.0167 0.0194 ⫺0.505 ⬎0.10 ⫺0.702 ⬎0.10
Non-Africans 28 64 27 0.0085 0.0215 ⫺1.916 ⬍0.05 ⫺2.294 ⬎0.05
Asians 11 23 13 0.0066 0.0133 ⫺1.774 ⬎0.05 ⫺1.339 ⬎0.10
Europeans 7 20 10 0.0086 0.0107 ⫺0.683 ⬎0.10 ⫺0.491 ⬎0.10
Oceanians 3 8 6 0.0069 0.0083 ⫺0.740 ⬎0.10 ⫺0.285 ⬎0.10
Native Americans 7 13 6 0.0040 0.0073 ⫺1.685 ⬎0.05 ⫺1.801 ⬎0.10
were significantly differentiated (P⬍0.00001; data not significantly deviates from zero, even when the popula-tion experiences growth. Weak migrapopula-tion (Nm⫽10⫺3) shown). The⌽STvalue for the 92 global samples grouped
by continent was lower (⌽ST⫽0.32), but still statistically in the island model produced simulated samples with positive TD values for each sampling protocol exam-significant (P⬍ 0.00001).
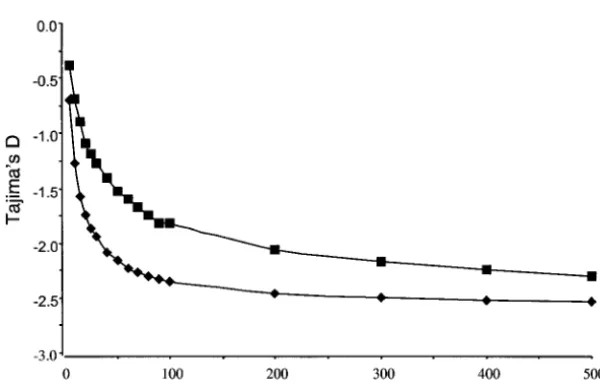
Computer simulations:Coalescent simulation of sam- ined, thus countering the tendency of population growth to make TD negative. Although TD decreased ples drawn from a panmictic population experiencing
exponential growth showed a dependence of TD on as a function of the number of demes sampled when migration is weak (Figure 7, C and D), the values never sample size (Figure 6). When the onset of growth
oc-curred attg ⫽103generations in the past, TD was less became negative.
The population bifurcation model did produce TD negative compared withtg⫽ 5⫻103generations ago.
The rate of decrease of TD is initially high, and then values that became increasingly negative as samples were pooled from an increasing number of demes. When TD begins to asymptote for sample sizes⬎100
chromo-somes. When samples are divided into varying numbers only two samples per deme were simulated, the mean TD was almost always negative and it became signifi-of demes, the results systematically differ between the
two models of population structure. Pooling samples cantly negative when the number of demes pooled was ⬎15 (Figure 8A). The only effect of population growth generated by coalescent simulation of the island model
of population structure did not produce the effect of in this case was to decrease the values of TD slightly. When 20 chromosomes per deme were sampled, TD an increasingly negative TD, either for 2 sampled
chro-mosomes per deme (Figure 7, A and B) or for 20 chro- still became more negative as a greater number of demes were pooled (Figure 8B). When the total population mosomes per deme (Figure 7, C and D). When
migra-tion in the island model is strong (Nm⫽1.0), TD never size remained constant, TD never significantly differed
Figure2.—Frequency
Figure 3.—Scatterplots
of Tajima’s D and Fu and
Li’sD vs.number of popula-tions analyzed for the 26.5-kb noncoding region. (A)
TD and (B) FDvs.number
of populations in the global sample of 92 chromosomes, for combined non-Africans and for each continental
re-gion (i.e., Africans, Asians,
Europeans, Oceanians, and Native Americans). (C) TD
and (D) FDvs.number of
populations in the sample of 73 chromosomes from
three populations (n⫽3),
for pairwise combinations
of populations (n⫽2) and
for each population (n⫽1;
Khoisan, Papua New Guin-eans, and Mongolians).
from zero. However, when growth occurred, the values samples. Shenet al. (2000) surveyed an average of 15 of TD from a sample of 20 chromosomes per deme kb from each of four genes on the NRY in global samples were nearly identical to the values when 2 chromosomes of 53–72 males and found TD values that were
consis-per deme were sampled. tently negative (TD⬍ ⫺1.5) and statistically significant
(P ⬍0.05; Table 1; Figure 1). Here we screened 26.5 kb of noncoding NRY DNA for polymorphism in a global
DISCUSSION panel of 92 chromosomes and also found a statistically
significant negative TD value (P ⬍ 0.05). Moreover, This study was motivated, in part, by the observation
we demonstrate that TD and FD values are negatively that patterns of NRY sequence variation differ according
correlated with sample size and the number of popula-to sampling strategy. For example, early studies of Y
tions sampled, but were not correlated with the length chromosome polymorphism, based on sample sizes
rang-of region examined. ing from 5 (Whitfield et al. 1995) to 16 (Hammer
Under the standard neutral model, the average value 1995), yielded TD values close to zero (Table 1). As
of TD or FD does not depend on sample size and has technology to screen the NRY for polymorphisms
be-an expectation of approximately zero (Tajima 1989a; came more efficient (Underhill et al. 1997), longer
lengths of DNA were screened in larger numbers of FuandLi1993;Simonsenet al. 1995;Fu1996).
Viola-Figure4.—Scatterplot of Fu and Li’sD vs.
num-ber of populations analyzed for the combined data from the 26.5-kb noncoding region and four
NRY genes (Shenet al. 2000; see text). FD is shown
for the entire global sample, for combined
non-Africans, and for each continental region (i.e.,
TABLE 3
Amount and distribution of polymorphism within 26.5 kb in three populations
No. of Fu and
Population n pops. S (%) ⌰(%) Tajima’sD P Li’sD P
All samples 73 3 30 0.0144 0.0233 ⫺1.208 ⬎0.10 ⫺0.528 ⬎0.10
Khoisan 25 1 14 0.0140 0.0140 ⫺0.007 ⬎0.10 1.512 ⬍0.02
PNG 24 1 9 0.0075 0.0091 ⫺0.592 ⬎0.10 ⫺0.811 ⬎0.10
Mongolians 24 1 8 0.0063 0.0081 ⫺0.701 ⬎0.10 ⫺1.053 ⬎0.10
Khoisan and PNG 49 2 23 0.0161 0.0195 ⫺0.564 ⬎0.10 0.417 ⬎0.10
Khoisan and Mongolians 49 2 22 0.0146 0.0186 ⫺0.695 ⬎0.10 0.354 ⬎0.10
PNG and Mongolians 48 2 16 0.0086 0.0135 ⫺1.150 ⬎0.10 ⫺1.871 ⬎0.05
tions of any one of the assumptions of the standard cally localized (JoblingandTyler-Smith1995; Seiel-stadet al. 1998;Hammeret al. 2001). Thus, an increase neutral model may underlie the observed negative TD
and FD values. In the following sections we consider in the number of populations surveyed will tend to cause an increase in the number of singleton or rare polymor-population structure and polymor-population growth as possible
causative factors. Violations of the infinite sites mutation phisms in the global sample. Indeed, we found very high levels of NRY population structure in this study, model are unlikely to be a major concern because
paral-lel mutations are easily detected on the nonrecombin- illustrated by the very low ratio of shared to exclusive polymorphisms (Figure 5) and by our finding of highly ing portion of the Y chromosome (Hammeret al. 1998;
Underhillet al. 2001). The effects of directional selec- significant ⌽STvalues. The results of analyzing subsets (i.e., by continent) of global samples [using both our tion are theoretically similar to those of population
growth (SlatkinandHudson1991) and will be consid- present data and those of Shenet al. (2000)] support the hypothesis that global sampling leads to biased esti-ered in a separate article.
Population structure:We posit that a violation of the mates of the frequency of polymorphisms with singleton (or rare) variants.
assumption of random mating could give rise to the
observed pattern on the Y chromosome, if a small num- To further explore the effects of sampling on the frequency distribution, we sequenced the same 26.5-kb ber of individuals (e.g., 1–3) are sampled from many
locally differentiated populations. Recently, Ptakand noncoding region in a population-based sample of 24 or 25 chromosomes each from three human popula-Przeworski(2002) found that global sampling
strate-gies lead to lower TD values than do population-based tions. We found more positive overall TD and FD values for the 73 sampled chromosomes from three popula-strategies and demonstrated that the principal factor
influencing these lower TD values was the number of tions than for the globally sampled set of 92 Y chromo-somes (Table 3). The effect of accumulating singletons ethnicities (i.e., populations) pooled in a sample. The
NRY may be particularly prone to this type of sampling in the globally based sample of 92 Y chromosomes was shown by the stronger negative correlation using FDvs. effect because many NRY polymorphisms are
geographi-Figure6.—The simulated Tajima’sDas a
func-tion of the sample size taken from an exponen-tially growing panmictic population. Squares rep-resent the values when population growth is
assumed to have started 103 generations in the
past. Diamonds represent the values of TD when
growth began 5 ⫻ 103 generations in the past.
Figure7.—The variation in
simu-lated Tajima’sDvalue as a function of
the number of demes sampled under the island model of population struc-ture. For each bout of simulations, two values of the migration
parame-ter,Nm, were used (diamonds,Nm⫽
0.001; squares,Nm⫽ 1.0). A and B
show the simulated Tajima’sDvalues
when only 2 individuals per deme are taken. Values in A are for a constant size population, while those in B in-clude exponential growth (see text).
C and D show the Tajima’sDvalues
when 20 haploid individuals per deme are sampled. Values in C are for a constant size population and those in D include exponential growth.
TD as the number of subpopulations sampled increased. However, at the weak migration limit, the long waiting time for interdeme coalescent events will also lead to a This difference is due to the stronger sensitivity of FD
than of TD to singletons (FuandLi1993). In contrast, large number of shared mutations among demes. It is unclear whether TD will eventually become negative the population-based sampling of 73 Y chromosomes
produced a negative correlation with TD, but not with under the island model with a number of sampled demes similar to those typically sampled in empirical FD (Figure 3, C and D). This signifies that sampling only
1–3 individuals from many differentiated populations studies of humans. When migration is strong, there is little dependence of TD on the number of demes sam-biases the frequency distribution toward polymorphisms
with singleton variants. However, as one increases the pled or on the number of chromosomes sampled per deme (Figure 7).
number of samples per population and pools fewer
numbers of differentiated populations, the bias toward The population bifurcation model of structure did produce samples with TD values that are compatible singletons is diminished. Still, the skew toward rare
poly-morphisms may persist if there is a high ratio of exclusive with our NRY data. Simulations of the global sampling strategy under this model of population structure to shared polymorphisms.
Computer simulations were also employed simply to yielded a negative correlation between TD and the num-ber of pooled demes, whether or not growth was imple-establish that some models of population structure
could lead to the observed relationship between TD mented. Analytical work examining the predictions of this type of population structure model is scant com-and the number of populations sampled. We simulated
samples under both the finite island model of popula- pared with the island model [although see Takahata andNei(1985) orWakeleyandHey(1997)] and no tion structure and a model of population bifurcation
with no migration between demes. The island model of formal proof that this model systematically produces an excess of rare mutations is provided here apart from population structure, with weak migration, primarily
produced samples with positive values of TD.Takahata the simulation results. Yet, it is clear that a hierarchical isolation model appears to provide a better fit to the (1991) showed that, at the weak migration limit, most
recent common ancestral lineages are reached quickly global NRY data than does an island model with either weak or strong migration.
within demes, while the time required for these single
ancestral lineages to coalesce between demes is deter- Population growth: Undoubtedly, human popula-tions have experienced both population growth and mined by the low rate of migration. These long waiting
times for interdemic coalescent events lead to a large population structure at some time in the past. The ques-tion is to what extent either or both of these aspects number of fixed mutations between demes and
there-fore elevate the number of nucleotide differences in the of population history left a signature on patterns of variation. Under a growth model there is a dependence total sample, as was shown initially byTajima(1989b).
When migration is weak, mutations will often be fixed of TD and FD on sample size (Figure 6; Ptak and
Przeworski2002). To determine whether population
within single demes and, as demes are pooled, TD is
TD and the number of pooled demes. Indeed, the addi-tion of growth into the two models of populaaddi-tion struc-ture that we tested did not greatly influence the results of our simulations. In the island model, growth has only a negligible influence on the simulated values of TD, as can be seen by comparing Figure 7, A and C, with Figure 7, B and D, respectively. Likewise, in the population bifur-cation model of structure, when only two chromosomes per deme are sampled, the influence of growth on TD is weak (Figure 8A). However, when 20 chromosomes per deme are sampled, the effect of growth is more pro-nounced, making TD more negative (Figure 8B). This suggests that if one wishes to distinguish the effects of population subdivision from population growth in a global sample, one must sample thoroughly within demes to obtain a robust estimate of the frequency distribution of mutations.
Implications for NRY studies:The observation of an excess of rare variants (i.e., over those expected under a neutral, equilibrium model) in global NRY data sets has played a key role in supporting the hypothesis of a human Pleistocene population explosion (Harpending
Figure8.—The variation in simulated Tajima’sDvalue as a
function of the number of demes sampled under a population et al. 1998;Harpending andRogers 2000;Shenet al.
bifurcation model of structure. A shows the simulated Tajima’s 2000;Thomsonet al. 2000). These results are
particu-D values when two individuals from each deme are drawn.
larly interesting in light of surveys of sequence variation Triangles represent data for constant size populations, while
that do not show a strong skew in the frequency spec-the data denoted by diamonds include exponential
popula-trum toward rare alleles (WallandPrzeworski2000;
tion growth (see text). B shows the simulated Tajima’sDvalues
when 20 haploid individuals per deme are sampled. Triangles Frisseet al.2001;PtakandPrzeworski2002;Marth
denote a constant size population, while the data represented et al.2003). Because of its smaller effective population
by diamonds include exponential growth.
size relative to the X chromosome and autosomes, one might expect that the NRY would be more influenced byrecent population expansion(s) (Fay andWu1999; our population-based data by subsampling pools of PtakandPrzeworski2002). The fact that the individ-demes of the same size as the individual population ual populations we surveyed do not show a statistically samples (i.e., 8 individuals from each of three popula- significant excess of rare NRY polymorphisms suggests tions and 12 individuals from each of two populations). that population subdivision (and not growth) may be This strategy helps to control for sample size as a con- responsible for the skew in the frequency spectrum of-founding variable (i.e., under a growth model) leading ten observed in global samples of NRY sequence varia-to increasingly negative TD values in pooled samples. tion.
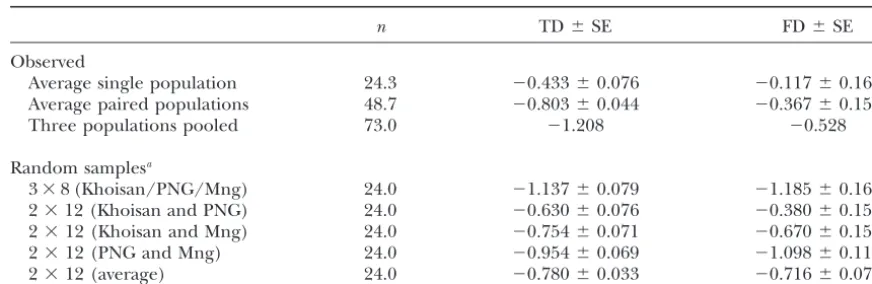
TABLE 4
TD and FD in single and pooled population samples fromn⫽73 data set
n TD⫾SE FD⫾SE
Observed
Average single population 24.3 ⫺0.433⫾0.076 ⫺0.117⫾0.162
Average paired populations 48.7 ⫺0.803⫾0.044 ⫺0.367⫾0.151
Three populations pooled 73.0 ⫺1.208 ⫺0.528
Random samplesa
3⫻8 (Khoisan/PNG/Mng) 24.0 ⫺1.137⫾0.079 ⫺1.185⫾0.162
2⫻12 (Khoisan and PNG) 24.0 ⫺0.630⫾0.076 ⫺0.380⫾0.151
2⫻12 (Khoisan and Mng) 24.0 ⫺0.754⫾0.071 ⫺0.670⫾0.151
2⫻12 (PNG and Mng) 24.0 ⫺0.954⫾0.069 ⫺1.098⫾0.119
2⫻12 (average) 24.0 ⫺0.780⫾0.033 ⫺0.716⫾0.074
PNG, Papua New Guineans; Mng, Mongolians.
aFor each row 100 random samples were generated by choosing 8 individuals from each of three populations
(or 12 from each of two populations) with replacement.
fects of population expansion, which may be more char- lations.PtakandPrzeworski(2002) have further dem-onstrated for autosomal and X-linked loci that the num-acteristic of populations that began practicing
agricul-ture at the beginning of the Neolithic (Excoffierand ber of populations pooled in a sample has a significant negative correlation with TD. Thus, it appears that an
Schneider1999).
Furthermore, the scale of the observed pattern of excess of low-frequency polymorphisms may be present in pooled population data sets from all compartments of NRY structure is not clear. Global surveys of NRY SNP
variation show statistically significant structure both the genome. The confounding influence of population structure may persist even when only a single population among continents and among populations within
conti-nents, as well as isolation by distance at some regional is sampled, because rare alleles may still enter that popu-lation through migration (PtakandPrzeworski2002). scales (Hammeret al. 2001). Therefore, additional
se-quence studies of thoroughly sampled populations from In this respect, it is intriguing that no studies that have deeply sampled single populations at autosomal loci each continent are needed to infer the scale of
subdivi-sion on the NRY. (e.g.,Frisseet al.2001;Kodaet al.2001), nor our own
population samples from the NRY, have recovered an Finally, the results presented here suggest that
esti-mates of the time of onset of population growth and excess of rare alleles. Thus, while it appears that human population structure has left its signature on the ge-the time to ge-the most recent common ancestor (TMRCA)
that are based on global sampling strategies and the nome in the frequency distribution of alleles recovered in global samples, neither the influence of growth nor assumption of panmixia should be considered with
cau-tion (Shenet al.2000;Thomsonet al.2000). Models of migration among subdivided populations is evident when individual populations are surveyed more thor-exponential growth from a stationary panmictic
popula-tion ignore the possible effects of populapopula-tion structure oughly. Interpreting these results in light of historical patterns of human subdivision, migration, and growth (Ptak and Przeworski 2002). This leaves two
chal-lenges for future models: (1) How do we correct for remains a challenging task.
the sampling design to make reasonable estimates of We thank Ian J. Wilson for sharing computer code to help perform growth rates and (2) how do we incorporate the effects the Bayesian coalescent simulations of the population bifurcation model, Amit Indap for writing Perl scripts, and Himla Soodyall and
of subdivision and population expansion into models
Trefor Jenkins for providing Khoisan DNA samples. We also thank
to infer TMRCA and expansion times?
two anonymous reviewers for helpful suggestions. Publication of this
Conclusions: While the NRY is more susceptible to
article was made possible by grant GM-53566 from the National
Insti-genetic drift and the effects of social processes (e.g., tute of General Medical Sciences (to M.F.H.). Its contents are solely patrilocality, polygyny, and/or kin-structured migra- the responsibility of the authors and do not necessarily represent the
official views of the NIH.
tion) that tend to increase the proportion of among-group variation, there is accumulating evidence of pop-ulation structure affecting other regions of the genome.
LITERATURE CITED In the largest survey of sequence variation from a single
panel of humans performed to date, Stephens et al. Allen, B. S., andH. Ostrer, 1994 Conservation of human Y chro-mosome sequences among male great apes: implications for the
(2001) show that the majority of polymorphisms at 313
evolution of Y chromosomes. J. Mol. Evol.39:13–21.
human autosomal and X-linked genes are restricted to Alonso, S., andJ. A. Armour, 2001 A highly variable segment of
human subterminal 16p reveals a history of population growth
popu-for modern humans outstide Africa. Proc. Natl. Acad. Sci. USA Jobling, M. A., andC. Tyler-Smith, 1995 Fathers and sons: the Y chromosome and human evolution. Trends Genet.11:449–456.
98:864–869.
Batzer, M. A., M. Stoneking, M. Alegria-Hartman, H. Bazan, Kaessmann, H., F. Heissig, A. von HaeselerandS. Paabo, 1999 DNA sequence variation in a non-coding region of low
recombi-D. H. Kasset al., 1994 African origin of human-specific
polymor-phic Alu insertions. Proc. Natl. Acad. Sci. USA91:12288–12292. nation on the human X chromosome. Nat. Genet.22:78–81.
Koda, Y., H. Tachida, H. Pang, Y. H. Liu, M. Soejimaet al., 2001
Braverman, J. M., R. R. Hudson, N. L. Kaplan, C. H. Langleyand
W. Stephan, 1995 The hitchhiking effect on the site frequency Contrasting patterns of polymorphisms at the ABO-secretor gene (FUT2) and plasma␣(1,3)fucosyltransferase gene (FUT6) in hu-spectrum of DNA polymorphisms. Genetics140:783–796.
Cann, R. L., M. StonekingandA. C. Wilson, 1987 Mitochondrial man populations. Genetics158:747–756.
Marth, G., G. Schuler, R. Yeh, R. Davenport, R. Agarwalaet al., DNA and human evolution. Nature325:31–36.
Cargill, M., D. Altshuler, J. Ireland, P. Sklar, K. Ardlieet al., 2003 Sequence variations in the public human genome data reflect a bottlenecked population history. Proc. Natl. Acad. Sci. 1999 Characterization of single-nucleotide polymorphisms in
coding regions of human genes. Nat. Genet.22:231–238. USA100:376–381.
Martinez-Arias, R., F. Calafell, E. Mateu, D. Comas, A. Andreset
Cavalli-Sforza, L. L., P. MenozziandA. Piazza, 1994 The History
and Geography of Human Genes. Princeton University Press, Prince- al., 2001 Sequence variability of a human pseudogene. Genome Res.11:1071–1085.
ton, NJ.
DiRienzo, A., andA. C. Wilson, 1991 Branching pattern in the Maruyama, T., 1970 Effective number of alleles in a subdivided population. Theor. Popul. Biol.1:273–306.
evolutionary tree for human mitochondrial DNA. Proc. Natl.
Acad. Sci. USA88:1597–1601. Nachman, M. W., 2001 Single nucleotide polymorphisms and re-combination rate in humans. Trends Genet.17:481–485.
Excoffier, L., andS. Schneider, 1999 Why hunter-gatherer
popula-tions do not show signs of pleistocene demographic expansions. Nachman, M. W., andS. L. Crowell, 2000 Contrasting evolutionary histories of two introns of the duchenne muscular dystrophy Proc. Natl. Acad. Sci. USA96:10597–10602.
Excoffier, L., B. Pellegrini, A. Sanchez-Mazas, C. SimonandA. gene,Dmd, in humans. Genetics155:1855–1864.
Nei, M.,andW.-H. Li, 1979 Mathematical model for studying
ge-Langaney, 1987 Genetics and history of sub-Saharan Africa.
Yearb. Phys. Anthropol.30:151–194. netic variation in terms of restriction endonucleases. Proc. Natl. Acad. Sci. USA76:5269–5273.
Fay, J., and C.-I Wu, 1999 A human population bottleneck can
account for the discordance between patterns of mitochondrial O’Donovan, M. C., P. J. Oefner, S. C. Roberts, J. Austin, B. Hoogendoornet al., 1998 Blind analysis of denaturing
high-vs. nuclear DNA variation. Mol. Biol. Evol.16:1003–1005.
Frisse, L., R. R. Hudson, A. Bartoszewicz, J. D. Wall, J. Donfack performance liquid chromatography as a tool for mutation detec-tion. Genomics52:44–49.
et al., 2001 Gene conversion and different population histories
may explain the contrast between polymorphism and linkage Pluzhnikov, A., A. Di RienzoandR. R. Hudson, 2002 Inferences about human demography based on multilocus analyses of non-disequilibrium levels. Am. J. Hum. Genet.69:831–843.
Fu, Y. X., 1996 New statistical tests of neutrality for DNA samples coding sequences. Genetics161:1209–1218.
Przeworski, M., R. R. HudsonandA. Di Rienzo, 2000 Adjusting from a population. Genetics143:557–570.
Fu, Y. X., andW.-H. Li, 1993 Statistical tests of neutrality of muta- the focus on human variation. Trends Genet.16:296–302.
Ptak, S. E., andM. Przeworski, 2002 Evidence for population tions. Genetics133:693–709.
Halushka, M. K., J. B. Fan, K. Bentley, L. Hsie, N. Shenet al., 1999 growth in humans is confounded by fine-scale population struc-ture. Trends Genet.18:559–563.
Patterns of single-nucleotide polymorphisms in candidate genes
for blood-pressure homeostasis. Nat. Genet.22:239–247. Raymond, M., and F.Rousset, 1995 An exact test for population differentiation. Evolution49:1280–1283.
Hammer, M. F., 1994 A recent insertion of an Alu element on the
Y chromosome is a useful marker for human population studies. Rogers, A., andH. C. Harpending, 1992 Population growth makes waves in the distribution of pairwise differences. Mol. Biol. Evol. Mol. Biol. Evol.11:749–761.
Hammer, M. F., 1995 A recent common ancestry for human Y chro- 9:552–569.
Romualdi, C., D. Balding, I. S. Nasidze, G. Risch, M. Robichaux
mosomes. Nature378:376–378.
Hammer, M. F., A. B. Spurdle, T. Karafet, M. R. Bonner, E. T. et al., 2002 Patterns of human diversity, within and among conti-nents, inferred from biallelic DNA polymorphisms. Genome Res.
Wood et al., 1997 The geographic distribution of human Y
chromosome variation. Genetics145:787–805. 12:602–612.
Rozas, J., andR. Rozas, 1999 DnaSP version 3: an integrated
pro-Hammer, M. F., T. Karafet, A. Rasanayagam, E. T. Wood, T. K.
Altheideet al., 1998 Out of Africa and back again: nested gram for molecular population genetics and molecular evolution analysis. Bioinformatics15:174–175.
cladistic analysis of human Y chromosome variation. Mol. Biol.
Evol.15:427–441. Schneider, S., D. RoessliandL. Excoffier, 2000 Arlequin: A Soft-ware for Population Genetic Analysis. Genetics and Biometry
Labora-Hammer, M. F., T. M. Karafet, A. J. Redd, H. Jarjanazi, S.
Santachi-ara-Benerecetti et al., 2001 Hierarchical patterns of global tory, University of Geneva, Geneva.
Seielstad, M. T., E. MinchandL. L. Cavalli-Sforza, 1998 Genetic human Y-chromosome diversity. Mol. Biol. Evol.18:1189–1203.
Harding, R. M., S. M. Fullerton, R. C. Griffiths, J. Bond, M. J. Cox evidence for a higher female migration rate in humans. Nat. Genet.20:278–280.
et al., 1997 Archaic African and Asian lineages in the genetic
ancestry of modern humans. Am. J. Hum. Genet.60:772–789. Shen, P., F. Wang, P. A. Underhill, C. Franco, W. H. Yanget al., 2000 Population genetic implications from sequence variation
Harpending, H., andA. Rogers, 2000 Genetic perspectives on
hu-man origins and differentiation. Annu. Rev. Genomics Hum. in four Y chromosome genes. Proc. Natl. Acad. Sci. USA97:
7354–7359. Genet.1:361–385.
Harpending, H. C., 1994 Signature of ancient population growth Shen, P., M. Buchholz, R. Sung, A. Roxas, C. Francoet al., 2002 Population genetic implications from DNA polymorphism in ran-in a low-resolution mitochondrial DNA mismatch distribution.
Hum. Biol.66:591–600. dom human genomic sequences. Hum. Mutat.20:209–217.
Simonsen, K. L., G. A. ChurchillandC. F. Aquadro, 1995
Proper-Harpending, H. C., M. A. Batzer, M. Gurven, L. B. Jorde, A. R.
Rogerset al., 1998 Genetic traces of ancient demography. Proc. ties of statistical tests of neutrality for DNA polymorphism data. Genetics141:413–429.
Natl. Acad. Sci. USA95:1961–1967.
Harris, E. E., andJ. Hey, 1999 X chromosome evidence for ancient Slatkin, M., andR. R. Hudson, 1991 Pairwise comparisons of mito-chondrial DNA sequences in stable and exponentially growing human histories. Proc. Natl. Acad. Sci. USA96:3320–3324.
Hey, J., 1997 Mitochondrial and nuclear genes present conflicting populations. Genetics129:555–562.
Stephens, J. C., J. A. Schneider, D. A. Tanguay, J. Choi, T. Acharya
portraits of human origins. Mol. Biol. Evol.14:166–172.
Hudson, R., 1990 Gene genealogies and the coalescent process. et al., 2001 Haplotype variation and linkage disequilibrium in 313 human genes. Science293:489–493.
Oxf. Surv. Evol. Biol.7:1–44.
InternationalSNPMap Working Group, 2001 A map of human Tajima, F., 1989a Statistical method for testing the neutral mutation hypothesis by DNA polymorphism. Genetics123:585–595. genome sequence variation containing 1.42 million single
the expected number of segregating sites in the two-subpopula- Wilson, 1991 African populations and the evolution of human mitochondrial DNA. Science253:1503–1507.
tion model. Genetics123:229–240.
Wakeley, J., andJ. Hey, 1997 Estimating ancestral population
pa-Takahata, N., 1991 Genealogy of neutral genes and spreading of
rameters. Genetics145:847–855. selected mutations in a geographically structured population.
Wall, J. D., andM. Przeworski, 2000 When did the human popula-Genetics129:585–595.
tion size start increasing? Genetics155:1865–1874.
Takahata, N., andM. Nei, 1985 Gene genealogy and variance of
Watterson, G. A., 1975 On the number of segregating sites in interpopulational nucleotide differences. Genetics110:325–344.
genetical models without recombination. Theor. Popul. Biol.7: Thomson, R., J. K. Pritchard, P. Shen, P. J. OefnerandM. W.
256–276.
Feldman, 2000 Recent common ancestry of human Y
chromo-Whitfield, L. S., J. E. SulstonandP. N. Goodfellow, 1995 Se-somes: evidence from DNA sequence data. Proc. Natl. Acad. Sci.
quence variation of the human Y chromosome. Nature378:379– USA97:7360–7365.
380.
Thorstenson, Y. R., P. D. Shen, V. G. Tusher, T. L. Wayne, R. W.
Wilson, I. J., W. E. WealeandD. Balding, 2003 Inferences from
Daviset al., 2001 Global analysis of ATM polymorphism reveals
DNA data: population histories, evolutionary processes and foren-significant functional constraint. Am. J. Hum. Genet.69:396–412.
sic match probabilities. J. R. Stat. Soc. Ser. A Stat. Soc. 166: Tishkoff, S. A., E. Dietzsch, W. Speed, A. J. Pakstis, J. R. Kiddet
155–201.
al., 1996 Global patterns of linkage disequilibrium at the CD4
Y Chromosome Consortium, 2002 A nomenclature system for the locus and modern human origins. Science271:1380–1387.
tree of Y chromosomal binary haplogroups. Genome Res. 12: Underhill, P. A., L. Jin, A. A. Lin, S. Q. Mehdi, T. Jenkinset al., 339–348.
1997 Detection of numerous Y chromosome biallelic polymor- Yu, N., Z. Zhao, Y. X. Fu, N. Sambuughin, M. Ramsayet al., 2001 phisms by denaturing high-performance liquid chromatography. Global patterns of human DNA sequence variation in a 10-kb Genome Res.7:996–1005. region on chromosome 1. Mol. Biol. Evol.18:214–222.
Underhill, P. A., G.Passarino, A. A.Lin, P.Shen, M.Mirazon Zietkiewicz, E., V. Yotova, M. Jarnik, M. Korab-Laskowska, K. K. Lahret al., 2001 The phylogeography of Y chromosome binary Kiddet al., 1998 Genetic structure of the ancestral population haplotypes and the origins of modern human populations. Ann. of modern humans. J. Mol. Evol.47:146–155.
Hum. Genet.65:43–62.