Genetic Algorithm Implementation for
Cluster Head Re-election in Oceanic
Environment
Sruthi C V 1 Sobhana N V2
P.G. Student, Department of Computer Engineering, MEA Engineering College, Perinthalmanna, Kerala, India1
Associate Professor, Department of Computer Engineering, Rajiv Gandhi Institute of Technology, Kottayam, Kerala,
India2
ABSTRACT: Wireless Sensor Networks (WSNs) is a promising structure used to assist the stipulation of many military and industrial services. They are used to monitor physical or environmental conditions, such as temperature, sound, pressure, etc. and to cooperatively pass their data through the network to a main location. Energy is a very precious resource for sensor nodes. Long communication distances between sensors and a sink (or destination) in a sensor network can greatly drain the energy of sensors and reduce the lifetime of a network. Here, Genetic Algorithm is proposed for cluster head reelection. By clustering a sensor network into a number of independent clusters using a GA, we can greatly minimize the total energy consumption, thus prolonging the network lifetime. This paper presents a new method in the use of wireless communication to impart safety and security to the fishermen and to equip them with the current status of the fisheries sector while they are in the deep sea fishing. The results show that the proposed method, the network with cluster head has better performance and less energy consumption than the network without cluster head (base line).
KEYWORDS:Wireless Sensor Networks, Energy of nodes, Clustering, Genetic Algorithm, Network lifetime.
I. INTRODUCTION
Today, in the era of Information Age, technology has successfully diffused to a large number of end users and has significantly changed the life style of mankind. It has immensely benefited the work culture, productivity and economic stability. The use of ICT through e-Governance benefited not only to urban, but also for many rural as well as BPL families. However, there are many fields of employment in which safety and security is a big concern and how best the technology can leverage the same for fisherman is the focus of this work.
The proposed system presents and discusses the use of wireless communication to impart safety and security to the fishermen and to equip them with the current status of the fisheries sector while they are in the deep sea fishing. Communication of fishermen from the deep sea to the shore or neighboring vessel is a laborious task and is not possible with any of the devices available to them. A solution to this is yet to be identified by means of new advancement of communication technology to ensure the safety and security while they are in deep sea fishing. Wireless Sensor Networks (WSNs) have recently been considered as potentially promising alternatives for monitoring marine environments since they have a number of advantages such as unmanned operation, easy deployment, real-time monitoring, and relatively low cost. Cluster Head selection, re-election, optimized number of clusters and possible information exchange when a node moves out of the range are considered.
and collaborate to accomplish a common task. WSN has a wide range of potential applications in military, traffic surveillance, target tracking, environment monitoring, healthcare monitoring, and so on [2].
One of the greatest challenges in WSN is the limited energy supplies. WSN uses low-cost nodes with limited battery power, and the battery replacement is not easy. In order to offer a long network lifetime, we have to minimize total energy consumption and increase the maximum coverage area. Therefore, it is essential to route the data packets in an energy efficient manner. Since sensor nodes are energy constrained, it is inefficient for all the sensors to transmit the data directly to the base station. By using clustering technique, transmission energy reduced to minimum.
Wireless Sensor Networks (WSNs) have recently been considered as potentially promising alternatives for monitoring marine environments since they have a number of advantages such as unmanned operation, easy deployment, real-time monitoring, and relatively low cost. Cluster Head selection, re-election, optimized number of clusters and possible information exchange when a node moves out of the range are considered.
Paper is organized as follows. Section II describes all the related works about this project. After that clustering and network optimization is given in section III. Section IV presents experimental results showing results of network analysis. Finally, Section V presents conclusion.
II. RELATEDWORK
Wireless sensor network (WSN) is a system composed of a large number of low-cost micro-sensors. This network is used to collect and send various kinds of messages to a base station (BS). WSN consists of low-cost nodes with limited battery power, and the battery replacement is not easy for WSN with thousands of physically embedded nodes, which means energy is the most important factor. Since sensor nodes are energy constrained, it is inefficient for all the sensors to transmit the data directly to the base station. To solve this problem clustering technique used here.
WSNs have recently been considered as potentially promising alternatives for monitoring marine environments since they have a number of advantages such as unmanned operation, easy deployment, real-time monitoring, and relatively low cost. In the case of oceanic environment, nodes get lost because of several problems like coverage, movements caused by wind etc. Communication may not be possible under high variations in temperature and pressure. When a node gets isolated because of unmanageable problems we will be unable to communicate with it, may be signal problem or coverage problem. In that case that particular node is connected with the nearest neighbor hence make communication possible.
Several works use Genetic Algorithm to improve network lifetime and optimize the network [4]. This work includes the usage of Genetic Algorithm to re-elect cluster head. All the nodes have equal probability to become a cluster head. But in the case of cluster head re-election some other parameters need to be considered like signal strength, wind speed etc. Cluster Head selection, re-election, optimized number of clusters and possible information exchange when a node moves out of range are also considered.
There are so many routing protocols that are introduced to reduce total energy consumption of the network. Heinzelman [5] described the LEACH protocol, a hierarchical, self-organized cluster-based approach for monitoring applications. Lindsey [6] proposed PEGASIS, an extension of LEACH, in which nodes transmit to their nearest neighbors, which eventually transmit the messages to the base station. The PEGASIS protocol is found to be more robust to node failures as compared to LEACH. Muruganathan proposed a centralized routing protocol called Base-Station Controlled Dynamic Clustering Protocol (BCDCP). The protocol tries to distribute the network energy evenly among all the network nodes and proposes a specialized approach for selecting the cluster heads. Here an intelligent clustering is proposed which is energy efficient.
Sajidhussainet al [4] used the HCR protocol which is enhanced by using a GA at the BS. The BS uses a GA (Intelligent Clustering) to create energy-efficient clusters for a given number of transmissions. The node is represented as a bit of a chromosome. The head and member nodes are represented as 1s and 0s, respectively. A population consists of several chromosomes and the best chromosome is used to generate the next population.
The GA outcome identifies suitable clusters for the network. The BS broadcasts the complete network details to the sensor nodes. These broadcast messages include: the query execution plan, the number of cluster heads, the members associated with each cluster head, and the number of transmissions for this configuration. All the sensor nodes receive the packets broadcasted by the BS and clusters are created accordingly; thus completing the cluster formation phase. This is followed by the data transfer phase.
Konstantinos et al [7] proposed a multi-objective optimization methodology for self-organizing, adaptive wireless sensor network design and energy management. This shows betterment in energy efficiency and network coverage. The data collection from sensor nodes must meet specific requirements, depending on the type of data that are collected. These requirements are turned into specific design properties of the WSN, which in this work are called ‘‘application specific parameters’’ of the network. For optimization application specific parameters, connectivity parameters and energy related parameters are considered.
Chih-Chung Lai et al [8], considered a discrete sensor surveillance application in which a set of discrete targets have to be fully covered by sensors. For example, on the battlefield, each location of interest must be covered by at least one sensor; otherwise there may be some critical information lost, which might lead to misjudgment of the military situation and even severe casualties. Thus, the objective of the scheduling problem considered here is to find maximum number of disjoint sensor covers such that each sensor cover can fully cover all these targets. Finding the maximum disjoint sensor covers has been solved via transformation into the Disjoint Set Covers (DSC) problem. Several heuristic methods have been proposed to solve these problems. The most constrained-minimum constraining heuristic (MCMCC) takes only polynomial time but it gets improvable results.
Fitness Parameters
The fitness of a chromosome is designed to minimize the energy consumption and to extend the network life time. Sajidhussain et al[14] has taken few fitness parameters that are described in this section.
1) Direct Distance (DD) to Base Station: The direct distance, DD, to base station is the sum of all distances from sensor nodes to the BS
=
2) Cluster Distance (C): The cluster distance, C is the sum of the distances from the nodes to the cluster head and the distance from the head to the BS. If is the distance from node i to the cluster head h and is the distance from the cluster head h to the BS node s.
= +
3) Cluster Distance - Standard Deviation (SD): for non-uniform spatial distribution, where nodes are randomly placed, the cluster distances must not be necessarily the same. The variation in cluster distances should be tuned according to the deployment information.
=∑ = ∑ ( − )
4) Transfer Energy (E): Transfer energy [9], E, represents the energy consumed to transfer the aggregated message from the cluster to the BS.
= + × +
5) Number of Transmissions (T): The numbers of transmissions are assigned by the BS, for each data transfer stage. The value of T can be adjusted according to the network conditions and current energy levels. The quality of best chromosome is determined from the history of previous GA solutions.
b)Fitness Function
= ( × ) ,∀ ∈{ , , , , }
III.CLUSTERINGANDNETWORKOPTIMIZATIONINWSN
In this suggested model, we assume the sensor network (set of base stations) is static. Sensors are deployed in a remote inhospitable environment and are far away from the sink which is usually positioned in a safe place. All nodes are assumed to have the capabilities of a cluster-head and the ability to adjust their transmission power based on transmission distance. Each sensor’s position can be precisely measured by GPS devices.
The proposed system can be divided into four tasks 1. Node placement
2. Cluster formation
3. Sensing and data transmitting 4. Network optimization using GA
1. Node placement
Node placement is an important stage before establishment of a WSN. Generally, there are several types of node distributions in WSNs including regular, random, and grid distributions [13]. Under grid layout, the distance between each node can be estimated. Regular layouts are used in underwater sensors and random layouts are used in military purposes. In this project, sensor nodes are placed in fishing boats. So we choose semi deterministic node placement as this type of node placement comes under random distribution, where the nodes can cover the entire area. Sensor nodes are deployed in the fishing region and base station is fixed far away from this area [15].
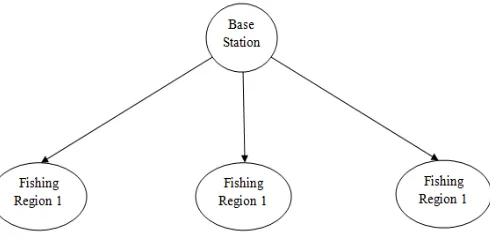
The figure 1 shown below gives the exact scenario. The entire fishing zone is divided into a number of regions depends upon the total number of nodes. Each region is called as “cluster” and for each cluster one “cluster head” is selected in order to represent the entire cluster.
Figure 1: Topology of the entire network
2. Cluster formation
Custer formation could be divided into two phases; setup phase and clustering phase
2.1 Setup phase
Step 1:
When a sensor node gets this packet it will compute its direct distance from base station and energy level. Since the entire sensor nodes are location aware by using GPS system, distance from BS could be calculated using normal distance formula
( , ) = (( 2− 1) + ( 2− 1) ) And the energy level is calculated by
( ) = ( )
∝ Where
EL is the energy parameter [9] and it is an estimated value ‘i’ is the ID of each node
α is the minimum energy unit, a constant
Step 2:
Each node sends its packet in a circle with a certain radius during its own time slot after Step 1. For example, in the time slot, the node whose ID is i will send out its packet. This packet contains a preamble and the information such as coordinates and EL of node i. The packet created by each node contains Preamble, Coordinates of i, EL(i), Direct distance from BS.
2.2 Clustering phase
After the initial phase each node knows information about its neighbors, so that all the sensor nodes have a connection with their nearest neighbors. Here, for the first clustering number of clusters are predefined. So the number of cluster heads and number of clusters are equal. For the first clustering, the node which is at the shortest distance will be elected as CH. Suppose we need ‘k’ no of clusters, then we will assign first ‘k’ nodes which are at the shortest distance from base station provided it satisfy position constraints. After the selection of cluster head, all cluster heads will keep a bit (either 0 or 1) to represent whether it is a cluster head or not. Cluster heads are represented by 1 and cluster members are represented by 0.
5.3 Sensing and data transmitting
Once clustering is done each node senses its environment and continuously senses the following details: Latitude, Longitude, Wind, Sea level pressure, Temperature, Signal strength.
They send this data to the cluster head. Cluster head will remove the duplicates and send data to the base station. The packet size is fixed in this case, thereby reducing energy consumption [12]. The data transmitting or information exchanging is done as follows
Each node selects its nearest neighbor as its parent node and generates a DATA-PKT which contains all of the above parameters. This phase is divided into 3 segments [9].
Segment 1: leaf nodes send beacon to ensure there is no traffic interference between leaf and parent.
Segment 2: If more than one leaf nodes want to send data, the parent node will get an incorrect beacon. In this case parent sends a control message to choose among leaf nodes. All
the other nodes will switch to sleep except the communicating one. Segment 3: only one node want to send data.
So this information transmitting phase is divided into a number of timeslots. After each timeslot each node recalculates its energy level and checks whether it falls below a particular threshold. This threshold is dependent on the distance and signal strength. If it shows that energy level E (i) of cluster head is below this particular threshold, then cluster head re-election is needed for this cluster head re-re-election we use Genetic Algorithm thereby optimizing the network.
5.4 Network Optimization using Genetic Algorithm
Genetic Algorithm performs fitness test on each chromosome on the basis of a fitness function. Here we are defining fitness function as a rule based system. The factors that affect fitness function are wind speed, sea temperature and signal strength [16]. We use two bit representation for each of these parameters. The codes assigned are as follows. Bad – 00, Average – 01, Good – 11.
1. Signal Strength (SS)
2. Sea Temperature (ST)
Sea surface temperature (SST) is the water temperature close to the ocean's surface. The exact meaning
of surface varies according to the measurement method used, but it is between 1 millimetre (0.04 in) and 20 meters (70 ft) below the sea surface.
3. Wind speed (WS)
Wind speed, or wind flow velocity, is a fundamental atmospheric rate. Wind speed is caused by air moving from high pressure to low pressure, usually due to changes in temperature.
Position
Signal Strength
Sea Temperature
Wind Speed
Figure 2: Chromosome
Figure 2 shows the chromosome structure. All of the fields in the above table will have the values either 0 or 1 according to the rules mentioned above. The fitness function will try to match each chromosome towards a perfect chromosome, i.e. all fields are 1 in this case which the best case is. But the ordering will be different for different parameters. The order in which a chromosome is said to have the qualities to be chosen as best is also given.
The parameters of the fitness [3] and their gene can be developed as follows
1. Direct distance from base station (DD)
Choosing the best chromosome in this case is according to the priorities. In this case the first preference will go to the signal strength. That particular field should be 1 to consider the other factors. Then its order will be position, wind, temperature, and then pressure.
2. Energy level (EL)
( ) = ( )
∝
If EL < Transfer energy then set this EL=1 or set EL=0. α is a minimum energy unit.
3. Cluster distance (C)
It is the sum of distances from nodes to the cluster head and distance from cluster head to the base station [4].
= ℎ+ ℎ
If C=DD of CH, then C=1 or C=0. This cluster distance should be minimum for the best case. 4. Cluster distance standard deviation(SD)
The cluster distance standard deviation will follow the order, first position, then signal strength, wind, pressure. This chromosome will try to find out a maximum match towards the best case.
5. Transfer energy (TE)
It is the energy consumed to transfer the aggregated DATA-PKT from cluster to base station. Here energy needed for running transmit and receive circuitry [2] is for a ‘k’ bit packet at distance ‘d’ is given by Transmitting
( , ) = ( ∗ ) + ∗ ∗
Receiving
( ) = ∗
The genes that are acceptable in the case of EL are the genes that are acceptable in this case. i.e., position, signal strength, wind, temperature, and pressure.
The fitness function F is defined as follows F=f ϵ (DD, C, SD, EL, TE)
IV. EXPERIMENTAL RESULTS
The entire data collection is divided into several groups on the basis of Genetic Algorithm application. In the literature Genetic Algorithm is used for improving network lifetime and some of them use to optimize the entire network. The NS2 simulation of proposed system is done for both case 1 and case 2. Several sensor nodes are placed in a 500 * 500 field and one node is selected as base station for the scenario. Case 1 is the situation when the clustering technique is not used. Each node is directly connected to this base station and sends data packets to it. More amount of energy is consumed and wasted in this scenario. Case 2 has predefined number of clusters and cluster heads. There will be one cluster head for a cluster (number of sensor nodes) and this is the only node which has direct contact with the base station. So each cluster head collects information from all of its cluster members and sends it to the base station. The total energy consumed by each node is lesser in this case and the network lasts for a long time compared to case 1. The comparative graph is given in Figure 3.
Figure 3: Energy consumption of nodes Figure 4: Packet Delivery Ratio
The graph in figure 3 consists of "energy consumption of each node in the network with cluster head" and “without cluster head”. In the first case, sensor nodes use lesser energy during the entire time. In the second case sensor nodes loss all of its energy before the time has finished. So this clearly indicates that network, which has cluster head, outperforms the other. So clustering technique is applicable in oceanic environment.
The graph given in Figure 4 consists of the packet delivery ratio of the proposed system. Fourteen sensor nodes are placed and taken for comparison. Here sensor nodes 2 and 10 are cluster heads and all others are cluster members. Each cluster head collects information from all other cluster members and sends it to base station. The packet delivery ratio is calculated by taking the ratio of total number of packets received to total number of packets send.
V. CONCLUSION
Communication of fishermen from the deep sea to the shore or neighboring vessel is a laborious task. A solution to this is yet to be identified by means of new advancement of communication technology to ensure the safety and security while they are in deep sea fishing. Since there is high priority need to develop a low cost wireless communication device, which help them to communicate to shore and to other fleets, this work proposes a new method for deep sea fishing troublesome. This will ensure a speedy means to share information, ensuring safe and secure fishing, as well as improving the standard of fishing techniques and industry.
REFERENCES
[1] Vivek Katiyar, Narottam Chand, Naveen Chauhan,”Recent advances and future trends in Wireless Sensor Networks”, International Journal Of Applied Engineering Research, Dindigul Volume 1, No3, 2010
[3] Ramesh Rajagopalan, Pramod K. Varshney, “Data aggregation techniques in sensor networks: A survey”, Syracuse University, Department of Electrical Engineering and Computer Science”, NY, USA 13244
[4] Sajid Hussain, Abdul Wasey Matin, Obidul Islam, “Genetic Algorithm for Hierarchical Wireless Sensor Networks”, Journal of Networks, Vol. 2, No. 5, September 2007
[5] Chunyao FU, Zhifang JIANG,Wei WEI, Ang WEI,”An Energy Balanced Algorithm of LEACH Protocol in WSN”,IJCSI International Journal of Computer Science Issues, Volume 10, Issue 1, No 1, January 2013
[6] Stephanie Lindsey Cauligi S. Raghavendra, “PEGASIS: Power-Efficient Gathering in Sensor Information Systems”, Computer Systems Research Department The Aerospace Corporation P.O. Box 92957 Los Angeles
[7] Konstantinos P. Ferentinos , Theodore A. Tsiligiridis, “Adaptive design optimization of wireless sensor networks using genetic algorithms” , Elsevier, Computer Networks 51 (2007) 1031–1051
[8] Chih-Chung Lai, Chuan-Kang Ting, and Ren-Song Ko, “An Effective Genetic Algorithm to Improve Wireless Sensor Network Lifetime for Large-Scale Surveillance Applications”, Conference Paper January 2007, DOI: 10.1109/CEC.2007.4424930
[9] Zhao Han, Jie Wu, Jie Zhang, Liefeng Liu, and KaiyunTian, “A General Self-Organized Tree-Based Energy-Balance Routing Protocol for Wireless Sensor Network” ,IEEE Transactions on Nuclear Science, Vol. 61, No. 2, April 2014
[10] Norouzi, A., Zaim, A. H. (2014), “Genetic algorithm application in optimization of wireless sensor networks”, The Scientific World Journal,2014.
[11] Selim Bayrakl, Senol Zafer Erdogan, “Genetic Algorithm Based Energy Efficient Clusters (GABEEC) in Wireless Sensor Networks”, Elsevier Procedia Computer Science 10 ( 2012 ) 247 – 254
[12] Ali Norouzi, Faezeh Sadat Babamir, Zeynep Orman, “A Tree Based Data Aggregation Scheme for Wireless Sensor Networks Using GA”, Wireless Sensor Network, 2012, 4, 191-196
[13] Mohamed Younis , Kemal Akkaya, “Strategies and techniques for node placement in wireless sensor networks: a survey”, Article in Ad Hoc Networks · June 2008
[14] Ali Norouzi, Faezeh Sadat Babamir, Abdul Halim Zaim , “A New Clustering Protocol for Wireless Sensor Networks Using Genetic Algorithm Approach” , Scientific Research , Wireless Sensor Network, 2011, 3, 362-370
[15] Jsensen, Robert, “The Digital Provide: Information Technology, Market Performance and welfare in the south Indian fisheries sector”, The Quarterly Journal Economics, Issue 3, Aug.2007.