World energy resources
A. Clerici(∗)
WEC World Resources and CESI - Milano, Italy
G. Alimonti(∗∗)
INFN and Universit`a degli Studi - Milano, Italy
Summary.— As energy is the main “fuel” for social and economic development and since energy-related activities have significant environmental impacts, it is important for decision-makers to have access to reliable and accurate data in an user-friendly format. The World Energy Council (WEC) has for decades been a pioneer in the field of energy resources and every three years publishes its flagship report Survey of Energy Resources. A commented analysis in the light of latest data summarized in such a report, World Energy Resources (WER) 2013, is presented together with the evolution of the world energy resources over the last twenty years.
1. – Introduction
While considering the different realities of individual nations and continents, energy and environment have assumed an increasingly important and interdependent role with a global environmental impact.
(∗) Chair of the WEC Study Group on “Global Energy Resources and Technologies” and Senior Advisor CESI.
(∗∗) Member of the EPS Energy Group.
/
C
Owned by the authors, published by EDP Sciences
/ 98
7KLVLVDQ2SHQ$FFHVVDUWLFOHGLVWULEXWHGXQGHUWKHWHUPVRIWKH&UHDWLYH&RPPRQV$WWULEXWLRQ/LFHQVHZKLFKSHUPLWV
Data and “numbers” of such a problem must be evaluated in a non-ideological way: starting from this point of view, WEC (World Energy Council), with the study group “World Energy Resources”, has presented its 2013 report at the 22nd World Energy Congress in October 2013 in South Korea. The report refers to the 2011 validated data obtained both from approximately 100 WEC national committees and from various experts and international sources.
The report shows how electricity is more and more important: by 2030 it will absorb 44% of primary energy resources for its production and now it is already responsible of 40% of CO2emissions resulting from human activities.
It should be noted that 1.3 billion people are still without electricity and the “poor” Africa, with 14% of the world population, consumes only 3% of global electricity; further-more 40% of the electricity is consumed by a single nation (Republic of South Africa), which represents 5% of the inhabitants of the African continent that has 1 billion people now and presents the highest population growth rate. Excluding the Countries of North Africa and the Republic of South Africa, the rest of the African population uses wood to cover 85% of its energy needs. The problem of a global access to energy resources by the world population is then considered by WEC a primary objective for humanity.
2. – The 2013 World Energy Resources WEC report
Figure 1 clearly shows the contents of the WEC report and the 12 considered resources: it is to be noted that energy efficiency has been included as a resource. Given the current and medium term importance of fossil fuels, which contribute today more than 80% to the primary energy production, hereafter we report more details about their use and production.
Table I summarizes the situation as regards the resources which have been established and extractable (R) in the current market conditions, the annual production (P) and consumption (C) and the ratio R/P that at the present energy consumption indicates for how many years we can use these resources. They are all presented both at the global level and for each of the 8 geographical areas the world has been divided. It should be noted that Siberia, belonging to Russia, was considered part of Europe.
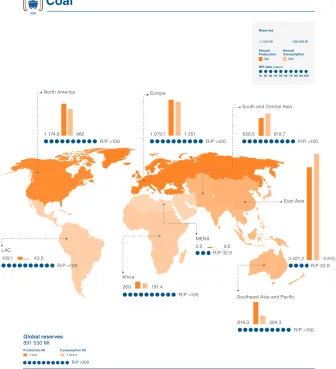
Regarding the coal, as can be seen from the data given in fig. 2 and geographically detailed in table I, the ratio R/P is equal to 118 years at the global level. The area with the greatest production and consumption is East Asia (China, Japan, South Korea, Taiwan) and China, with about 50% of the world consumption, is characterized by an R/P ratio of 34 years. The area with the largest reserves is Europe (31% and anR/P ratio of 250 years) followed by North America with reserves equal to 27% of the global reserves and anR/P ratio of 209 years.
TableI. –World Fossil Sources (Data 2011) (elaboration by A. Clerici, source: World Energy Council, 2013).
Oil Coal
Natural Gas Uranium & Nuclear Hydro Power Bioenergy & Waste
Wind Solar PV Geothermal Peat
Marine Energies Energy Efficiency
Fig. 1. – WEC “World Energy Resources 2013” (source: World Energy Council, 2013).
Clearly within each geographical area there are large differences: in Europe it is sufficient to think about Poland, which is largely independent and an exporting country, while Italy is practically importing all the needed coal.
Table II shows the situation in 5 major nations with regard to the reserves of coal and the comparisons with the 1993 data: in order of importance are the United States, Russia, China, Australia and India, which cumulatively have 72% of the reserves.
For the “conventional” oil, as can be seen from table I, at the global level the ratio R/Pis equal to 56 years and the dominant area for the reserves is clearly the Middle East North Africa (MENA) with 50%, followed by Latin America (20%) and North America (13%).
East Asia South and Central Asia
Southeast Asia and Pacific LAC
North America Europe
Africa 982
1 174.8 1 079.7 1 251 658.5
819.3 3 421.2 260 191.4 304.3 3 913.3 818.7 R/P >100 R/P >100 R/P >100 R/P >100
R/P >100 R/P 33.8
>200 000 Mt
Reserves
<1 000 Mt
Annual Production
R/P ratio (years)
Annual Consumption
10 20 30 40 50 60 70 80 90 100
(Mt) (Mt) 109.1 43.5 R/P >100 MENA R/P 32.9 2.0 9.6
Coal
7 520 7 513.8
R/P >100
Production Mt Consumption Mt
Global reserves
891 530 Mt
Fig. 2. – The coal geographical situation (source: World Energy Council, 2013).
consumption, the North America 38% and Europe 19%. As for coal, also for oil there are large differences among the individual national realities within the macro areas; just compare Italy and Germany with Russia and Norway.
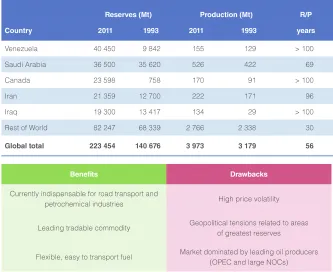
Table III shows the situation in the top 5 nations for conventional oil reserves. Venezuela is in the lead, thanks to a review carried out on its own reserves, followed by Saudi Arabia, Canada, Iran and Iraq; cumulatively they have 64% of world reserves, percentage increased from the 1993 60% evaluation.
TableIII. –Oil reserves: the top 5 countries (source: World Energy Council, 2013).
than 350 billion tons, equal to 1.5 times the current reserves of conventional oil. Their extraction, up to now negligible, can become interesting with high and stable oil prices, over about 90$/barrel.
As regards the “conventional gas”, with reference to table I, it can be seen that the ratioR/P is equal to 60 years and the main reserves, as for petroleum, are concentrated in the MENA area (41%) followed by Europe (Russia in the first place) with 25% and Asia Center South with 15%. As regards the gas consumption, Europe is in the lead with 33%, followed by North America and MENA, respectively with 26% and 13%.
About exports and imports of gas, North America (shale gas in the United States) became independent with its consumption equal to its production, East Asia is importing 70% of its needs and Europe 15%, while the other macro-areas are exporting, respectively, 33% Latin America of its production, 30% Asia Center South, 28% South East Asia and the Pacific, and 24% MENA.
Table IV shows in order of importance the 5 countries with the largest reserves of natural gas: Russia, Iran, Qatar, Turkmenistan and Saudi Arabia. Cumulatively they have 67% of the world reserves, increased from the 1993 48% percentage.
revo-TableIV. –Gas reserves: the top 5 countries (source: World Energy Council, 2013).
lution in the United States) have very strong differences between North America, Europe (prices 3–4 times higher) and East Asia (prices 5–6 times higher). In addition, with refer-ence to the LNG (liquefied natural gas) the steps of liquefaction/transport/regasification have considerable costs compared to the terrestrial transport (or marine by few hundred kms) pipelines.
The non-conventional gas extractable reserves amount to 500 thousand billion cubic meters, up to 2.5 times the natural gas reserves. By now, a strong development of shale gas has happened in the United States with a production covering over the 25% of the total US gas consumption.
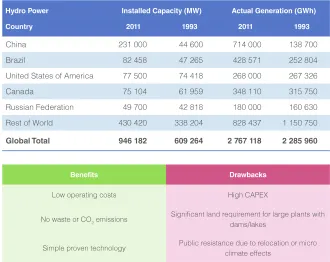
3. – Hydroelectric energy
TableV. –Hydroelectric Power (source: World Energy Council, 2013).
Africa would have the possibility of an installed capacity of over 250 GW with a production of 1000 TWh/year (500 in the Democratic Republic of Congo, 160 in Ethiopia, 160 in Cameroon, 25 in Angola); however there are difficulties of development since hydroelectric plants are capital-intensive and often tied to long transmission systems involving many crossed countries.
Table V shows the hydroelectric installed power and energy production in the first 5 countries of the world as changed in the last 20 years; they are in descending order China, Brazil, United States, Canada and Russia.
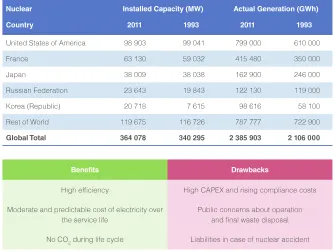
4. – Nuclear energy
The situation in the first 5 countries for installed and in service nuclear power on 31/12/2011 (9 months after Fukushima) is reported in table VI compared to the situation of 1993. It should be noted that, to that date, 38 reactors were still in service in Japan compared to 54 in service on 11/3/2011, the day of the Fukushima accident.
TableVI. –Nuclear installed power and production (source: World Energy Council, 2013).
energy raw materials equal to about 40 billion dollars a year and with a strong increase in CO2emissions, resulting in the Japan exit from Kyoto protocol.
Table VII summarizes the situation in March 2013 (2 years after Fukushima) as re-gards the reactors declared available and not in decommissioning by the local authorities (including the 50 Japanese reactors).
Europe is the continent that holds the highest number of reactors and the maximum installed power (44% of the total), while Asia (China main contributor with 28 reactors) is the continent with the highest number of reactors and power in the implementation phase (46 reactors and 70% of the global power of reactors under construction in the world).
Table VII. – The nuclear situation on 03/12/2013, two years after Fukushima (editing by A. Clerici on IAEA data).
5. – Other renewables
Biomassis “the biodegradable fraction of the products, wastes and residues of biolog-ical origin coming from agriculture (including vegetal and animal substances), forestry and related industries, including the fisheries and aquaculture, as well as the biodegrad-able fraction of industrial and municipal waste”. This is what establishes the European Directive 2009/28/EC.
The approximately 1300 MT of bioenergy used in 2011 are the main resource after fossil fuels and are by far in the first position as “renewable”, with a share of about 8% of global resources. More than 85% come from woody biomass, about 8% from agricul-tural products and by-products and approximately 5% from waste of municipalities and industrial processes.
Solid biofuels (in particular derived from wood as mentioned above) are still the great majority, although their annual increase has been an average of 1% over the last two decades; they are followed by liquid fuels and by biogas that had in the last 20 years an annual increase of 11% and 15% respectively.
The biggest “producers” of bioenergy are China, India, Nigeria and the United States and the largest producers of biofuels from wood are India, China, Brazil, Ethiopia and Nigeria. The biomass and biofuels for energy production have had and still practically have a local use while international trades, even if with a strong increase, represent only 2% of the total use of biomass for energy purposes.
trade, it is worth mentioning that the current consumption of biofuels is equal to 3% of the global consumption of transport fuels. Advanced solutions for the combustion technologies are in development, to allow a better use of a wide range of biomasses, with greater efficiency and lower environmental impacts. In such a line there is the co-combustion of biomass with fossil fuels that is finding interesting applications.
Clearly the biomass development for energy purposes must be able to coexist with a balanced use of water and with the necessary increase of land dedicated to agriculture to cope with the increase of the world population and the improvement of its food supply; it is necessary to prevent that inconsiderate incentives for the use of biomass in some countries will lead to a worsening of hunger in the world.
The worldgeothermal contributionto the electricity production is 65 TWh compared to 22000 TWh produced from other sources and the first 5 Countries (USA, Philippines, Indonesia, Mexico and Italy) have cumulatively a 70% share. An energy about 10 times higher is derived from geothermal energy as direct heat (Iceland is first for energy per capita) or exploiting, with heat pumps, heat close to the earth surface. The greatest potential for geothermal energy is located in China.
Wind and photovoltaicare the energy resources that had a huge development in recent years, largely due to generous incentives, particularly in Europe. Wind power has seen in the last 20 years its installed power going from about 2000 MW to 282000 MW at the end of 2012, with a production of 450 TWh, while photovoltaic systems from a negligible value to about 100000 MW, with a production of 100 TWh.
China, United States, Germany, Spain and India are the first 5 countries for wind production while Germany and Italy for photovoltaic electricity, leaving behind by far United States, Japan and Spain. Italy is the first nation in the world for photovoltaic percentage contribution to the electricity production (over 6%).
The “potential” wind annual production is 1.5 times the total consumption of primary energy in the world but it should be noted:
– the time variability of the actual available power;
– the low population density of the main windy areas (example, Patagonia) and the problems/cost of connection to the grid;
– the increase of environmental opposition (in particular in Italy).
6. – Energy efficiency
To measure the energy efficiency potential, it should be considered that the final consumption of about 8500 Mtoe has to be compared with 14000 Mtoe of primary energy produced per year.
The WEC report refers to another specific study and suggests only 2 glaring examples related to the electricity production and the use of electric motors.
The average efficiency of thermal power stations in the world is less than 33%. If they all (both coal and gas fired power stations) had the BAT (Best Available Technologies) we could save:
– 30% of the coal used for electricity production and 500 GW of coal-fired power plants could be removed from service;
– 30% of the consumed gas and 300 GW of gas-fired power stations could be elimi-nated;
– more than 3 billion tonnes of CO2.
The electric motors in the world consume 50% of electricity, about 10000 TWh. With the widespread use of high performance engines and inverters, when nedeed, we would save:
– at least 1000 TWh (the consumption of Japan);
– 200 GW of generating facilities (4 times the power peak needed in Italy);
– more than 600000 tonnes of CO2/year.
7. – Main developments in the last 20 years
Table VIII summarizes the global overview at the end of 2011 compared to the 1993 overview. It can be noted that despite the 27% increase in the population, there has been a 48% increase in the primary energy production and a 76% increase in the electricity production, which, as mentioned in the introduction, always assumes greater importance in the energy scenario.
Figure 3 shows the evolution of the primary energy production from 1993 to 2011 and 2020 (forecast by WEC scenarios) divided into fossil fuels, hydroelectric stations (greater than 10 MW), nuclear power and other renewables (including hydro less than 10 MW).
Taking into account the current proven reserves of coal (over 110 years with present energy consumption), gas (60 years) and conventional oil (56 years) and the enormous proven reserves of not conventional oil and gas, there is no shortage of fossil fuels for well over a century (goodbye “peak oil”).
The open problems are:
– environmental impacts of energy production and use;
TableVIII. –Global overview on 2011 compared to the situation on 1993 (source: World Energy Council, 2013).
8. – Conclusions
Apart from renewable energy sources, coal has had the strongest consumption per-centage growth in the last twenty years, since it is used on a large scale in countries like China and India for electricity production while oil has been losing its role as the great leading energy resource.
Fossil fuels account for 82% of total energy use of mankind. For the electricity production (∼22000 TWh worldwide):
– coal is still the main resource with a 40% share;
– followed by gas with 22.5%, 16% hydroelectric, 13% nuclear, 4% oil, 2.4% wind and other renewable with 2.1% (0.4% PV).
Nuclear
Fossil
2020
17 208 Mtoe
2%
Renewables (other than large hydro)
Hydro (>10MW)
6% 16%
2011
14 092 Mtoe
2% 5% 76%
11%
1993
9 532 Mtoe
2% 6% 82%
10%
82%
Fig. 3. – Total primary energy production in 1993, 2011 and 2020 by type of resources (source: WEC Survey of Energy Resources 1995, World Energy Resources in 2013 and WEC World Energy Scenarios to 2050).
The main drivers in energy sector over the past 20 years, without pretending a priority order, have been:
– emerging of environmental issues but without a common approach to emission reductions: collapse of CO2 price in EU ETS;
– continued growth in energy consumption, electricity in particular;
– explosive increase in renewables, Wind and PV in particular, mainly in Europe due to generous government subsidies over the past 10 years; however the share of “new” renewables still remains at about 1% of the total primary energy resource endowment and about 3% in electricity production;
– low oil prices at about 30 USD per barrel have increased significantly since 2001 reaching the average of about 100 USD;
– impact of Fukushima on nuclear industry;
– development of shale gas in the United States with a drop in local gas prices which are 1/3 of gas prices in Europe and 1/5 of those in the Far East;
– the “Arab Spring”;
– energy efficiency potential which failed to materialise;
– growing influence of public opinion on energy policies;
– rapid spread of information technologies in all sectors.
Further readings