BY
DAVID FRANK BIBBY
Department o f Virology,
Royal Free and University College Medical School,
W 1T4JF
A thesis submitted to The University o f London
in fulfilment for the degree o f Doctor o f Philosophy
All rights reserved
INFORMATION TO ALL USERS
The quality of this reproduction is dependent upon the quality of the copy submitted.
In the unlikely event that the author did not send a complete manuscript and there are missing pages, these will be noted. Also, if material had to be removed,
a note will indicate the deletion.
uest.
ProQuest 10015000
Published by ProQuest LLC(2016). Copyright of the Dissertation is held by the Author.
All rights reserved.
This work is protected against unauthorized copying under Title 17, United States Code. Microform Edition © ProQuest LLC.
ProQuest LLC
789 East Eisenhower Parkway P.O. Box 1346
Treatment of HIV-1 infection with 3’-azido-2’,3’-dideoxythymidine (AZT) frequently results in the evolution of viruses harbouring varying combinations of point mutations within the reverse transcriptase (RT) domain which confer increasing levels of resistance to AZT. It has been demonstrated that two such mutations (M41L and T215Y) reduce the replicative capacity of HlV-1 and are selected against in the absence of AZT. For this thesis, a patient undergoing AZT monotherapy was identified (A3), in which M41L and T215Y emerged only after therapy had been discontinued. It was proposed that rather than universally decreasing fitness, these mutations could increase fitness in the context of different RT genotypes.
A system was developed to generate recombinant HlV-1 stocks containing populations of sample-derived RT domains in a constant genetic background. The widely-used recombinant virus assay in which sample-derived sequences are inserted into a virus backbone by homologous recombination was adapted in order to prevent undefined and/or undesired sample-derived sequences being incorporated into recombinant viruses. Phenotypic differences between recombinant viruses could thus be ascribed solely to their differing RT domains. One of two silent point mutation markers was engineered into each recombinant, allowing the relative frequencies of mixed virus populations to be assayed by a highly-reproducible quantitative point mutation assay. Measuring the rate of change of these frequencies during pair-wise competition experiments enabled calculation of relative fitnesses.
Many thanks are owed to many people, without whom this thesis would never have happened. Firstly, thanks to my supervisors - Professor Richard Tedder, Dr Steve Kaye, and Dr Peter Balfe - for their help, guidance and support throughout my PhD. Secondly, my family deserve more than a little gratitude for their persistent faith, and for their unquestioning moral and financial assistance at the numerous critical points when their interventions single-handedly rescued me from succumbing to defeat. Also, my colleagues in the Department o f Virology in which I carried out this work provided invaluable advice and support, including (but not limited to) Paul Grant, Phillip Tuke, Bridget Ferns, Julie Bennett, Ursula A yliffe, Samreen Ijaz, Chris Perrons, Anna Hayman, Sara Bissett, Jim Waite, Stuart Kirk, Kevin Whitby, Sonia Turner, and Jeremy Garson. A special hand of gratitude is extended to the staff at the virology department in Utrecht, particularly W ilco Keulen, Monique Nijhuis, and Charles Boucher, for being so welcoming and accommodating during my six week visit to learn about the recombinant virus assay and fitness. I would also like to acknowledge the forbearance o f the countless individuals who I have lived with during my PhD - with hindsight, their tolerance o f my fluctuating stress levels is much appreciated. Finally, I would like to thank Jayne W oodcock for her unstinting love and support, without which it would never have seemed quite so worthwhile.
Abstract________________________________________________________________________ 2 Acknowledgements_______________________________________________________________3 Contents________________________________________________________________________ 4 Figures_________________________________________________________________________ 7 Tables_________________________________________________________________________ 13 Abbreviations__________________________________________________________________ 15
1. Introduction______________________________________________ 17
1.1. Retroviridae _____________________________________________________________ 19
1.1.1. The Lentivirus G e n u s ______________________________________________________________ 22
1.2. HIV-1 Infection__________________________________________________________ 24
1.2.1. Transm ission______________________________________________________________________ 25 1.2.2. Aetiology__________________________________________________________________________26
1.3. The Life C ycle___________________________________________________________ 30
1.3.1. Transcription and T ranslation ________________________________________________________35 1.3.2. Virion Assembly and R elease________________________________________________________ 36 1.3.3. Fusion and E n try ___________________________________________________________________ 38 1.3.4. Reverse T ranscription______________________________________________________________ 39 1.3.5. Integration and Latency_____________________________________________________________ 45
1.4. Antiretroviral Therapy____________________________________________________ 46
1.4.1. Nucleoside A nalogues______________________________________________________________ 48 1.4.2. Acyclic Nucleotide A n alo g u es_______________________________________________________48 1.4.3. Non-Nucleoside Reverse Transcriptase In h ib ito rs______________________________________ 49 1.4.4. Protease Inhibitors__________________________________________________________________ 50 1.4.5. Other Antiretroviral Strategies _______________________________________________________50
1.5. Resistance to Antiretroviral Compounds____________________________________ 52 1.6. Evolution of HIV-1 _______________________________________________________ 59
1.6.1. RNA Virus Population D ynam ics____________________________________________________ 59 1.6.2. Sources of Genetic Variation in H IV -1________________________________________________ 62 1.6.3. The HIV-1 Q uasispecies____________________________________________________________ 63 1.6.4. Effects of Drug Resistance on the Evolution o f H IV -1__________________________________ 65
1.7. Outline of the Thesis______________________________________________________ 70
2. Design and Application of the pHIVEC Vector System___________ 72
2.1. Introduction 72
2.2. Construction of pHIVEC 76
2.3. Methods 83
2.4. Results 86
3.2. Construction of the Shuttle V ecto r_________________________________________ 96 3.3. M ethods________________________________________________________________ 98 3.4. Results and Analysis_____________________________________________________100 3.5. Discussion______________________________________________________________ 110
4. Design and Application of a Shuttle Vector System (I I ) _________ 112
4.1. Introduction____________________________________________________________ 112 4.2. pRTshut_______________________________________________________________ 113 4.3. M ethods_______________________________________________________________ 120 4.4. Results and Analysis_____________________________________________________122 4.5. Discussion______________________________________________________________ 130
5. The Restriction-Endonuclease-Ligation System________________ 132
5.1. Introduction____________________________________________________________ 132 5.2. Design_________________________________________________________________ 135 5.3. Materials and Methods___________________________________________________141 5.4. Results and Analysis_____________________________________________________145 5.5. Discussion______________________________________________________________ 151
6. Development of a Quantitative Point Mutation Assay___________ 155
6.1. Introduction____________________________________________________________ 155 6.2. Materials and Methods__________________________________________________ 158 6.3. Results and Analysis_____________________________________________________162 6.4. Discussion______________________________________________________________ 166
7. Relative Fitness Analysis of the AZT Resistance Mutations M41L and
T215Y _____________________________________________________ 168
7.1. Introduction____________________________________________________________ 168 7.2. Competition Protocol____________________________________________________169 7.3. Results and Analysis_____________________________________________________170 7.4. Discussion______________________________________________________________ 172
8. Relative Fitness Analysis of Patient RT Domains_______________ 175
Appendix A: Materials and General Methods_____________________ 259
A .l Plasma and Serum Samples_______________________________________________259 A.2 Primer and Oligonucleotide Sequences_____________________________________ 260 A 3 Escherichia c o l i_________________________________________________________ 263 A 4 Mammalian Cell Lines and Growth M e d ia _________________________________ 264 A.5 Polymerase Chain Reaction______________________________________________ 265
A.5.1 A m plira^-M ediated P G R __________________________________________________________ 265 A.5.2 Expand-M ediated P G R ____________________________________________________________ 266
A.6 Reverse Transcription____________________________________________________ 266
A .6.1 The Superscript II System__________________________________________________________ 267 A.6.2 The Titan RT-PGR S y stem _________________________________________________________ 267
A.7 Restriction Endonuclease Digestion________________________________________ 267 A.8 Nucleic Acid Purification_________________________________________________268
A .8.1 Purification of DNA from Agarose Gels, Restriction Digests and P G R s __________________ 268 A .8.2 Preparation of Plasmid DNA from Bacterial Gultures __________________________________268 A.8.3 DNA Purification by Phenol-Ghloroform E x tra c tio n ___________________________________269 A.8.4 Purification of RNA from Plasma and Serum - the Boom P rotocol______________________ 270 A.8.5 Extraction o f RNA from Gulture Supernatants________________________________________ 271
Figures
FIGURE 1-1: The general organisation o f retrovirus genomes. Protein coding regions are shaded orange. The yellow U5 and U3 sections contain sequences involved in the regulation o f transcription. The PBS (primer binding site), the polypurine tract (PPT) and the R (repeat) regions comprise short sequences
involved in reverse transcription. 21
FIGURE 1-2: Phylogenetic tree (drawn to scale) based on Pol gene sequences showing the evolutionary relationships within the Primate Lentivirus Group, adapted from Hahn et al., 2000. 23 FIGURE 1-3: Schematic o f the HIV-1 genome. The upper, shaded figure represents the organisation o f the
integrated, double-stranded DNA genome, below which is an arrow showing the sequences encompassed by the smaller, single-stranded RNA genome found in virions. The colour coding is identical to that o f FIGURE I-l (page 21), with the additional components o f the regulatory proteins
(green) and accessory proteins (blue). 31
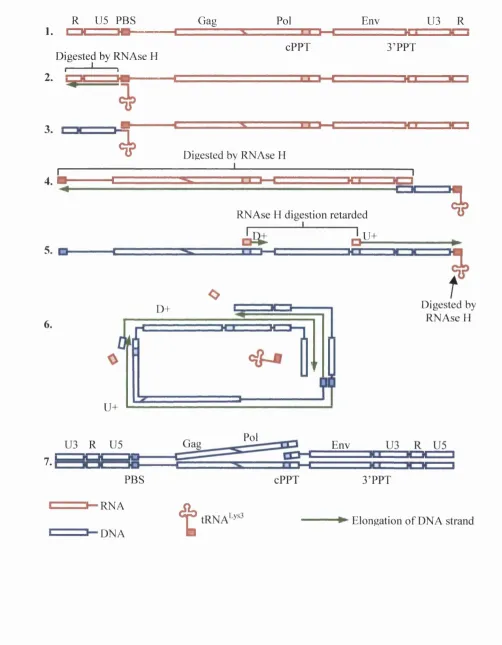
FIGURE 1-4: Schematic o f the HIV-1 life cycle. (1) Transcription. (2) Translation. (3) Assembly. (4) Budding and Release. (5) Attachment. (6) Fusion and Entry. (7) Reverse Transcription. (8) Nuclear Import. (9) Integration. (A) Nef/Vpu degradation o f CD4 and MHC class I molecules. 34 FIGURE 1-5: Schematic diagram o f the process o f reverse transcription (after Gotte et al., 1999). 44 FIGURE 1-6: A simplified two-axis representation o f Fisher’s geometric model o f evolution. 60 FIGURE 2-1: The principle o f homologous recombination. The shaded blocks represent sequences where the
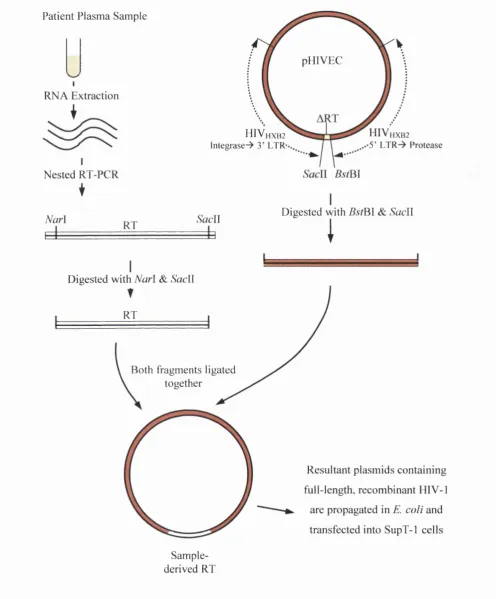
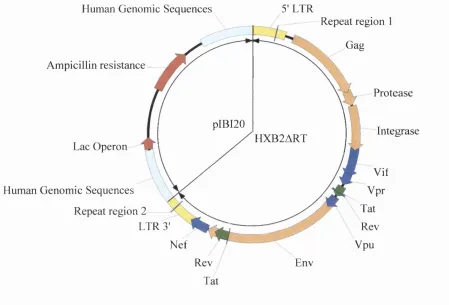
derivation (either from the vector or from the sample virus) is undefmable. 73 FIGURE 2-2: Schematic outline o f the pHIVEC vector system for the generation o f recombinant HIV-1. 75 FIGURE 2-3: A schematic representation o f plasmid pHXB2ART (~12.5kb), from which pHIVEC was
derived. 77
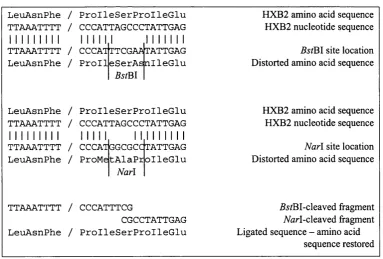
FIGURE 2-4: The nucleotide sequence o f the 3’ terminus o f HXB2 reverse transcriptase, showing the location o f a potential silent SacII discovered using Vector NTI software. 78 FIGURE 2-5: The two-site method for ligation o f PCR amplified RT inserts and the pHIVEC vector at the
protease-RT junction. 78
FIGURE 2-6: Schematic diagram showing how the oligonucleotides in TABLE 2-1 align with the Pol domain o f pHXB2a RT. The restriction sites introduced by these primers are also shown. 80 FIGURE 2-7: Digests o f pHXB2ART. Lane 1 - pHXB2ART (uncut). Lane 2 - pHXB2ART digested with
Mscl. Lane 3 - pHXB2ART digested with Xmal. Lane 4 - pHXB2ART digested with both MscI and Xmal. Lane 5 - PCR product from pHXB2ART using primers Sac-Site and Mut-aSense. Lane 6 - PCR product from Lane 5 digested with both Mscl and Xmal. 81 FIGURE 2-8: PCR amplification using primers 706M and Mut-aSense. Lanes 1-3 respectively - pMCS79,
pHXB2ART, and a colony obtained from ligation between the bands purified from FIGURE 2-7. 81 FIGURE 2-9: Lanes 1 and 2 - SacII digestion o f the amplicons shown in Lanes 2 and 3 o f FIGURE 2-8
respectively. 81
AD-2. The expected amplicon o f l,050bp should cleave with BstBI to generate fragments o f 907bp and 143bp. The arrows indicate the four products yielding correct amplification and digestion products. Lane 18 - amplicon from unmodified pHXB2ART SacII subjected to BstBI digestion. 82 FIGURE 2-11 : Alignment o f the 'Inner' PCR primer set on HIV-1 Pol domains (upper set - protease-RT
junction, lower set - 3 ’ end o f RT). Restriction sites introduced by the primers are highlighted in bold
type. 85
FIGURE 2-12: Double restriction digests o f pHIVEC. Lane 1 - digestion with both BstBI and BsaBI. Lane 2
- digestion with both SacII and Spel. 86
FIGURE 2-13: Results of'gradient PCRs' using primers Inner-1 and either Inner-2a (top picture) or Inner-2b (bottom picture). The temperature o f the annealing steps ranged from 42°C to 56”C in 2°C increments.
88
FIGURE 2-14: Sample second-round PCRs o f sample-derived first-round RT-PCR products using primers Inner-1 and Inner-2a (upper picture), and Inner-1 and Inner-2b (lower picture). 88 FIGURE 2-15: Lanes 1-12 - Sample PCR screen o f ligations between pHIVEC and sample-derived RT
inserts. Lane 13 - self-ligation (no insert). Lane 14 - negative control (pHIVEC). Lane 15 - positive PCR control (pHXB2). Lane 16 - negative PCR control (water). The band visible in lane 14
corresponds to plasmid template (pHIVEC) carried through the PCR.. 89 FIGURE 2-16: Lanes 1-5 - Sample PCR screen o f plasmids obtained from E. coli transformed with pHIVEC- RT insert ligations. Lane 6 - negative PCR control (water). Lane 7 - positive PCR control (pHXB2). 89 FIGURE 2-17: Five typical plasmid DNA preparations obtained after transforming ligations between
pHIVEC and RT inserts amplified from RNA extracted from the A3 series samples. The molecular weight standards comprise linear DNA whereas plasmid preparations are predominantly composed of supercoiled DNA. Note how the band patterns are inconsistent. 90 FIGURE 3-1: Schematic outline o f the first shuttle vector system employed in the generation o f recombinant
HIV-1. 95
FIGURE 3-2: Schematic o f pGEM-T Easy Vector (from Promega Corporation, Madison, WI). 97 FIGURE 3-3: Schematic o f pGEM-TART (3,965bp). Domains from pGEM-T are coloured blue, and the Pol
domains from pHIVEC are coloured red. 97
FIGURE 3-4: Alignment o f the 'IN' primer set on HIV-1 Pol domains (upper set - protease-RT junction, lower set - 3 ’ end o f RT). Restriction sites introduced by the primers are highlighted in bold type. 98 FIGURE 3-5: Sample gel showing the high yield variability amongst second-round PCR amplifications o f
sample-derived RT domains using the primer set IN-1 and IN-2a, compared to the efficiency of amplification from plasmid-derived template. Lane 1 - pHXB2 as template. Lanes 2-8 - sample-derived
templates. 101
FIGURE 3-6: Sample gel showing how some sample-derived material failed to amplify using primers IN-1 and IN-2b. Lanes 1-5 - amplifications o f sample-derived material. Lane 6 - Negative PCR control (water). Lane 7 - Positive PCR control (pHXB2). 101 FIGURE 3-7: PCR screening o f ligations between pGEM-TART and RT inserts. Lanes 1-12 - using T7 and
469W as primers. Lanes 13-24 - using 111W and aSp6 as primers. In each row, the order o f samples is as follows: eight ligations, self-ligation, negative PCR control (water) and positive PCR control
(pHXB2). 102
FIGURE 3-9: PCR amplification o f plasmid DNA migrating at a rate consistent with 5.6kb supercoils (as shown in FIGURE 3-8), using primers 706M and 708M. Lanes 1-4 - purified plasmid DNA as
template. Lane 5 -Positive PCR control (pHXB2). Lane 6 - Negative PCR control (water). 104 FIGURE 3-10: PCR amplification o f purified plasmid DNA migrating at a rate consistent with 5.6kb
supercoils using primers S-HR and AS-HR. Lanes 1-5 - purified plasmid DNA as template. Lane 5 - Positive PCR control (pHXB2). Lane 6 - Negative PCR control (water). 105 FIGURE 3-11: Restriction endonuclease analysis o f a plasmid obtained after transformation o f a ligation
between pGEM-TART and a plasmid template-derived RT insert. Lanes 1-3 - uncut supercoiled plasmid. Lane 4 - plasmid digested with Apal and SacII. Lane 5 - plasmid digested with Apal and EcoRV. Lane 6 - plasmid digested with Apal and EcoRI. Note the multiple digestion in products the
final lane. 105
FIGURE 3-12: Plasmid DNA extracts fi’om bacteria transformed with pGEM-TART-RT insert ligation reactions and separated by overnight electrophoresis. RT inserts were obtained from plasmid templates (e.g. pHXB2). The banding patterns are discussed in the text. 106 FIGURE 3-13: Electrophoresis profiles o f plasmid extracts obtained from bacteria transformed with pGEM-
TART-RT insert ligation reactions where the RT inserts were obtained from sample material, showing the presence o f diverse DNA species smaller in size than pGEM-TART. 106 FIGURE 3-14: Plasmid DNA extracts from bacteria ‘re-transformed’ with gel-purified DNA from putative
insert-positive pGEM-TART constructs seen in FIGURE 3-13. 108 FIGURE 3-15: Lanes 1-5: Amplifications from purified insert-positive pGEM-TART constructs using primers
S-HR and AS-HR. Lane 6 - Negative PCR control (water). Lane 7 - Positive PCR control (pHXB2). 108 FIGURE 3-16: ELISA data (p24 antigen concentration) from the successful transfection o f amplified Pol
sequences from pGEM-T"^^^'^ and the transfection o f Pol sequence amplified directly from pHXB2. The cut-off for p24 detection was lOOpg/ml. 109 FIGURE 3-17: Lane I - RT-PCR product using recombinant virus pGEM-TART”^®^'® RNA as template and
primers 111W and G5804. Lane 2 - SacII digestion o f RT-PCR product in Lane 1. Lane 3 - identical amplification o f recombinant virus generated using the positive PCR control product (HXB2). 109 FIGURE 4-1: HXB2 sequences at the 5' and 3' ends o f RT showing potential silent restriction sites for use in a
new shuttle vector. Mismatches are highlighted in bold type. 114 FIGURE 4-2: Comparison o f the nucleotide sequences and restriction maps o f the RT-deletion regions of
pGEM-TART and pRTshut. 114
FIGURE 4-3: Schematic diagram o f the RT-deletion region o f pGEM-TART, showing the alignments o f the
mutagenic primers INT-X and M UN-1. 115
FIGURE 4-4: Restriction endonuclease digests o f pGEM-TART and two mutagenic PCRs (see text). Lane 1 - pGEM-TART uncut (supercoiled plasmid). Lanes 2-4 - digests I-III detailed in TABLE 4-2. Lane 5 - T7-MUN-1-primed PCR digested with Apal and SacII. Lane 6 - INT-X-aSp6-primed PCR digested with SacII and EcoRI. The boxed bands were excised and purified. 117 FIGURE 4-5: Double restriction endonuclease digests on ‘intermediate’ plasmid constructs. Lane 1: pGEM-
TART-Xbal digested with SacII and EcoRI, Lanes 2-5: pGEM-TART-Mfel A-D respectively, digested with Apal and SacII. Boxed bands were excised and purified. 118 FIGURE 4-6: Double restriction endonuclease digests on ‘intermediate’ plasmid constructs. Uppermost bands
pGEM-TART-Mfel A through D, digested with EcoRI and SacII. Boxed bands were excised and
purified 118
FIGURE 4-7: Alignment o f the 'Mut' primer set on HIV-1 Pol domains (upper set - protease-RT junction, lower set - 3 ’ end o f RT). Restriction sites introduced by the primers are highlighted in bold type. The alternate bases at the third base o f the final RT codon in the lower alignment were introduced for the purposes o f future qPMA analysis o f mixed virus populations. 121 FIGURE 4-8: Gradient PCR using first round product amplified from a sample with low copy number RNA.
Top row: Mut-5-Mut-3T, Bottom row: Mut-5-Mut-3C. 123 FIGURE 4-9: Schematic o f the l,717bp Mut-5-Mut-3T PCR product, showing the location o f recognition
sequences for restriction endonucleases Xbal, Mfel, BsrGI, and NlalV. 124 FIGURE 4-10: Investigation into the activity o f restriction endonucleases Xbal and M fel on Mut-5 and
Mut-3T/C-primed PCR products. Lanes 1-6 - reactions A-F respectively from TABLE 4-4. 124 FIGURE 4-11 : Mfel-Xbal-digested Mut-5-Mut-3C PCR products fi-om six sample-derived first round
products (lanes 1-6), two plasmid templates (lanes 7 and 8), and pRTshut digested with Mfel and Xbal
(lane 9). 125
FIGURE 4-12: Lane 1 - Insert-positive pGEM-TART plasmid from section 2. Lane 2 - undigested pRTshut. Lanes 3-6 - Plasmid DNA extracted from transformed pRTshut-RT insert ligations. Boxed bands represent the putative insert-positive constructs. 126 FIGURE 4-13: Lanes 1-3 - Three DNA extracts from bacteria ‘re-transformed’ with bands corresponding to
those boxed in FIGURE 4-12. Lanes 4-6. The same plasmids as in lanes 1-3 after digestion with Xbal
and Mfel. 127
FIGURE 4-14: PCR screens o f seven ligations using sample-derived RT domains. Top row: S-HR-469W- primed PCRs, Middle row: S-HR-AS-HR-primed PCRs, Bottom row: 11 IW-AS-HR-primed PCRs. In each row, lanes 1-7 - pRTshut-RT insert ligations, lane 8 - self-ligation, lane 9 - negative PCR control (water), lane 10 - positive PCR control (pHXB2). 127 FIGURE 4-15: Lanes 1-7 - electrophoretic profiles o f seven DNA species extracted from bacterial cultures
transformed with pRTshut ligated to sample-derived PCR-amplified RT domains. Lane 8 - DNA extracted fi’om bacteria transformed with pRTshut self-ligation. The arrow indicates the row o f bands
that were excised. 128
FIGURE 4-16: Lanes 1-5 - The bands excised from FIGURE 4-15 after purification. Lane 6 - insert-positive pGEM-TART from section 03 as a transformation control. Lanes 7-11 - plasmid DNA derived from transformation o f the material in lanes 1-5 respectively. 129 FIGURE 4-17: 'Final' PCRs on purified insert-positive bands using primers S-HR and AS-HR. Lanes 1-9 -
bands purified as per those shown in FIGURE 4-15 as templates. Lane 10 - negative PCR control (water). Lane 11 - poositive PCR control (pHXB2). The templates for the PCRs shown in lanes 3 and 4 were putatively insert-positive plasmids containing RT domains derived from pHXB2-based plasmids (see text). The templates for the other PCRs were plasmids whose RT domains would have been
sample-derived. 129
FIGURE 5-1: Schematic o f the restriction-endonuclease-ligation (REL) method o f recombinant virus
generation. 134
FIGURE 5-2: The 3'-terminal sequence o f HXB2 protease showing potential ‘silent’ 6-base sequences with
central 4-base palindromes. 136
FIGURE 5-3: Nucleotide manipulations involved in restriction-endonuclease-ligation cross-ligation at the
protease-RT junction. 137
FIGURE 5-4: The 5'-terminal sequence o f HXB2 integrase showing potential ‘silent’ 6-base sequences with central 4-base palindromes. The nucleotide sequence shown begins with the first base o f integrase. 139 FIGURE 5-5: Nucleotide manipulations involved in restriction-endonuclease-ligation cross-ligation at the
RT-integrase junction. 140
FIGURE 5-6: Alignment on HIV-1 Pol domains (upper set - protease-RT junction, lower set - 3 ’ end o f RT) o f the primer set used in this section. Restriction sites introduced by the primers are highlighted in bold
type. 142
FIGURE 5-7: Repeated 'gradient PCR' using primers S-MT5 and AS-MT3B with anneal temperatures ranging
from 52°C to 66°C in 2°C intervals. 146
FIGURE 5-8: Agarose gel allowing relative yield analysis o f five sample-derived RT domains (lanes 1-5), two plasmid-derived RT domains (lanes 6 & 7), and the two flanker sequences (lanes 8 and 9). 146 FIGURE 5-9: Enzyme optimisation by lambda digestion (I). Lanes I, 5, 8, and 15 - molecular weight
markers. Lanes 2-4 - BspEI in NEB #3, NEB #4, and SUB respectively. Lanes 6-7 - BspEI and NgoMIV in NEB #4 and SUB respectively. Lanes 9-14 - Paired ApaLI and ApaLI & NgoMIV digests in NEB #3, NEB #4, and SUB respectively. 147 FIGURE 5-10: Enzyme optimisation by lambda digestion (I). Lanes 1, 5, 9, 12, and 16 - molecular weight
markers. Lanes 2-4 - EcoRI in buffers U. NEB #4, and SUB respectively. Lanes 6-8 - Mfel in buffers NEB #3, NEB #4, and SUB respectively. Lanes 10-11 - EcoRI & Mfel double digests in NEB #4 and SUB respectively. Lanes 13-15 - BspEI, NgoMIV, EcoRI, & Mfel multiple digests in buffers NEB #3,
NEB #4, and SUB respectively. 148
FIGURE 5-11: Experiment investigating the effect o f flanker: insert ratio in REL reactions on the frequency o f undesired ‘final’ PCR products. Lanes 1-4 - fianker:insert ratios o f 1:3, 1:10, 1:30, and 1:100. Lane 5 - negative PCR control (water). Lane 6 - positive PCR control (pHXB2). 150 FIGURE 5-12: An example o f Expand-mediated S-HR/206V-primed PCRs on REL reaction products. Lanes
1-4 - REL reaction products. Lane 5 - negative water PCR control. Lane 6 - positive PCR control
using pHXB2 as template. 150
FIGURE 6-1 : Schematic o f the principle o f the quantitative point mutation assay (qPMA). 157 FIGURE 6-2: Location within Pol o f the primers detailed in TABLE 6-1. 158 FIGURE 6-3: Graphical representation o f the data from TABLE 6-3, showing the calculated output values for
each o f the three series o f standard curve data. 164 FIGURE 6-4: Graphical representation o f the data shown in TABLE 6-3, showing the mean output
frequencies at each input percentage, with standard error bars. A unit gradient line (dashed) is also
presented. 164
FIGURE 6-5: Graph o f the data in TABLE 6-4, with a line o f equivalence (dashed). 165 FIGURE 6-6: Gel photo o f the two controls from the experiment producing the data in TABLE 6-4. Lane 1:
100% ‘A ’, Lane 2: 100% ‘G ’. 165
FIGURE 8-1: Data from subject 'A3', showing RNA viral load pattern over time, together with PMA analysis of three AZT resistance-associated mutations (codons 41, 70 and 215) and duration o f AZT therapy. Codons 67 and 219 were consistently wild-type (Kaye, 1997). 177
FIGURE 8-2: Graphical representation o f the data given in TABLE 8-1, with a linear trend line. 180 FIGURE 8-3: Graphical representation o f the data presented in TABLE 8-2 and 8-3 with linear trend lines for
each o f the three series. 183
FIGURE 8-4: Graphical representation o f the data presented in TABLE 8-4, with the day at which each sample was taken against the mean rate o f change o f virus frequency in competition with HXB2. 185 FIGURE 8-5: Scatter plot o f H IV -1 RNA viral load and relative RT fitness, from the A3 patient samples - r =
0.886, p = 0.023. 186
FIGURE 8-6: The relationship between relative fitness o f RT populations in patient A3 and RNA load over the 192 day study period, with sequence changes from the baseline sample highlighted (changes to codons associated with AZT resistance are emboldened). 190 FIGURE A-1: Schematic o f the 3' terminus o f HXB2 Gag and the entire HXB2 Pol domain, showing the
location o f the binding sites for the primers listed in the upper part o f TABLE A-1. 260 FIGURE A-2: Location o f the binding sites within HXB2 Pol o f the sequencing primers detailed in TABLE
A-2. 262
Tables
TABLE 1-1: Retrovirus taxonomy. 21
TABLE 1-2: Lentivirus taxonomy. 21
TABLE 1-3: Clinical conditions indicative o f Category B and Category C HIV-1 infections. 29
TABLE 1-4: Overview o f the HIV-1 proteins. 32
TABLE 1-5: Table o f nucleoside analogue compounds currently licensed for anti-HIV therapy. 49 TABLE 1-6: Table o f mutations in RT associated with lowered susceptibility to NNRTIs. Mutations in bold
type are those most frequently found in vivo (Deeks, 2001). 58 TABLE 2-1: Oligonucleotides used specifically for the construction o f pHIVEC. 80 TABLE 2-2: Second-round PCR primers unique to this section. Inner-2a and Inner-2b differed at a single
nucleotide position (boxed). 85
TABLE 3-1 : Specific primers used in this section. 98 TABLE 4-1 : Specific oligonucleotides used in the synthesis o f pRTshut. 115 TABLE 4-2: The three restriction endonuclease combinations used to digest pGEM-TART, and the predicted
band sizes thereof. 117
TABLE 4-3: Primers synthesised to replace the ‘IN ’ series. 121 TABLE 4-4: Restriction endonuclease compositions o f the six digest reactions. 123 TABLE 5-1: Analysis o f the 4-base palindromes in FIGURE 5-2. Enzymes listed in parentheses leave
overhangs upon cleavage rather than underhangs. 136 TABLE 5-2: Analysis o f the sequences shown in FIGURE 5-4. Enzymes listed in parentheses leave
overhangs upon cleavage rather than underhangs. 139 TABLE 5-3: Specific primers used in this section. 142 TABLE 5-4: Activities at 25°C o f the enzymes used in the REL, relative to their activities at 37°C. 153 TABLE 6-1 : Primer sequences used in the final qPMA protocol. 158 TABLE 6-2: Compositions o f the buffers used in the qPMA protocol. 159 TABLE 6-3: Data from three qPMA experiments using the same standard curve samples. 163 TABLE 6-4: TopCount data and analysis from experiments in which five RNA extracts were subjected to
duplicated second-round PCRs and qPMAs. 165
TABLE 7-1: qPMA data from a 10-day direct competition between rvHXB2"^ and rvHXB2-41L /215
showing the raw data, and the method o f calculating virus frequency. 170 TABLE 7-2: qPMA data from a 10-day direct competition between HXB2-41L/215Y'^ and HXB2‘^ showing
the raw data, and the method o f calculating virus frequency. 171 TABLE 8-1 : qPMA data from the reciprocal virus experiment. 179
TABLE 8-2: qPMA data and analysis from parallel secondary competition assays competing rvAS-O"^ against
rvHXB2°. 182
TABLE 8-3: qPMA data and analysis from a secondary competition assay competing rvAB-O"^ against
E X B 2°. 182
TABLE 8-4: Collected data from competition assays between A3 sample RT domains and HXB2 RT, showing the loge o f the percentage change in frequency o f the A3-derived virus per day over experimental periods o f 5-7 days. Mean and standard error o f the mean values for each o f the five
timepoint samples were calculated. 184
TABLE 8-5: p-values from two-tailed two-sample t tests assuming unequal variances between each
permutation o f paired data sets from those presented in TABLE 8.4. Values below 0.05 are highlighted
in bold type. 186
TABLE 8-6: Summary o f sequencing data from the A3 samples. Only RT codons varying from the HXB2 reference sequence are presented. Polymorphic amino acids reflect relative peak heights o f -50% . 189 TABLE 8-7: Expanded detail o f the collected codon changes within RT observed in samples taken during the
first 77 days o f the study period. 199
TABLE 8-8: Expanded detail o f the collected codon changes within RT observed in samples taken during the
final 67 days o f the study period. 199
TABLE A -1 : General primer sequences 261
TABLE A-2: Details o f the primer sequences used for sequencing RT domains 262 TABLE A-3: Buffer compositions for the Boom extraction protocol 271
A adenosine
AIDS Acquired immune deficiency syndrome
ATP adenosine triphosphate
AZT 3 ’ -azido-2’ ,3 ’ -dideoxythymidine
bp base pair(s)
C cytidine
CDC Communicable Diseases Center (Atlanta, USA)
cD N A complementary DNA
ddC 2 ’ ,3 ’ -dideoxycy tidine
ddl 2 ’ ,3 ’ -dideoxyinosine
D NA deoxyribonucleic acid
dNTP deoxynucleotide triphosphate
DTT dithiothreitol
EDTA ethylene diamine tetra-acetic acid
ELISA enzyme-linked immunosorbent assay
PCS foetal calf serum
G guanosine
HAART highly active antiretroviral therapy HIV-1 human immunodeficiency virus type I HIV-2 human immunodeficiency virus type 2
kb kilobase pairs
LTR long terminal repeat
NNRTI non-nucleoside reverse transcriptase inhibitor
nt nucleotide(s)
PBMC peripheral blood mononuclear cell
PBS phosphate buffered saline / primer binding site
PI protease inhibitor
PIC pre-integration complex
qPMA quantitative PMA
RNA ribonucleic acid
RT reverse transcriptase
RTC reverse transcription complex
RVA recombinant virus assay
SIV simian immunodeficiency virus
T thymidine
Tris tris(hydroxyethyl) aminomethane
tRNA transfer RNA
3-TC 2 ’ ,3 ’ -dideoxy-3 ’ -thiacy tidine
U Uridine
ZDV zidovudine
A m ino acid abbreviations
A, Ala Alanine M, Met Methionine
C, Cys Cysteine N, Asn Asparagine
D, Asp Aspartic Acid P, Pro Proline
E, Glu Glutamic Acid Q, Gin Glutamine
F, Phe Phenylalanine R, Arg Arginine
G, Gly Glycine S, Ser Serine
H, His Histidine T, Thr Threonine
I, Ile Isoleucine V, Val Valine
K, Lys Lysine W, Trp Tryptophan
L, Leu Leucine Y ,T y r Tyrosine
1. Introduction
In 1981, several incidences of opportunistic infections together with severe immune dysfunction were reported amongst thç homosexual populations o f Los Angeles, San Francisco and Manhattan (Hazuda et ah, 2000). B y 1982, hundreds o f cases o f this newly named ‘gay-related immunodeficiency syndrome’ (GRID) were identified. Intravenous drug users and haemophiliacs also began presenting with GRID symptoms, and the disease became known as ‘acquired immunodeficiency syndrome’ (AIDS) (CDC, 1982).
Early hypotheses suggested AIDS was caused by lifestyle and hyperstimulatation o f the immune system by foreign human antigens. Ultimately, these hypotheses failed to explain adequately certain transmission histories, and epidemiological analysis o f the outbreak indicated an infectious agent (Francis et al., 1983). Initially, the herpesviruses cytomegalovirus and Epstein-Barr virus were considered, due to their previous associations with immunosuppression. However, strong evidence implicated CD4^ T-helper lymphocytes as the target cell and the then recent discovery o f the first human retrovirus HTLV-1 and its T cell tropism led to suggestions that a similar agent was involved in the aetiology o f AIDS. In 1983, several groups reported their detection o f a retrovirus similar to HTLV in blood from AIDS patients (Gallo et al., 1983; Barre Sinoussi et al., 1983). Owing to its association with one o f the classic symptoms o f AIDS, it was initially named lymphadenopathy-associated virus (LAV). Evidence progressively mounted for LAV being the aetiological agent o f AIDS (Gallo et al., 1984; Blattner et al., 1988), and in 1985, LAV and another AIDS-associated virus that workers had called human T-lymphotropic virus type 111 were shown to be closely related strains o f the same virus - now known as human immunodeficiency virus type 1 (HlV-1) (Ratner et al., 1985).
Also in 1985, morphological and nucleic acid sequence comparisons were made between HlV-1 and other retroviruses. This led to its classification as a lentivirus, grouping it with previously described retroviruses o f animals such as equine infectious anaemia virus
(EIAV) and visna-maedi virus, but distinguishing it from the oncogenic human retroviruses HTLV-1 and HTLV-II (Gonda et ah, 1985). In the same year, the first complete nucleic acid sequence was obtained (Wain Hobson et al., 1985), and a closely related virus was isolated from a macaque with AIDS-like symptoms and named simian immunodeficiency virus, or SIV (Daniel et al., 1985). Other lentiviruses were discovered in primates whose geographical distribution matched that o f the African HIV-1 epidemic. Over twenty SIVs have currently been identified, and each is followed by a short suffix to indicate the host from which they were isolated, e.g. S I Vmacisolated from macaques (Beer et al., 1999).
Research in central and western Africa revealed extensive anti-HIV-1 seroprevalence and many individuals with AIDS-like symptoms (Brun-Vezinet et al., 1984). In 1985, a human lentivirus with biological and morphological characteristics similar to HIV-1 was isolated from a Senegalese AIDS patient seronegative for HIV-1. Following further examination, this virus was adjudged sufficiently dissimilar to both HIV-1 and S I Vmac for it to be labelled LAV-II - now known as HIV-2 (Barin et al., 1985; Clavel et al., 1986).
At the time o f writing (2002), it is estimated that over twenty million people have died from AIDS since the onset of the epidemic. The number o f current infections is reckoned to be approximately 36.1 million (including cases o f AIDS), with 5.4 million new infections in 1999 alone. Seventy percent o f all HIV-infected individuals are in sub-Saharan Africa, nearly 18% in Asia, and nearly 5% in Latin America. It is thought that over 90% o f these infected people are unaware o f their infected status. Furthermore, HIV predominantly infects the economically important young adult demographic (25-44 years o f age). Consequently, this pandemic is especially devastating to developing countries. The impact o f HIV-1 in particular cannot be overstated as the vast majority o f HIV infections worldwide are with this virus. Conversely, HIV-2 is largely restricted to countries epidemiologically linked with West Africa, e.g. Portugal, Brazil, and western India (Morison, 2001).
1.1.
Retroviridae
HIV-1 belongs to the Retroviridae family o f viruses - an extremely diverse and widespread group o f infectious agents of vertebrates. Although the first retrovirus infecting humans (HTLV-1) was only reported in 1981, animal retroviruses were observed indirectly as long ago as 1904 when retrovirus-mediated leukaemia was transmitted between chickens. At N ew York’s Rockefeller Institute in 1911, Peyton Rous extracted cell-free material from a chicken with tumours. Using this, he was able to induce tumours in another chicken. The infectious agent responsible is now known to have been a retrovirus, and once isolated was named Rous Sarcoma Virus. The discovery and characterisation o f many mainly oncogenic retroviruses followed these early steps, including the 1940s discovery o f visna-maedi virus in Icelandic sheep, following which the name lentivirus {lenti- meaning slow) was coined to describe this subset o f retroviruses with long incubation periods.
In 1966, Rous was awarded the Nobel Prize in Physiology or Medicine for his work on oncogenic viruses including retroviruses. Later that decade, Howard Temin observed that despite being RNA viruses, retrovirus replication could be prevented by inhibiting DNA synthesis. Together with Renato Dulbecco and David Baltimore, he shared the 1975 Nobel Prize in Physiology or Medicine for independently discovering reverse transcriptase enzymes and retroviral DNA intermediates.
Retrovirus virions are approximately 80-100nm in diameter, and take the form o f spherical enveloped particles with surface glycoprotein projections. Beneath this envelope is situated the matrix, surrounding the capsid. This latter contains the usually conical core, where the genome-containing ribonucleoprotein complex is found. The envelope and the core of mature virions are visible under the electron microscope as electron-dense structures, whereas the matrix is relatively electron-transparent.
The single-stranded RNA genomes o f retroviruses range from 7-1 Ikb in length and conform to the largely conserved pattern shown in FIGURE 1-1. Like mRNA transcripts,
their 5 ’ ends have 7-methyl guanine caps, and are poly-adenylated at their 3 ’ ends. Three major genes are common to all replication-competent retroviruses and are located centrally in the order Gag, Pol, and Env, with frequent overlapping. These code for structural, enzymatic, and envelope proteins respectively. Flanking the genes are non-coding regions including a primer-binding site (PBS) and a poly-purine tract (PPT). These act as priming sites during reverse transcription. Additionally, each non-coding region contains an identical long terminal repeat sequence (LTR) essential to the regulation o f viral gene expression. Aside from these common attributes, four features o f the retrovirus genome are unique to the Retroviridae:
- Two genomes per virus particle make retroviruses truly diploid.
- The RNA genome is transcribed entirely by host cell machinery, with no contribution from virally-encoded polymerases.
- Specific cellular tRNA molecules are required for priming o f reverse transcription.
- Retroviruses are unique amongst positive-sense single-stranded RNA viruses in that their genome does not act as mRNA immediately following infection o f a host cell. Rather, virally-encoded reverse transcriptases generate D N A intermediates. After integration into host chromosomal DNA, these act as templates for gene expression.
Retroviruses used to be divided into three subfamilies based on their virion morphology under electron microscopy, but phylogenetic data based on sequence analysis suggested that this classification was inappropriate. Re-organisation o f the family has led to the current taxonomic structure o f seven genera, as shown in TABLE 1-1. HIV-1, HIV-2, and the SIVs belong to the lentivirus genus, described in further detail below (Coffin, 1996b).
R U5 Leader Gag Pol Env U3 R
C ap- - poly-A
PBS PPT
FIGURE 1-1 : The general organisation o f retrovirus genomes. Protein coding regions are shaded orange. The yellow U5 and U3 sections contain sequences involved in the regulation o f transcription. The PBS (primer binding site), the polypurine tract (PPT) and the R (repeat) regions comprise short sequences involved in reverse transcription.
I ABLE 1-1: Retrovirus taxonomy.
GENUS SAMPLE MEMBERS
Mammalian Type B Mouse mammary tumour virus
Mammalian l ype C Murine leukaemia virus, feline leukaemia virus Avian Type C Avian leukosis virus, Rous sarcoma virus l ype D Mason-Pfizer monkey virus, jaagsiekte virus
BLV-HTLV HTLV-1, HTLV-11, bovine leukaemia virus
Spumaviruses Human spuma virus, bovine syncytial virus
Lentiviruses Human immunodeficiency virus type 1 (HlV-1), HlV-2
TABLE 1-2: Lentivirus taxonomy.
SEROGROUP SAMPLE MEMBER
Bovine Lentivirus Group Bovine immunodeficiency virus
Equine Lentivirus Group Equine infectious anaemia virus (LlAV) Feline Lentivirus Group Feline immunodeficiency virus
Ovine / Caprine Lentivirus Group Maedi-visna virus
1.1.1.
The Lentivirus Genus
Lentiviruses are exogenous, non-oncogenic retroviruses o f vertebrates, and notwithstanding its relatively recent discovery, HIV-1 is the type species. Together with HIV-2, and the SIVs, HIV-1 belongs to the Primate Lentivirus Group, one o f five subgroups o f lentiviruses (TABLE 1-2). These are alternatively called serogroups, although lentiviruses are usually classified based on their hosts rather than their antigenic properties. Primate lentiviruses can also be characterised by their use o f CD4 as a cell surface receptor and their lack o f a dUTPase coding region (Coffin, 1996b).
After characterisation o f early HIV-1 sequences derived from infected Europeans and North Americans, it was found that Central African isolates exhibited extensive diversity and could be grouped in several lineages each distinct from the European/American group. This suggests an African origin for HIV-1 from which the European/American group represented a later spread. HIV-1 has been divided into three major subgroups: O (found mainly in individuals linked to Cameroon), N, and M. FIGURE 1-2 demonstrates how subgroups M and N are more closely related to SlVcpz(Ptt), a virus o f West African chimpanzees {Pan troglodytes troglodytes), than to the HIV-1 subgroup O lineage. However, the degree o f sequence diversity within subgroup O is similar to that within subgroup M, implying they are o f comparable evolutionary age. The recently discovered subgroup N seems to contain recombinant viruses with components o f both HIV-1 subgroup M and SlVcpz(Ptt) sequences (Beer et al., 1999).
Subgroup M contains the majority o f currently identified HIV-1 isolates and is further subdivided into eleven clades; A through K. Nucleotide sequence variation between clades can be as high as 30%, whereas 5-15% is typical within a clade. Retrospective phylogenetic analysis has placed a sample taken in the then Belgian Congo in 1959 close to the node at which clades B and D diverge (Zhu et al., 1998). This suggests that some o f the clade diversity within HIV-1 subgroup M arose from a single human infected ‘founder’ individual and subsequent radiation rather than multiple zoonotic introductions (Yusim et
al., 2001). Moreover, ‘mosaic’ viruses have been observed whose Gag and Env sequences are derived from different clades. They are thought to have originated through in vivo recombination between viruses o f different clades.
It is widely accepted that HIV-2 is a zoonosis arising from a virus found in sooty mangabeys (Cercocebus atys). Strong evidence comes from the phylogenetic tree shown in FIGURE 1-2, where S IVsm and HIV-2 are clustered. HIV-2 has also been subdivided with five distinct clades (A to E) recognized. However, clades C, D and E have only been described in a small number o f individuals (Gao et al., 1994; McCutchan et al., 1996).
0.10
■HIV-1 MHIV-1 N
' SlVcpz(Ptt)
HIV-1 O “ SlVcpzrptsi
SIV mnd
•SIVagm
’S IVsyk
"SIVsm
-HIV-2
KEY
CPZ(Ptt) Chimpanzee {Pan troglodytes troglodytes - found in Gabon, Cameroon, Western Congo, etc.)
CPZ(Pts) Chimpanzee {Pan troglodytes schweinfurthii - found in East African forests) MND Mandrill {Mandrillus sphinx)
AGM African Green Monkey {Chlorocebus spp.) SYK Sykes’ Monkey {Cercopithecus mitts albogularis) SM Sooty Mangabey {Cercocebus atys)
FIGURE 1-2: Phylogenetic tree (drawn to scale) based on Pol gene sequences showing the evolutionary relationships within the Primate Lentivirus Group, adapted from Hahn et al.
(2000).
1.2. HIV-1 Infection
Human immunodeficiency virus type 1 (HIV-1) is almost universally acknowledged to be the aetiological agent o f acquired immunodeficiency syndrome (AIDS), a disease characterised by progressive destruction o f the immune system and depletion o f CD4-positive T lymphocytes (CD4^ cells) in the peripheral blood system. AIDS leads to eventual death from infections and neoplasias which are either rarely seen at all, or rarely fatal in immunocompetent individuals. How HIV-1 causes CD4^ cell numbers to decline is unclear, but is probably a combination o f a superantigen effect, apoptosis and direct viral cytopathic effects. Numerous attempts to prevent both the transmission and pathology o f HIV-1 have only partially succeeded, and at the time o f writing, no effective vaccine is available. However, chemotherapy can reduce virus replication and result in improved CD4^ cell counts, with newer therapies conferring longer-lasting effects.
Although the causative link between HIV-1 and AIDS has been disputed, the overwhelming circumstantial evidence reviewed in Luciw (1996) is briefly outlined here. Whilst these do not satisfy the adapted Koch’s postulates developed by Evans (1982) - in particular, thei^ lack o f a suitable animal model for the full exploration o f the natural history o f HIV-1 pathogenesis - the levels o f significance and the numbers involved in the epidemiological studies provide compelling corroboration o f the link between virus and disease.
- All AIDS sufferers have detectable replicating virus both in blood and lymph nodes, and have antibodies to HIV-1 antigens in their plasma.
- The frequency o f AIDS as a cause o f death amongst haemophiliacs receiving contaminated blood products cont^»tfnated is enormously greater amongst those who subsequently became HIV-1-infected than those who did not.
- In vitro studies have demonstrated HIV-1 to be cytopathic to the macrophages and CD4"^ T cells o f the immune system.
- Disease severity and progression to AIDS can be predicted by the correlates o f viral burden, CD4^ T cell decline, and absolute CD4^ T cell number.
- Successful reduction o f HIV-1 replication through drug therapy temporally precedes a reduction in disease severity and an improvement in prognostic markers. When viruses subsequently acquire resistance and baseline replication levels are resumed, this pattern is reversed.
- The demographic and geographical distributions o f HIV-1 prevalence and incidence are strikingly similar to those for AIDS prevalence and incidence.
1.2.1.
Transmission
HIV-1 is present in numerous body tissues and fluids, with genital secretions and blood being most important with regard to the routes o f transmission. Casual contact does not appear to pose a transmission risk (Friedland and Klein, 1987). Consequently, HIV-1 is primarily transmitted via three routes - sexually, parenterally, and perinatally, leading to definable population subgroups (Berkelman and Curran, 1989).
Although the Western world first encountered HIV-1 in the homosexual population, heterosexual transmission in the developing world accounts for the majority o f infections and this route is beginning to overtake homosexual transmission in the UK (Morison, 2001; CDSC, 2001). Transmission rates during sexual intercourse vary from approximately 0.01% to 0.8% depending upon the gender and role o f the infected and uninfected individuals during intercourse (Mastro and Kitayapom, 1998). Transmission risk is also influenced by three factors: viral burden in the infected host, integrity o f the genital mucosa, and host genetics (Buchacz et al., 1998; Fleming and Wasserheit, 1999; Vemazza et al., 1999).
The second mode o f transmission - parenteral - became associated with HIV-1 transmission early in the epidemic, with opportunistic infections indicative o f the new
immunodeficiency syndrome diagnosed in transfusion recipients and injecting drug users
(IDUs) (CDC, 1982; Des Jarlais et a l, 1989). Antibody screening o f blood donors li^V^all LouS but eliminated the former as a route o f infection in the developed world, but IDUs have
become the second largest source o f new infections in the USA (Des Jarlais et al., 1989). Together with the bisexual population, the IDU population represents a bridge between the otherwise isolated heterosexual and homosexual groups, further facilitating the spread o f HIV-1 (Rosenberg et al., 1992). Parenteral routes are the most efficient at establishing infection due to the large number o f susceptible target cells in the immediate post transmission environment, with rates from transfusion often approaching 95-100% (Coffin,
1996b).
Perinatal (or vertical) transmission o f HIV-1 from mother to infant can be ante-, intra-, or post-partum. Virus crossing the placental barrier in utero is thought to account for relatively few perinatal transmission events. Nearly half o f all perinatally acquired infections occur during delivery, through maternal blood either mixing with foetal blood, or contacting the mucosal surfaces o f infants. A similar proportion o f perinatal infections occur post-partum through breast-feeding. Colostrum often harbours high titres o f H IV -1, and nipple abrasions provide a route for blood-bome infection (Luzuriaga and Sullivan, 1997).
Rates o f vertical transmission vary widely, depending on geographical location, availability o f drug therapy, quality o f medical care, etc. In a European study, it has been estimated that between 14% and 40% o f infants borne to HIV-1-infected mothers will become before 18 months, with approximately 14% o f that rate being accounted for by post-partum transmission (Dunn et a l, 1992). However, administration o f antiretroviral therapy can reduce perinatal transmission rates by all routes by up to 70% (Bryson, 1996).
1.2.2.
Aetiology
The first steps o f infection remain unclear, and have tended to been inferred from experiments infecting rhesus macaques with S IVmac- Transmission events not directly
inoculating the bloodstream are thought to cross the mucosa through intra-epithelial dendritic cells, Langerhans cells and CD4^ T lymphocytes, either by transcytosis or by infection (Pope, 1999). Once in the lamina propria, HIV-1 is also believed to infect mobile dendritic cells and macrophages, with local viral propagation. Infected dendritic cells are believed to be responsible for transporting the virus to lymph nodes, from where HIV-1 becomes distributed throughout the host (Granelli-Pipemo et al., 1999).
For between two and four weeks post-transmission, unconstrained viral replication takes place and plasma viraemia levels rise dramatically (Daar et al., 1991). Up to half o f individuals recently infected may present with an influenza-like illness ( ‘sero-conversion illness’), whose symptoms can include fever, arthralgia, rash, myalgia, night sweats, lymphadenopathy and diarrhoea lasting for between one and ten weeks (Tindall et al.,
1988).
Following acute infection and the onset o f specific humoral and cell-mediated immune responses, viraemia levels drop by up to 99.9%, and anti-HIV antibodies become detectable in the blood (Goudsmit et al., 1986). The infection enters a long period o f clinical ‘latency’ during which the virus replicates without causing visible symptoms. This phase o f chronic infection is characterised by continuous viral replication, and a gradual but unremitting depletion o f CD4^ cells (Ho et al., 1995; Wei et al., 1995).
Exactly how HIV-1 causes the number o f CD4^ T cells to decline is yet to be fully understood. The inverse relationship between plasma viraemia and CD4^ counts during early infection implies that HIV-1 directly lyses CD4^ T cells. Both the formation o f multinucleated, giant cells (syncytia) and cell lysis occur in vitro, but the ratio o f uninfected to infected cells in the peripheral blood (~50 000:1) seems insufficient for this mechanism alone to drive progressive CD4^ T cell loss (Chun et al., 1997). Alternatively, a failure to generate new T cells due to HIV-1-mediated destruction o f the thymus and bone marrow may be primarily responsible for this CD4^ T cell depletion. Supporting evidence for this view comes from decreasing T cell receptor repertoires and reduced naïve CD4^ T cell
counts during infection, and comparable half-lives o f circulating CD4^ T cells between infected and uninfected individuals (Hellerstein and McCune, 1997).
The chronic phase lasts on average between 5 and 10 years, although a minority o f infected individuals called ‘rapid-progressors’ advance to AIDS within 3 years, and a similar minority o f ‘long-term non-progressors’ with strong specific anti-HIV immune responses can remain asymptomatic for over 10 years (Haynes et ah, 1996). It is unclear what influences the unpredictable duration o f the asymptomatic phase, although both viral load and CD4^ cell count immediately after the initial viraemia are predictive o f disease progression (Connor et al., 1993).
Eventually clinical symptoms associated with AIDS begin to appear. They are accompanied by a phenotypic change in the virus from slowly-replicating non-syncytium inducing (slow-low) to rapidly-replicating syncytium-inducing (fast-high) phenotype (Asjo et ah, 1986). A sharp decline in CD4^ T cell count (below 200/pl defines AIDS) is matched by an equally rapid rise in viral load. Deterioration in CD4^ cell count and elevation o f plasma viraemia are accelerated: greater immune system destruction leads to more opportunistic infections, which in turn activate T cells and stimulate virus production. Strains with increasing pathogenicity are selected for, such that each generational cycle causes more damage than the last (Connor and Ho, 1994). The three stages (acute, asymptomatic, AIDS) are currently categorised A, B, and C respectively. Examples o f the clinical symptoms associated with categories B and C are given below, in TABLE 1-3.
TABLE 1-3: Clinical conditions indicative o f Category B and Category C HIV-1 infections.
CATEGORY B
Ano-rectal carcinoma Fever or diarrhoea
lasting over a month HIV-related nephropathy Pelvic inflammatory disease
Persistent or frequent vulvo vaginal or oropharyngeal candidiasis
Bacillary angiomatosis Oral hairy leukoplakia
Herpes zoster Listeriosis Onychomycosis Peripheral neuropathy
CATEGORY C
Pneumocystis carinii pneumonia (PCP) Cytomegalovirus (CMV) retinitis Kaposi's sarcoma
Candidiasis - oesophageal, bronchial, tracheal, or in lungs
Penicilliosis marnefeii Coccidioidomycosis Mycobacterium spp.
HIV-related wasting syndrome Burkitt’s Lymphoma
Recurrent Salmonella septicaemia Toxoplasmosis o f the brain
Herpes simplex-related chronic ulcers, bronchitis, pneumonitis, or oesophagitis Progressive multifocal leukoencephalopathy Extrapulmonary cryptococcosis
1.3. The Life Cycle
The organisation o f the integrated HIV-1 genome shown in FIGURE 1-3 conforms to the basic retroviral pattern shown in the previous chapter (FIGURE 1-1), but with additional elements, some o f which are found in other lentiviruses. Aside from the Env gene and overlapping Gag and Pol domains, HIV-1 encodes four accessory proteins (Nef, Vif, Vpr, and Vpu) and two bi-cistronic regulatory proteins (Tat and Rev). These are outlined in TABLE 1-4.
Virions contain two positive-stranded RNA genomes o f approximately 9.2kb, comprising only the two short repeat regions (R regions) and the sequences between them. Consequently, the mechanism o f reverse transcription includes a facility for restoring the two intact LTR sequences (see section 1.3.4.2). The U3 region o f the 5 ’ LTR domain comprises the HIV-1 transcriptional promoter, and contains a variable array o f elements that bind cellular transcription factors including AP-1, S p l, and NF-NB. Immediately upstream o f the HIV-1 initiation site is a TAT A A box, able to bind the transcription factors that help form the polymerase complex (Luciw, 1996). Because the genomic RNA is transcribed by cellular mechanisms, it becomes poly-adenylated and capped as per mRNA. As a further feature, HIV-1 has two polypurine tracts as the canonical 3 ’PPT is repeated centrally within the integrase domain o f Pol.
Vpr
pu
|
l t r
|
Pol
Env
3 ’PPT
cPPT
Tat
RNA genome
FIGURE 1-3: Schematic o f the HIV-1 genome. The upper, shaded figure represents the organisation o f the integrated, double stranded DNA genome, below which is an arroM> showing the sequences encompassed by the smaller, single-stranded RNA genome found in virions. The colour coding is identical to that o f FIGURE 7-7 (page 20), with the additional components o f the regulatory proteins (green) and accessory proteins (blue).
z
H
o o
TABLE 1-4: Overview o f the HIV-1 proteins.
Gene Protein(s) Size (kD) Function
Matrix 17 Virion structure, phosphorylated subset involved in nuclear import o f viral nucleic acids
Capsid 24 Virion structure, possible role in virion uncoating, incorporating proteins into virions
Gag
p2g a g /p lg a g 2 & 1
Nucleocapsid 7 Virion structure, maintains genome architecture, widely used nucleic acid binding property
p6gag 6 Incorporating proteins into virions
Protease 2 x 10 Cleavage o f Gag and Gag-Pol precursor proteins
Pol Reverse
Transcriptase 51 & 6 6 Reverse Transcription
Integrase 31 Integration o f viral DNA into host chromosomes
gp l20 (SU) 1 2 0 Surface glycoprotein for CD4 receptor binding Env
gp41 (TM) 41 Transmembrane glycoprotein for envelope-cell membrane fusion
Tat Tat 14 Transcriptional activator
Rev Rev 19 Regulation o f viral mRNA splicing and nuclear
export, control o f gene expression
N e f N e f 27 Down-regulation o f CD4 and MHC class I
V if V if 23 Unclear
Vpr Vpr 14 Transcriptional activation, nuclear import o f viral
nucleic acids, interference with host cell machinery
Vpu Vpu 16 Down-regulation o f CD4 and MHC class I
The HIV-1 life cycle illustrated in FIGURE 1-4 is typical o f retroviruses. Beginning with the HIV-1 DNA genome integrated into host cell chromosomal DNA, viral proteins are expressed through host cell transcription and translation machinery, regulated in part by viral gene products. Together with two single-stranded positive-sense genomic RNA molecules, the major mature structural proteins derived from the HIV-1 Gag, Pol and Env genes become assembled at the cell membrane to form the virion framework. Either actively or by chance, other viral proteins and cellular molecules become incorporated into the virion structure. Mature virions subsequently ‘bud’ from the cell membrane.
Free virions are restricted in their target cell types by determinants in their surface glycoprotein molecules. Upon contact between the virion and a cell expressing the appropriate receptors, fusion between virion envelope and host cell membrane occurs. This is followed by penetration o f the virion contents into the cell. Within the cytoplasm, genomic RNA is converted into double-stranded DNA by the virally encoded enzyme reverse transcriptase. By hijacking cellular pathways, this DNA molecule and other virion components enter the nucleus. Here, virally encoded integrase enzyme integrates the DNA genome into host chromosomal material (Coffin, 1996b; Luciw, 1996; Turner and Summers, 1999).
Integration may be followed by a period o f latency during which the integrated genome is relatively inactive. The role o f latency remains unclear. However, it is thought that the vast majority o f in vivo viral production is from recently infected cells and not from reactivated latently infected cells (Wei et al., 1995).
O Reverse Transcriptase ^ HIV-1 RNA O Gag proteins ■ Rev
0 CD4 ★ Vpu ^ N ef A Env HIV-1 RNA