Volume 2, No. 4, July-August 2011
International Journal of Advanced Research in Computer Science
RESEARCH PAPER
Available Online at www.ijarcs.info
A Competency Analysis of Ant Colony Optimization and K-Harmonic means
Clustering Algorithm
M. Divyavani*
M.Phil Research Scholar
Department of Computer Application Bharathiar University
Coimbatore, India
T. Amudha
Assistant Professor
Department of Computer Application Bharathiar University
Coimbatore, India [email protected]
Abstract: Clustering is an important technique that has been studied in various fields with many applications such as image processing, marketing, data mining and information retrieval. Recently, the various algorithms inspired by nature are used for clustering. These swarm intelligence based clustering models and algorithms have advantages in many aspects. This paper focuses on the behavior of clustering procedures in a new approach called ant based clustering algorithm and K-harmonic means clustering algorithm. The two algorithms were evaluated in a number of well- known benchmark data sets. Empirical results clearly show that ant clustering algorithm (ACOC) performs well compared to another technique called K-Harmonic means clustering algorithm (KHM).
Keywords: biological algorithms, data mining and clustering techniques
I. INTRODUCTION
In bio- inspired artificial intelligence concepts like the swarm intelligence approach, where the behavior of social insects like ants or bees is copied, communication is carried out exclusively through the environment. The ants, bees, termites, and wasps are classified as social insects because they live in colonies. Every individual in a social insect colony seems to act independently of the others, but still the colony functions as an organized unit. These social colonies can be thought of as natural problem solving systems having collective intelligence [4].
The nature inspired methods like ant based clustering techniques have found success in solving clustering problems. They have received special attention from the research community over the recent years because these methods are particularly suitable to perform exploratory data analysis. Since there is a lot of investigation to perform on this field – the research nowadays concentrates on improving performance, stability, convergence, speed robustness and other key features that would allow applying these methods in real world applications. The main research on the nature inspired methods does not focus on the strict modeling of the natural processes; it merely focuses on using the best ideas to improve the convergence and accuracy of such methods [4]. The study of ant colonies has offered great insight in this aspect.
Data mining, as well as its synonyms knowledge discovery and information extraction is frequently referred in the literature as the process of extracting interesting information or patterns from large data bases. There are two major issues in data mining research and applications; patterns and interest. The techniques of pattern discovery include classification, association, outlier and clustering. Data mining may also be viewed as the process of turning the data into information, the information into action, and
the action into value or profit. That is, mining those actionable patterns that the user can act on them to his advantage [21].
The clustering techniques are used to discover natural groups in the data set and identify abstract structures that may reside in these groups. Data clustering is a useful process to extract meaning from sets of unlabeled data or to perform data exploration for pattern recognition [13].
[image:1.595.344.545.532.692.2]The goal of data clustering is to group objects that are similar to one another and separate those that are not. Unlike the classification task, the set of labels are not known in advance [11]. Fig- 2 shows a clustering procedure. The typical cluster analysis consists of four steps with a feedback pathway. These steps are closely related to each other and affect the derived clusters [15].
Figure 1. Clustering procedures [15]
Ant algorithms are a class of the algorithms based on artificial swarm intelligence, which is inspired by the collective behavior of social insects. Different ant algorithms have been developed and applied to a variety of problems. For instance, such approaches were successfully used in real life problems like job scheduling and network routing [20].
Figure 2. Real ant clusters the bodies of deal ants [12]
The ant clustering algorithms originated from the studies of ant clustering of dead bodies. They were introduced by Deneubourg et al., and improved by Handl et al., and are mainly applied to solve data clustering problems [20]. The above Fig-3 shows how to ants cluster the data.
According to O.A. Mohamed Jafer and R. Sivakumar (2010), the nature inspired methods like ant based clustering techniques and swarm intelligence have found success in solving clustering problems. [12]. The Urszula Boryczka (2008) , written as among the many bio-inspired techniques, ant clustering have received special attention, especially because they still require much investigation to improve performance, stability and other key features that would make such algorithms mature tools for data mining. [19].
Salima Ouadfel and Mohamed Batouche (2007), told that ants algorithm dynamically cluster pixels into distinctive independent groups within which similar pixels are closely placed in the same cluster which is gave better clustering quality compared to those obtained from KMeans algorithm [17]. Aranha and Claus de Castro (2006) stated that Ant-inspired techniques have shown greater promise to the clustering problem. In fact, ant-based clustering techniques are competitive with traditional ones [1].
According to Jeffrey W. Seifert (2004) Data mining is the use of sophisticated data analysis tools to discover previously unknown, valid patterns and relationships in large data sets. The data mining consists of more than collecting and managing data, it also includes analysis and prediction and it can be performed on data represented in quantitative, textual, or multimedia forms [17]. The Zengyou He, Xiaofei Xu and Shengchun Deng (2003) stated that Data mining may also be viewed as the process of turning the data into information, the information into action, and the action into value or profit. That is, mining those actionable patterns that the user can act on them to his advantage [21]. Then Amuel Sambasivam and Nick Theodosopoulos (2006)
opined that, Data mining involves the use of search engine algorithms looking for hidden predictive information, patterns and correlations within large databases. The technique of data clustering divides datasets into mutually exclusive groups [16].
Periklis Andritsos (2002) defined that Cluster analysis organizes data by abstracting underlying structure either as a grouping of individuals or as a hierarchy of groups. The representation can then be investigated to see if the data was grouped according to preconceived ideas or to suggest new experiments [12]. The Manying Qiu (2004) told that, Clustering is different from classification because clustering does not require predefined classes. The records are grouped based on self-similarity. It is up to the user to interpret the resulting clusters. Clustering is undirected knowledge discovery—no target variable is defined [9] and according to V. Estivill-Castro (2004), K-means clustering algorithm has been adopted as the prototype of iterative model based clustering because of its speed, simplicity and capability to work within the format of very large database [4].
B. Gillner (2007) stated that, the ant colony algorithm observed in the wild has been attributed with the remarkable habit of accumulating larvae and food in a distinctive order, reminiscent of clustering’s of sets of data [6]. Y. Kao · S.C. Fu (2005) stated, that the ant-based clustering in order to resolve machine cell formation problems. The three-phase algorithm mainly utilizes distributed agents which mimic the way real ants collect similar objects to form meaningful piles. [8]. Zahra Sadeghi, Mohammad Teshnehlab and Mir Mohsen Pedram (2007) defined K-ants clustering algorithm which used clustering with ants in which the number of clusters must be provided for it in advance. The clustering was done using a square grid. Each ant has a load list that must be filled with the members of one cluster. So every ant is supposed to search for one distinct cluster [21].
This paper is organized as follows: The section II presents the objective and methodology by which ant based clustering technique, k-harmonic means clustering technique and the bench mark instances taken for clustering were applied in this research work. The implementation results of ACOC algorithm and the KHM algorithm were presented analyzed and interpreted in section III The last section IV concluded the whole paper and pointed out the major strength of this work, contribution to the domain knowledge and direction for future research.
II. PROBLEM FORMULATION AND METHODOLOGY
The main objective of this research work is to implement two clustering algorithms, one bio-inspired clustering technique and one traditional clustering technique and to study their clustering competency.
A. ACOC Algorithm:
In the ACOC algorithm, an artificial ant colony simulates the pheromone trail following the behavior of real ants. Artificial ants move on a synthetic map representing a specific problem to construct solutions successively [20].
In the ACOC algorithm, the solution space is modeled as a graph of object-cluster node matrix. The number of rows equals m, and the number of columns equals g. Each node denoted by N (i, j) meant that data object I would be assigned to cluster j. Artificial ants can stay at only one of g
ants. Considering the clustering result of Fig- 4, the corresponding solution string is (2, 1, 2, 1, 3, and 3).
Figure 3. Construction graph for ACOC [20]
On the graph, each ant moves from one node to other, deposits pheromone on nodes, and constructs a solution in a stepwise way. At each step, an ant randomly selects an ungrouped object and adds a new node to its partial solution by considering both pheromone intensity and heuristic information. The memory list (tbk) can prevent a data object from being clustered more than once by an ant. When the memory list is full, it means that the ant has complete solution construction. The moving sequence of the example in Fig. 1 is marked by the numbers next to the dotted arcs.
B. KHM Algorithm:
K-harmonic means (KHM) is a more recent algorithm presented by Zhang in 2000. This algorithm minimizes the harmonic average from all points in N to all centers in K [3], which uses the Harmonic Averages of the distances from each data point to the centers as components to its performance function.
Given a set N of n data points in d dimensional space, it should be determined how to assign a set K of k points, called centers, in N so as to optimize based on some criterion. In most cases, it is natural to assume that N is much greater than K and d is relatively small. This formulation is an example of unsupervised learning. The system will create grouping based only on the criterion and the information contained in the n data point. In this algorithm to describe the class of KHM with parameter p
that is power associated with the distance calculation. In the standard KM algorithm p would be 2 because the distance calculation is given by squared distance ||xi – cj||
2
. It was found that KHM works better with values of p > 2. The harmonic average is defined as HA ({a1... aK}) = K / [SUM
over k = 1 to K (1 / ak)] (1).
This function has the property that if any one element in a1..aK is small, the Harmonic Average will also be small. If
there are no small values the harmonic average will be large. It behaves like a minimum function but also gives some weight to all the other values. The objective function of KHM is given by:
Minimize [SUM over i = 0 to N [HA (||xi – cj||2 for all cj in
K)]] (2).
Where HA () is the harmonic average for each data point. Unlike KM, this algorithm uses information from all of the centers in K to calculate the harmonic average for each point in N. This means that no center completely owns a point, but rather partially influences the harmonic average for each point.
III. IMPLEMENTATION RESULTS AND DISCUSSION
The experimental results and comparative study of the two algorithms are presented in this section. The performance of the two algorithms was evaluated by testing on two datasets, NURSERY and SOLAR dataset. These datasets were selected from the website of UCI repository of machine learning databases.
These algorithms have been coded in java platform, java extended support a good for clustering the data objects while executing the program. It is worth to use java for clustering techniques. The SQL Server 2000 was used in this research work to construct the two database namely NURSERY database and SOLAR database. These databases contain the different types of instance values, and attribute of the two categorical datasets. The clustering results of the two algorithms on the test sets are compared using two evaluation measures called Entropy and F-Measure.
A. Entropy:
Entropy is used to measure the quality of the clusters. Let CS be a clustering solution. For each cluster, the class distribution of the data is calculated first, i.e., for cluster j is computed. The “probability” pij, that denotes whether a
member of cluster j belongs to class i is computed. Then using this class distribution, the entropy of each cluster j is calculated using the standard formula
Ej =−∑ρij log(ρij) (3)
i
where the sum is taken over all classes. The total entropy for a set of clusters is calculated as the sum of the entropies of each cluster weighted by the size of each cluster:
m
ΕCS =∑ nJ ∗Εj (4)
J=1 n
where nj is the size of cluster j, m is the number of
clusters, and n is the total number of data points [2].
B. F measure:
The second external quality measure is the F measure, a measure that combines the precision and recall ideas from information retrieval. Each cluster can be treated as if it were the result of a query and each class as if it were the desired set of data items for a query. Next, recall and precision of that cluster is calculated for each given class. More specifically, for cluster j and class i
Recall (i, j) = nij / ni (5)
Precision (i, j) = nij / nj (6)
Where nij is the numbers of members of class i in cluster
j, nj is the number of members of cluster j and ni is the
number of members of class i. The F measure of cluster j and class i is then given by
F(i, j) = (2 * Recall( i, j ) * Precision( i, j )) / ((Precision( i, j ) + Recall( i, j )) (7)
For an entire hierarchical clustering the F measure of any class is the maximum value it attains at any node in the tree and an overall value for the F measure are computed by taking the weighted average of all values for the F measure as given by the following.
F=∑ ni max{F(I,j)} (8)
where the maximum is taken over all clusters at all levels, and n is the number of data items [2].
[image:4.595.322.556.55.198.2]For the two algorithms, the experimental results were shown in the following tables. The study compared the performance of the KHM and ACOC. For each test problem, these two algorithms were performed 12 times (distinct runs) individually. The parameter values used in KHM and ACOC were: nof / R =2 or 3 or 4 or 5 (declared number of clusters), iter = 25, minimum iteration = 5, maximum = 25. The 12 distinct runs were grouped in Table I
Table I. 12 Distinct Runs
Cluster Groups Number of Clusters Iteration Name
A 2 5
15
25
B 3 5
15 25
C 4 5
15 25
D 5 5
15 25
The test sets were tested by four cluster groups namely A, B, C, D. The first group A had two clusters with three different iterations 5, 15, 25. The second group B had three clusters with three iterations 5, 15, 25. The third group C had four clusters with three iterations 5, 15, and 25. Finally, D group had five clusters with three iterations 5, 15, 25 was evaluated. The four clusters were tested with a maximum of 25 iterations by implementing ACOC algorithm and KHM algorithm.
The clustering efficiency of the both ACOC and KHM algorithm was evaluated by testing on two datasets. For the real life datasets, instances were selected from the UCI repository of machine learning databases namely NURSERY and SOLAR dataset. The first dataset is composed of Multivariate and it has 12960 instance values, while the second also Multivariate dataset which has 1066 instances.
A. Nursery Dataset:
Table II shows the standard deviation of the performance measures in ACOC and KHM for NURSERY data set along with graph is presented Figure 4.
Table II. Standard deviation of performance measures
Quality measures
Objective function values
Objective function values
ACOC KHM
Average Stdev Average Stdev Entropy 0.130 0.052 0.646 0.551 F-Measure 0.511 0.406 0.537 0.384
0 0.1 0.2 0.3 0.4 0.5 0.6
Entropy Precision Recall F-Measure
[image:4.595.43.274.188.337.2]ACOC KHM
Figure 4. Comparsion graph of Standard deviation in ACOC and KHM
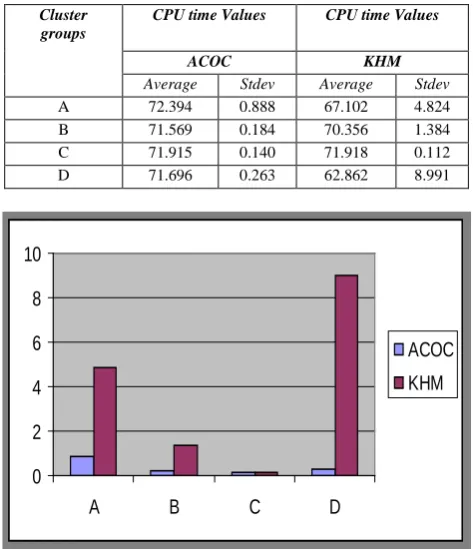
[image:4.595.319.556.341.616.2]It is clearly understandable from Table II that the ACOC gave comparable solutions. It was found that ACOC has a consistent performance over all the iterations with respect to the quality measures. The ACOC illustrated the best standard deviations for entropy with the value of 0.052 whereas the best standard deviation for F-measure was 0.384 as given by KHM. Table III shows the standard deviation for corresponding computation time with graph.
Table III. Standard deviation for computation time
Cluster groups
CPU time Values CPU time Values
ACOC KHM
Average Stdev Average Stdev
A 72.394 0.888 67.102 4.824 B 71.569 0.184 70.356 1.384 C 71.915 0.140 71.918 0.112 D 71.696 0.263 62.862 8.991
0 2 4 6 8 10
A B C D
ACOC
KHM
Figure 5. Comparsion graph of standard deviation for computation time
B. Solar Dataset:
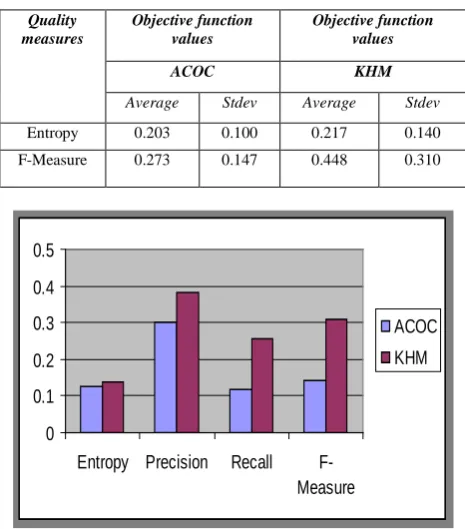
[image:5.595.41.274.131.396.2]Table IV shows the standard deviation of the performance measures in ACOC and KHM for NURSERY data set along with graph is presented Figure 6.
Table IV. Standard deviation of performance measures
Quality measures
Objective function values
Objective function values
ACOC KHM
Average Stdev Average Stdev
Entropy 0.203 0.100 0.217 0.140 F-Measure 0.273 0.147 0.448 0.310
0 0.1 0.2 0.3 0.4 0.5
Entropy Precision Recall
F-Measure
ACOC
KHM
Figure 6. Comparsion graph of Standard deviation in ACOC and KHM
It is clearly understandable from Table IV that the ACOC gave comparable solutions. It was found that ACOC has a consistent performance over all the iterations with respect to the quality measures. The ACOC illustrated the best standard deviations for entropy with the value of 0.100 and also given the best standard deviation for F-measure 0.147 with compared to KHM. Table V shows the standard deviation for corresponding computation time with graph.
Table V. Standard deviation for computation time
Cluster groups
CPU time Values CPU time Values
ACOC KHM
Average Stdev Average Stdev A 46.125 0.076 66.617 15.027
B 50.312 0.025 81.344 0.104 C 81.258 0.122 46.652 0.241
D 81.748 0.017 68.938 13.787
0 2 4 6 8 10 12 14 16
A B C D
ACOC KHM
Figure 7. Comparsion graph of standard deviation for computation time
It is clearly understandable from Table V that the ACOC algorithm has performed consistently at all level of iterations. The ACOC located the best time as 46.049 to form two clusters in five iterations. The KHM found the best time as 46.411to form four clusters in twenty five iterations.The execution time for ACOC is relatively higher than KHM. Even though ACOC has taken larger processing time, its standard deviation was found to be much better than KHM. In ACOC, the highest standard deviation of computation time was found as 0.122 whereas is KHM, it was 15.027.
IV. CONCLUSION AND FUTURE DIRECTIONS
In NURSERY dataset, the ACOC has a consistent performance over all the iterations with respect to the quality measures and it also illustrated the best standard deviations for entropy. KHM has shown the best standard deviations for F-Measure in this dataset. The execution time for ACOC is relatively higher than KHM. Even though ACOC has taken larger processing time, its standard deviation for processing time was found to be much better than KHM. In SOLAR dataset, the ACOC has outperformed KHM over all the iterations with respect to the quality measures as well as the best standard deviations for entropy and F-Measure. The execution time for ACOC is relatively higher than KHM but its standard deviation for execution time was found to be much better than KHM. The ACOC has larger processing time compared to KHM and this problem need to be solved in the future. The standard deviation of KHM is larger than the ACOC. This issue is to be addressed and improved in future.
V. REFERENCES
[1] Aranha and Claus de Castro, “A Survey on using Ant-Based
techniques for Clustering”, 2006.
[2] Banumathy D., and Nithyakalyani S., “An Improved K-Mean
Clustering Hybrid with Ant-Colony Optimization”, KSR
College of Engineering, Tamil Nadu, 1st National conference
on Intelligent Electrical Systems (NCIES’09) 24-25 April 2009.
[3] Douglas Turnbull, “K-Means & K-Harmonic Means: A
[4] Elisa Valentina Onet and Ecaterina Vladu, “Nature Inspired Algorithms and Artificial Intelligence”, Journal of Computer Science, 2005.
[5] Estivill-Castro V., and Yang J., “Fast and Robust General
Purpose Clustering Algorithms”, Griffith University, Nathan, QLD 4111, Australia. University of Western Sydney, Campbelltown NSW 2560, Australia, Data Mining and Knowledge Discovery, 8,127-150, 2004, Kluwer Academic Publishers. Manufactured in the Netherlands.
[6] Gillner B., “A Comparative Study Of Ant Clustering
Algorithms”, October 22, 2007.
[7] Jeffrey W. Seifert, “Data Mining: An Overview”,Analyst in
Information Science and Technology Policy, Resources, Science, and Industry Division, CRS Report for Congress, 2004.
[8] Kao Y., Fu S.C., “An Ant-Based Clustering Algorithm for Manufacturing Cell Design’s,Published online: 21 December 2005 © Springer-Verlag London Limited 2005.
[9] Manying Qiu, Steve Davis and Fidelis Ikem, “Evaluation of
Clustering Techniques in Data Mining Tools”, Virginia State University, Clemson University, Volume V, No 1, 2004.
[10]Manying Qiu, Steve Davis and Fidelis Ikem, “Evaluation of
Clustering Techniques in Data Mining Tools”, Virginia State University, Clemson University, Volume V, No 1, 2004.
[11]Marcio Frayze David and Leandro Nunes de Castro, “A New
Clustering Boids Algorithm for Data Mining”, Mackenzie University, Brazil 2008.
[12]Mohamed Jafer O.A., and Sivakumar R., “Ant-Based
Clustering Algorithms: A Brief Survey”, International Journal
of Computer Theory and Engineering, Vol 2, No.5, October, 2010, 1793-8201.
[13]Periklis Andritsos, “Data Clustering Techniques”, University
of Toronto, Department of Computer Science, 2002.
[14]Pro Dromidis A.L., Chan P.K., and Stolfo S.J.,
“Meta-Learning in Distributed Data Mining Systems: Issues and Approaches”, Advances in Distributed and Parallel Knowledge Discovery, AAAI/MITPress 2000.
[15]Rui Xu, “Survey of Clustering Algorithms”, IEEE and Donald
Wunch II, Fellow, IEEE, IEEE Transactions on Neural Networks, vol. 16, No. 3, May 2005.
[16]Salima Ouadfel and Mohamed Batouche, “An Efficient Ant
Algorithm for Swarm-Based Image Clustering”, University of Batna, Algeria, Computer Vision Group, LIRE Laboratory, University of Constantine, Algeria (2007), Journal of Computer Science 3 (3): 162-167, 2007 ISSN 1549-3636 © 2007 Science Publications.
[17]Samuel Sambasivam and Nick Theodosopoulos, “Advanced
Data Clustering Methods of mining Web Documents”, Azusa Pacific University, Azusa, CA, USA, and London, UK, Issues in Informing Science and Information Technology volume 3, 2006.
[18]Sudipto Guha, Rajeev Rastogi and Kyuseok Shim, “ROCK: A
Robust Clustering Algorithm for Categorical Attributes”, Standford University Standford, Bell Laboratories, Murray, 1997.
[19]Urszula Boryczka, “Ant Clustering Algorithm”, Institute of
Computer Science, University of Silesia, Sosnowiec, Poland, Intelligent Information Systems 2008, ISBN 978-83-60434-44-4, pages 377-386.
[20]Yucheng Kao and Kevin Cheng, “An ACO-Based Clustering
Algorithm”, Tatung University, Taipei, Taiwan (2006).
[21]Zahra Sadeghi and Mohammad Teshnehlab, Mir Mohsen
Pedram, “K-Ants Clustering- A New Strategy Based on Ant Clustering”, Islamic Azad University 2007.
[22]Zengyou He, Xiaofei Xu and Shengchun Deng, “Data Mining
![Figure 1. Clustering procedures [15]](https://thumb-us.123doks.com/thumbv2/123dok_us/706642.1078788/1.595.344.545.532.692/figure-clustering-procedures.webp)
![Figure 2. Real ant clusters the bodies of deal ants [12]](https://thumb-us.123doks.com/thumbv2/123dok_us/706642.1078788/2.595.55.263.137.272/figure-real-ant-clusters-bodies-deal-ants.webp)
![Figure 3. Construction graph for ACOC [20]](https://thumb-us.123doks.com/thumbv2/123dok_us/706642.1078788/3.595.69.245.87.210/figure-construction-graph-acoc.webp)