Copyright © 2001, American Society for Microbiology. All Rights Reserved.
Typing and Subtyping Influenza Virus Using DNA Microarrays
and Multiplex Reverse Transcriptase PCR
JIPING LI,1,2SHU CHEN,2ANDDAVID H. EVANS1*
Department of Molecular Biology and Genetics1and Laboratory Services Division,2
The University of Guelph, Guelph, Ontario N1G 2W1, Canada
Received 21 September 2000/Accepted 15 November 2000
A model DNA microarray has been prepared and shown to facilitate typing and subtyping of human
influenza A and B viruses. Reverse transcriptase PCR was used to prepare cDNAs encoding⬃500-bp influenza
virus gene fragments, which were then cloned, sequenced, reamplified, and spotted to form a glass-bound microarray. These target DNAs included multiple fragments of the hemagglutinin, neuraminidase, and matrix protein genes. Cy3- or Cy5-labeled fluorescent probes were then hybridized to these target DNAs, and the arrays were scanned to determine the probe binding site(s). The hybridization pattern agreed perfectly with the known grid location of each target, and the signal-to-background ratio varied from 5 to 30. No cross-hybridization could be detected beyond that expected from the limited degree of sequence overlap between different probes and targets. At least 100 to 150 bp of homology was required for hybridization under the conditions used in this study. Combinations of Cy3- and Cy5-labeled DNAs can also be hybridized to the same chip, permitting further differentiation of amplified molecules in complex mixtures. In a more realistic test of the technology, several sets of multiplex PCR primers that collectively target influenza A and B virus strains were identified and were used to type and subtype several previously unsequenced influenza virus isolates. The results show that DNA microarray technology provides a useful supplement to PCR-based diagnostic methods.
After the first reports describing DNA microchip arrays ap-peared (15, 16), microarray technology revolutionized the study of gene expression patterns in diverse organisms (re-viewed in references 3 and 7). Arrays composed of oligonucle-otides (15) or robotically spotted DNAs (16) permit genome scale analysis of gene expression patterns and have more re-cently been used in such applications as drug discovery (6), mutation detection (8, 9, 12), evolutionary studies (11, 21), and genome mapping (20). The application of DNA microarray technology as a diagnostic tool also shows great promise, since microarrays theoretically permit a simultaneous screen for any of tens of thousands of nucleic acid sequences. However, only recently have reports of these array-based applications started to appear. Oligonucleotide arrays have been used to search for mutations in cancer-linked genes (reviewed in reference 10) and human immunodeficiency virus mutations (13, 25) and in bacterial typing (1), but the high cost and limited availability of such tools continue to limit research in this area.
We have been interested in the development of new tech-nologies capable of better identifying viral pathogens and have been using, as a model system, human influenza viruses (28, 29). Influenza viruses cause annually recurrent epidemics of moderate-to-severe respiratory disease, frequently associated with genetic variation termed drift and shift (5, 27). These viruses present an important diagnostic problem, and the rapid detection, typing, and subtyping of influenza A and B virus strains are of both clinical and epidemiological value. While antibody-based methods still form the foundations of routine diagnostic work, many reports over the last decade have
dem-onstrated the utility and superiority of PCR-based diagnostic (2, 4, 14, 19, 22, 26) and retrospective (23) tests. Unfortunately PCR-based methods suffer from a problem in that simply pro-ducing DNA isn’t sufficient evidence that one has amplified the right product. Other methods such as DNA sequencing (29), blotting (18), and fluorogenic PCR (19) are required if one desires proof that a PCR has amplified a bona fide nucleic acid target. While such confirmatory methods are certainly reliable, they still present something of a financial, technical, and logis-tical challenge to busy laboratories routinely screening for hun-dreds of different agents. They also become more difficult to apply when multiplex methods are being used to simulta-neously amplify two or more PCR products from a mixture of templates.
DNA arrays offer a potential solution to these problems. The arrays can potentially encode tens of thousands of possible target sequences and thus provide a simple way of storing and indexing numerous hybridization probes. In principle one could draw this resource when needed to confirm the identity of one or more PCR products by hybridization, with only minimal modification to existing PCR-based protocols. We have tested this approach and show here that a model DNA array can be used to type and subtype influenza A and B virus strains. This shows that DNA arrays can provide multiply re-dundant confirmatory evidence that a PCR product encodes the sequence(s) it is expected to encode.
MATERIALS AND METHODS
Viruses. Human influenza virus strains (Table 1) were obtained from the American Type Culture Collection (Manassas, Va.) and propagated where nec-essary in 10-day-old embryonated chicken eggs (29). Crude viral RNA was extracted as described previously (29) and stored at⫺70°C.
Oligonucleotide primer design.Oligonucleotide primers were designed using RightPrimer, version 1.2, software and GenBank Blastn sequence alignments. Selected PCR primers meet the following criteria: (i) primers hybridize to highly
* Corresponding author. Mailing address: Department of Molecular Biology and Genetics, University of Guelph, Guelph, Ontario N1G 2W1, Canada. Phone: (519) 824-4120, ext. 2575. Fax: (519) 837-2075. E-mail: [email protected].
696
on May 15, 2020 by guest
http://jcm.asm.org/
conserved sequence elements, (ii) each amplicon spans approximately 500 bp, (iii) amplified segments collectively encompass an entire gene (thus 1.5 kb of virus DNA sequence required three primer pairs), and (iv) primer melting points generally fell between 50 and 54°C. Desalted primers were purchased from Gibco/BRL and used without further purification.
RT-PCR and cDNA cloning. A commercial kit was used to prepare viral cDNAs. Reaction mixtures contained 10 pg of RNA, 200M (each) de-oxynucleoside triphosphate, 1.5 mM MgCl2, 0.4M (each) primer, and other
components as directed by the manufacturer (Titan one-tube reverse transcrip-tase PCR [RT-PCR] kit [Roche]). Reaction mixtures were incubated at 50°C for 30 min, denatured at 94°C for 3 min, and then subjected to 35 thermal cycles (94°C for 30 s, 45°C for 30 s, 68°C for 2 min). Following a final 10-min incubation at 68°C, the samples were chilled and the products were sized by electrophoresis. PCR-amplified viral cDNAs were subsequently cloned using a Topo TA cloning kit (Invitrogen). Recombinant plasmids were purified fromlacZmutant bacteria and sequenced as described previously (24).
Preparation of target DNAs.M13 forward (5⬘GTAAAACGACGGCCAGTG 3⬘) and reverse (5⬘CAGGAAACAGCTATGACC 3⬘) primers were used to reamplify cloned viral cDNAs. The reverse primer incorporated an amine tag linked by a six-carbon spacer to the 5⬘end (Gibco/BRL). PCR mixtures (100l) contained 2 mM MgCl2, 200M (each) deoxynucleoside triphosphate, 0.4M
(each) primer,⬃1 ng of purified plasmid DNA, 1/10-diluted enzyme buffer, and 1.5 U ofTaqpolymerase (Perkin-Elmer). Following 35 thermal cycles (typically 94°C for 30 s, 52°C for 30 s, 72°C for 1 min) the DNA was purified using MicroSpin S-400 columns (Amersham/Pharmacia Biotech), precipitated with ethanol, resuspended in 30l of 3⫻SSC (10⫻SSC is 87.6 g of NaCl/liter and 44.1 of sodium citrate/liter, pH 7.0), and the DNA concentration was adjusted to
⬃300 ng/l for spotting purposes.
Microarray printing and processing.Amine-tagged target DNAs were distrib-uted, in duplicate, into 384-well microtiter plates. A custom-built arrayer (Virtek) was used to spot DNA on aldehyde-activated silylated microscope slides (CEL Associates). Printed arrays were air dried for a few minutes at 50 to 60°C and then stored overnight at 20 to 37°C over desiccant. The arrays were rehy-drated for 4 h in a humid atmosphere, dried briefly at 50°C on a heating block, washed once in 0.2% sodium dodecyl sulfate (SDS) and twice in water (1 min each), and treated with sodium borohydride (1.0 g of NaBH4[Sigma] dissolved
in 300 ml of phosphate-buffered saline plus 100 ml of ethanol [17]) for 5 min. The DNA was denatured in water (2 min at 95°C) and then washed again (once in 0.2% SDS and once in water [1 min each]). Arrays were air dried and stored at room temperature.
Probe preparation and multiplex PCR.Two methods for incorporating fluoro-linked Cy3- and/or Cy5-dCTP (Amersham/Pharmacia Biotech) into fluorescent probes were devised. The simplest method involved adding 20M Cy3- or Cy5-dCTP to a standard 100-l PCR mixture containingTaqpolymerase; 200M (each) dATP, dGTP, and TTP plus 100M dCTP; and a single primer pair (see above). In subsequent experiments, probes were prepared using multiplex RT-PCR mixtures also supplemented with 20M Cy3- or Cy5-dCTP. In this case the primers were combined into three different groups, but in such a way that the combination of primers ensured that one influenza virus subtype could be am-plified no matter which viral RNA or cloned cDNA was present. Labeled probes were purified using MicroSpin S-300 columns and heat denatured before hybrid-ization. Fluorescent molecules were handled under dim lighting to minimize photobleaching.
Hybridization and data analysis.Microarrays were prehybridized in 20l of DIG Easy Hyb (Roche) containing 5g of denatured salmon sperm DNA at
62°C for 1 h under a 12- by 12-mm coverslip. The coverslip was washed off the slide in 0.1⫻SSC, and the slides were dried at room temperature. A fresh solution of DIG Easy Hyb, containing⬃5l of denatured fluorescent probe plus 5g of salmon sperm DNA in a total volume of 20l, was then applied to the array and overlaid with a 12- by 12-mm coverslip. The arrays were incubated overnight at 58 to 62°C in a humid chamber and then washed for 5 min at 20°C in 1⫻SSC–0.1% SDS followed by 0.1⫻SSC–0.1% SDS. The arrays were rinsed in 0.1⫻SSC, dried, and stored in the dark. Arrays were analyzed using GenePix (Axon Instruments) or ChipReader (Virtek) confocal scanners, and the fluores-cence was quantitated using ImaGene software (Biodiscovery). Gain settings produced a linear detector response. A “glass” background fluorescence reading was measured in the region surrounding each spot and subtracted, and the intensity was normalized to produce an average fluorescence reading at all nonhomologous spot positions equal to 50 U. The signal-to-background ratios reported here are the fluorescence intensities measured at homologous spots divided by an average measured at all other array locations.
Nucleotide sequence accession numbers. Viral sequences obtained in this study have been assigned GenBank accession no. AF305216 to AF305220.
RESULTS
Viral genetic targets.Three types of human influenza viruses
[image:2.612.52.551.83.182.2]are commonly encountered (A, B, and C), of which the A and B types are of primary clinical interest. Type A strains are further subtyped as encoding one of three different hemagglu-tinins (HAs; H1, H2, or H3) and one of two different neura-minidases (N1 or N2). The HA and neuraminidase (NA) genes are principal pathogenic determinants that reside on separate subgenomic segments, and it is genetic reassortment of these segments which creates the six primary human influenza A virus subtypes which change over decades. Human type B
TABLE 1. Human influenza viruses used in this study
Virus Subtype GenBank accession no. of virus gene: DNA
a
HA NA MP Arrayed Hybridized
A/New Jersey/8/76 H1N1 n/ab M27970 n/a HA1, NA1
A/Denver/1/57 H1N1 AF305218c AF305216c AF305217c HA1, NA1, MP
A/Japan/305/57 H2N2 L20406 n/a n/a HA2, NA2-3
A/Victoria/3/75 H3N2 V01098 J02173 n/a HA3 HA3, NA2, MP
A/Port Chalmers/1/73 H3N2 AF092062 n/a X08092 NA2-1, NA2-2, MP
B/Maryland/1/59 K00424 M30633 n/a HA, NA, MP
B/Hong Kong/5/72 AF305219c AF305220c n/a HA, NA, MP
aUnless otherwise indicated, all DNA subfragments derived from the indicated virus. The one exception was NA2 gene fragments which derived from two different
viruses.
bn/a, not available by April 2000.
cNot available by April 2000. A partial sequence was determined in this study.
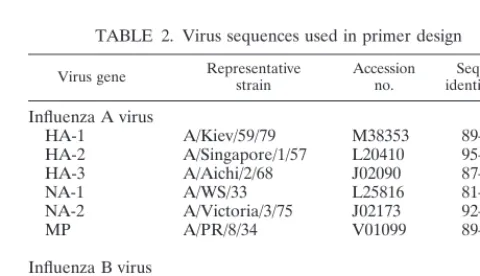
TABLE 2. Virus sequences used in primer design
Virus gene Representativestrain Accessionno. identity (%)Sequencea Influenza A virus
HA-1 A/Kiev/59/79 M38353 89–98
HA-2 A/Singapore/1/57 L20410 95–99
HA-3 A/Aichi/2/68 J02090 87–99
NA-1 A/WS/33 L25816 81–99
NA-2 A/Victoria/3/75 J02173 92–99
MP A/PR/8/34 V01099 89–100
Influenza B virus
HA B/Singapore/222/79 X00897 95–99
NA B/Hong Kong/8/73 M30631 93–98
MP B/Lee/40 J02094 91–94
aDegree of nucleotide sequence variation compared with other influenza gene
homologs in the NCBI database.
on May 15, 2020 by guest
http://jcm.asm.org/
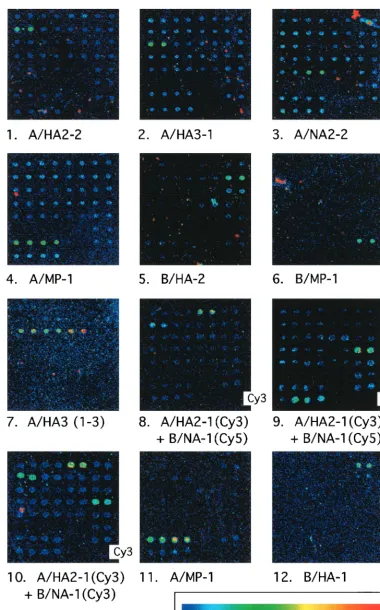
[image:2.612.311.551.571.709.2]FIG. 1. Identification of influenza cDNAs using glass-supported microarrays. DNA targets were spotted in duplicate in an eight-by-eight grid, and bound probes were detected using confocal fluorescence microscopy. The hybridization probe or probes used in each experiment are indicated below each image, and the array pattern is shown in Table 4. The images seen in panels 1 to 6 were obtained using short probes spanning mostly a single target (see text for a further discussion of this point), while panel 7 shows an array hybridized to a longer cDNA fragment spanning three contiguous targets (A/HA3-1, A/HA3-2, and A/HA3-3). The single array shown in panels 8 and 9 was hybridized to a mixture of Cy3-labeled
on May 15, 2020 by guest
http://jcm.asm.org/
influenza virus strains also encode HA and NA genes, but only a single major genetic variant of each is commonly encoun-tered. Thus the typing and subtyping of influenza A and B virus strains require an ability to detect at least four HA and three NA genes plus their drifted allelic variants. Other viral genes are also useful in differentiating influenza A and B virus strains and offer the advantage of being more genetically stable. In this regard we have previously used the influenza matrix pro-tein (MP) gene as a PCR target. Methods capable of differen-tiating a total of four HA, three NA, and two MP gene targets thus provide the capacity to type and subtype human influenza A and B virus strains with some degree of redundancy.
Preparation of cloned virus cDNAs.We initially cloned
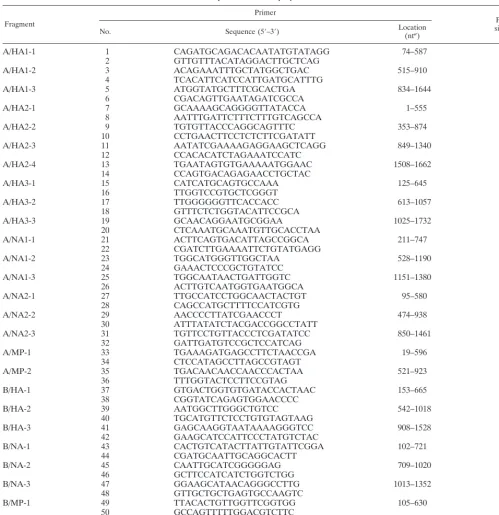
mul-tiple separate fragments of genes for three influenza A virus HAs (A/HA1, A/HA2, and A/HA3), two influenza A virus NAs (A/NA1 and A/NA2), and an influenza A virus MP (A/MP) as well as an influenza B virus HA (B/HA), NA (B/NA), and MP (B/MP). The nine genes each spanned 1 to 1.5 kb and have little or no sequence homology. Primers were selected using a combination of primer design software and Blastn sequence alignments with the intent of locating each primer pair in maximally conserved sequence regions spaced about 500 bases apart. Table 2 lists the nine DNA sequences used to initiate homology searches and to design primers, and Table 3 shows the 52 primers generated by this approach. Based on available sequence data, the variation in nucleotide sequence within each influenza gene family ranges from 81 to 100% sequence identity (Table 2). These 26 primer pairs were used in RT-PCRs to amplify genes encoded by five different influenza virus strains (Table 1). We obtained 24 of 26 possible cDNA prod-ucts (the A/HA1-2 and B/MP-2 primer sets did not work), cloned these cDNAs, and verified the DNA sequences.
Array fabrication.The 24 sequence-validated cDNA clones
were reamplified using M13 universal primers, in the process adding a 5⬘amino tag to the reverse primer to permit covalent attachment to a modified glass support. A custom-built Stan-ford-type DNA arrayer was used to spot DNA, in duplicate, onto activated silylated glass slides at densities of 1,100 or 2,500 spots/cm2 (300- or 200-m spacing, respectively). The
array pattern is shown in Table 4. In addition to virus cDNAs we added control spots composed ofEscherichia coliDNA and 3⫻SSC buffer. Several replicate sets of the eight-by-eight grid were also printed elsewhere on the slide to facilitate statistical analysis of hybridization signals.
Hybridization of arrays with cloned cDNAs.To determine
whether these arrayed cDNA targets retained their expected hybridization properties, we first tested whether fluorescent probes derived from the original cloned cDNA templates would hybridize to a cognate spot(s). Standard PCR mixtures were supplemented with Cy3-dCTP and used to reamplify each of the cloned cDNAs. These fluorescent probes were purified and individually hybridized to separate arrays, and then the hybridization signals were analyzed using Virtek or Axon chip readers. A selection of the resulting fluorescence images are
shown in Fig. 1 (panels 1 to 6). These can be decoded by noting, for example, that a 520-bp A/HA3-1 probe (Table 3) produced strong hybridization signals at duplicate spots lo-cated in row 3, columns 1 and 2 (Fig. 1, panel 2). Overall, duplicate hybridization signals were clearly detected at all of the positions known to encode homologous DNA targets and little cross-hybridization to unrelated spots or background flu-orescence was detected with these supports.
The digital images generated by fluorescence scanners can be very misleading if judged just by eye, because the appear-ance varies greatly in response to changes in instrument set-tings, background subtraction, and postacquisition gain factors. Therefore we also measured the hybridization signal intensities and compared the difference in fluorescence intensity between spots encoding homologous versus nonhomologous targets. (This ratio of fluorescence values served as a way of normal-izing data across many different arrays, with the cross-hybrid-ization background always assigned an arbitrary value of 50 fluorescence units.) Initial experiments detected approximately threefold variations in signal intensity, which seemed to corre-late with changes in spot size (data not shown). Furthermore, arrays prepared early in the production cycle produced the most-intense signals, while later batches of slides, encoding smaller spots, produced weaker fluorescence signals. This ef-fect was caused by the arraying pins blunting with use, causing the spots to decrease in radius from ⬃75 to ⬃45m. This should reduce the quantity of bound DNA approximately threefold (75⁄452), which agreed well with the observed variation
in fluorescence intensities. Figure 2 shows a representative selection of results subsequently obtained from 10 separate hybridization experiments using arrays bearing primarily 45-m (radius) spots. The signal intensity still varied in these experiments from target to target, ranging from 180 to 1,090 arbitrary fluorescence units, but the fluorescence intensities measured at sites encoding homologous target sequences were always significantly greater (at least threefold) than the signals detected elsewhere on the array at nonhomologous targets. Several additional factors probably contribute to the residual variation, including variations in the concentrations and spe-cific activities of fluorescent probes. However, a significant confounding factor appeared to be the size of the target DNA.
Effect of target length on signal intensity.The primers used
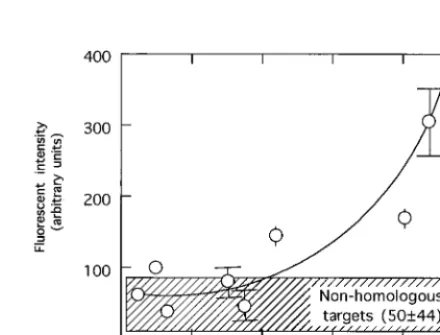
in this study were designed to create some overlap between the two or three target cDNAs derived from any given influenza virus gene. This made it possible to estimate what minimal target sequence length might be required to produce a hybrid-ization signal. For example, targets A/HA2-1 and A/HA2-2 have 202 bp of common sequence and, by hybridizing a probe derived from A/HA2-1 to these arrays, one can measure the relative efficiency of probe binding to target A/HA2-1 (513 homologous base pairs) or to A/HA2-2 (202 homologous base pairs) (Fig. 1, panels 8 and 10). The results derived from this analysis are shown in Fig. 3. Generally it was noted that over-laps of less than ⬃100 bp produced poor or no hybridization
A/HA2-1 probes and Cy5-labeled B/NA-1 probes and scanned simultaneously for Cy3 (panel 8) and Cy5 (panel 9) dyes at excitation wavelengths of 543 and 635 nm, respectively. For comparison, panel 10 shows another array hybridized to a mixture of Cy3-labeled A/HA2-1 and B/NA-1 probes. Panels 11 and 12 illustrate the use of multiplex RT-PCR and the ability to detect hybridization of heterologous A/Denver/1/57 and B/Hong Kong/5/72 probes to A/Port Chalmers/1/73 and B/Maryland/1/59 targets.
on May 15, 2020 by guest
http://jcm.asm.org/
signals, suggesting that this represents the minimal length of target required under these conditions. In contrast, overlap-ping sequences in excess of⬃100 bp produced readily detect-able fluorescence signals and the intensity appeared roughly dependent on the length of the overlapping region common to target and probe.
To further test what effect longer targets have on signal intensity, we took advantage of the fact that other primer combinations can be used to produce a cDNA fragment span-ning two or more target DNAs in a single RT-PCR. For ex-ample, a reaction with primers 15 and 20 (Table 3) generates a 1,607-bp probe fragment spanning targets A/HA3-1 (520 bp), A/HA3-2 (444 bp), and A/HA3-3 (707 bp). This method of probe preparation ensured that differences in the concentra-tions and specific activities of probes weren’t responsible for variations in hybridization efficiency. As expected, this now uniformly labeled DNA hybridized to all three homologous targets on a single array (Fig. 1, panel 7), and again no signif-icant cross-hybridization was detected. Quantitation of the flu-orescence signals showed the relative intensity ratios to be 1.2 (A/HA3-1) to 1.0 (A/HA3-2) to 2.1 (A/HA3-3), which follows the same trend as the relative size ratios (1.2 [A/HA3-1] to 1.0 [A/HA3-2] to 1.6 [A/HA3-3]). Therefore, as with traditional blotting technologies, DNA arrays produce hybridization sig-nals which are roughly proportional to target size.
Hybridization using mixed probes and multiple dyes.A
dou-ble-labeling experiment was also conducted to further test the discriminatory capacity of these arrays. Control experiments showed that a mixture of Cy3-labeled A/HA2-1 and B/NA-1 probes hybridized to the expected A/HA2-1 and B/NA-1 tar-gets in a single array (Fig. 1, panel 10) producing fluorescent spots of comparable intensities. No cross-hybridization signals were detected beyond some additional binding to the A/HA2-2 locus (the A/HA2-1 probe has 202-bp homology with an A/HA2-2 target). We then used different fluorescent dyes to prepare A/HA2-1 probes labeled with Cy3-dCTP and B/NA-1 probes labeled with Cy5-dCTP. The probes were mixed to-gether in equal amounts and hybridized to the array, and the bound fluorescent probes were then detected using 543 (Cy3) and 635 nm (Cy5) as the excitation wavelengths. The two
resulting images are shown in Fig. 1, panels 8 and 9. Cy3- and Cy5-labeled probes seemed to hybridize with comparable effi-ciencies, producing fluorescence signals of comparable inten-sities. Moreover, the Cy3-labeled A/HA2-1 probes hybridized only to homologous A/HA2-1 and (overlapping) A/HA2-2 tar-gets and the Cy-5-labeled B/NA-1 probe hybridized to the B/NA-1 target. These data show that one can differentiate a mixture of probes prepared using separate dyes and thus derive additional information regarding the probe composition.
Multiplex PCR. The preceding experiments showed that
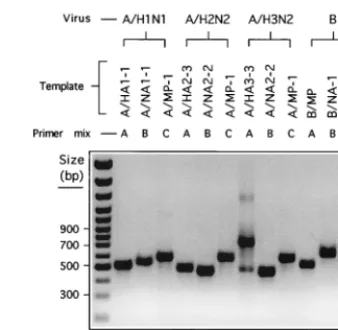
influenza virus cDNA arrays can be used to accurately identify different model probes either singly or in mixtures. However, the eventual goal of these experiments is to improve on mul-tiplex methods capable of typing and subtyping unknown vi-ruses. We thus screened our primers for primer combinations that are compatible in multiplex RT-PCRs. In recognition of the fact that some gene combinations are mutually exclusive (e.g., a virus is either H1 or H2 but can’t be both), primer combinations that should produce a single diagnostically infor-mative PCR product in a reaction with any given type or subtype of influenza virus were chosen. After testing large numbers of primer combinations against a battery of cDNAs templates, we eventually identified three multiplex primer combinations that collectively type and subtype influenza strains. These primer sets are summarized in Table 5. Figure 4 shows how these multiplex primer combinations can selectively amplify a particular gene target in reactions with one of the primer mixtures and a particular cloned cDNA target. For example, primer mixture A (Table 5) amplified an⬃510-bp A/HA1-1 product in a PCR with a cloned A/HA1-1 template (Fig. 4, lane b) as well as ⬃490-bp A/HA2-3, ⬃700-bp A/HA3-3, and ⬃530-bp B/MP-1 products in PCRs with A/HA2-3, A/HA3-3, and B/MP-1 templates, respectively (Fig. 4, lanes e, h, and k).
Typing and subtyping influenza viruses by RT-PCR and
[image:5.612.63.286.73.195.2]array hybridization.In a now more realistic test of this method
FIG. 2. Quantitation of hybridization signals. A glass background value was automatically subtracted from all measured fluorescence intensities, and the mean intensity and standard deviation (n⫽4) were then calculated for each spot. To permit comparison between different arrays and probes, the average nonspecific cross-hybridization signal detemined at nonhomologous targets was assigned an arbitrary value of 50 fluorescence units. In all cases, a clear hybridization signal was readily differentiated from this nonspecific background.
FIG. 3. Hybridization signals depend on the length of homology. Hybridization signals were measured using a variety of probes and targets, and the fluorescence intensity was plotted as a function of the number of base pairs common to each probe and target. Positive hybridization signals were significantly differentiated from a nonspe-cific cross-hybridization background when the amount of base overlap exceeded 100 to 150 bp.
on May 15, 2020 by guest
http://jcm.asm.org/
[image:5.612.321.541.492.660.2]we examined whether the multiplex primers described in Table 5 can actually type and subtype different influenza viruses. Three viral RNA strains were tested (A/Denver/1/57 [H1N1], A/Victoria/3/75 [H3N2], and B/Hong Kong/5/72), with A/Den-ver/1/57 and B/Hong Kong/5/72 being different from those strains used to prepare arrayed targets (Table 1). None of the sequences targeted in strains A/Denver/1/57 and B/Hong Kong/5/72 were known to us when the work started, nor was the sequence of the MP gene of A/Victoria/3/75. Multiplex
RT-PCR succeeded in producing all six of the six possible probes from mixtures containing influenza A virus RNA (HA1-1, HA3-3, NA1-1, NA2-2, and two MP-1 gene frag-ments) and two of the three possible probes from mixtures containing influenza B virus RNA (HA-1 and NA-1). In all cases only a single product was detected by agarose gel elec-trophoresis (data not shown). These cDNA probes correctly hybridized to targets specific for each particular type and sub-type of virus (e.g., Fig. 1, panels 11 and 12), and the
hybrid-TABLE 3. Primer pairs used to amplify influenza virus cDNAs
Fragment
Primer
Product size (bp) No. Sequence (5⬘–3⬘) Location(nta)
A/HA1-1 1 CAGATGCAGACACAATATGTATAGG 74–587 513
2 GTTGTTTACATAGGACTTGCTCAG
A/HA1-2 3 ACAGAAATTTGCTATGGCTGAC 515–910 395
4 TCACATTCATCCATTGATGCATTTG
A/HA1-3 5 ATGGTATGCTTTCGCACTGA 834–1644 810
6 CGACAGTTGAATAGATCGCCA
A/HA2-1 7 GCAAAAGCAGGGGTTATACCA 1–555 554
8 AATTTGATTCTTTCTTTGTCAGCCA
A/HA2-2 9 TGTGTTACCCAGGCAGTTTC 353–874 521
10 CCTGAACTTCCTCTCTTCGATATT
A/HA2-3 11 AATATCGAAAAGAGGAAGCTCAGG 849–1340 491
12 CCACACATCTAGAAATCCATC
A/HA2-4 13 TGAATAGTGTGAAAAATGGAAC 1508–1662 154
14 CCAGTGACAGAGAACCTGCTAC
A/HA3-1 15 CATCATGCAGTGCCAAA 125–645 520
16 TTGGTCCGTGCTCGGGT
A/HA3-2 17 TTGGGGGGTTCACCACC 613–1057 444
18 GTTTCTCTGGTACATTCCGCA
A/HA3-3 19 GCAACAGGAATGCGGAA 1025–1732 707
20 CTCAAATGCAAATGTTGCACCTAA
A/NA1-1 21 ACTTCAGTGACATTAGCCGGCA 211–747 536
22 CGATCTTGAAAATTCTGTATGAGG
A/NA1-2 23 TGGCATGGGTTGGCTAA 528–1190 662
24 GAAACTCCCGCTGTATCC
A/NA1-3 25 TGGCAATAACTGATTGGTC 1151–1380 229
26 ACTTGTCAATGGTGAATGGCA
A/NA2-1 27 TTGCCATCCTGGCAACTACTGT 95–580 495
28 CAGCCATGCTTTTCCATCGTG
A/NA2-2 29 AACCCCTTATCGAACCCT 474–938 464
30 ATTTATATCTACGACCGGCCTATT
A/NA2-3 31 TGTTCCTGTTACCCTCGATATCC 850–1461 566
32 GATTGATGTCCGCTCCATCAG
A/MP-1 33 TGAAAGATGAGCCTTCTAACCGA 19–596 577
34 CTCCATAGCCTTAGCCGTAGT
A/MP-2 35 TGACAACAACCAACCCACTAA 521–923 402
36 TTTGGTACTCCTTCCGTAG
B/HA-1 37 GTGACTGGTGTGATACCACTAAC 153–665 512
38 CGGTATCAGAGTGGAACCCC
B/HA-2 39 AATGGCTTGGGCTGTCC 542–1018 476
40 TGCATGTTCTCCTGTGTAGTAAG
B/HA-3 41 GAGCAAGGTAATAAAAGGGTCC 908–1528 620
42 GAAGCATCCATTCCCTATGTCTAC
B/NA-1 43 CACTGTCATACTTATTGTATTCGGA 102–721 619
44 CGATGCAATTGCAGGCACTT
B/NA-2 45 CAATTGCATCGGGGGAG 709–1020 311
46 GCTTCCATCATCTGGTCTGG
B/NA-3 47 GGAAGCATAACAGGGCCTTG 1013–1352 339
48 GTTGCTGCTGAGTGCCAAGTC
B/MP-1 49 TTACACTGTTGGTTCGGTGG 105–630 525
50 GCCAGTTTTTGGACGTCTTC
B/MP-2 51 GGAAATACCTATAATGCTCGAACC 757–1084 327
52 CCTCCAAAACTGTTTCACCC
ant, nucleotides.
on May 15, 2020 by guest
http://jcm.asm.org/
[image:6.612.53.552.82.597.2]ization signals were again well above the background detected at nonhomologous spots (Fig. 5).
DISCUSSION
Although DNA arrays have been most widely utilized by the genomics research community to study gene expression pat-terns and identify new genes, many authorities have speculated that they might also prove useful in DNA-based diagnostics. In this paper we have shown that robotically spotted DNA chips, when used in conjunction with multiplex PCR methods, can be used to facilitate typing and subtyping human influenza viruses. Since the method exploits the specificity of both PCR and DNA hybridization reactions, it offers a degree of accuracy superior to those of many other methods commonly used to detect PCR-amplified DNAs. Thus it should be attractive in situations, such as medical diagnostics and forensics, where further identification of a PCR-amplified DNA may be re-quired. The method is obviously applicable to any pathogen that can be cloned and arrayed and offers the advantage that one can detect and differentiate DNAs contained in mixtures of fluorescent PCR products (Fig. 1, panel 10). This suggests that DNA arrays could streamline the detection of multiple agents through parallel analysis of pools of PCR-amplified DNAs.
Several features of gene chips, PCR, and fluorescent probes facilitated the work outlined in this paper. First, PCR is well known for its extraordinary sensitivity and can be used to generate large quantities of probe DNA. Second,
[image:7.612.346.515.71.236.2]nucleotide-linked Cy3 and Cy5 dyes are readily incorporated into PCR products without greatly interfering with the efficiency of am-plification or the yield of the probe. Third, these dyes are intensely fluorescent and hybridization is easily detected at levels well above background using modern confocally based array readers. Finally, the hybridization and wash protocols
FIG. 4. Multiplex PCR amplification of influenza A and B virus strains. The three multiplex primer sets described in Table 5 were tested for the capacity to amplify a single, appropriately sized, DNA product in reactions with the indicated cloned templates. For example, primer mixture A (Table 5) produced a 510-bp product in a reaction with an A/HA1-1 template (lane b), a 490-bp product in a reaction with an A/HA2-3 template (lane e), primarily a 710-bp product in a reaction with an A/HA3-3 template (lane h), and a 530-bp product in a reaction with B/MP-1 template (lane k). PCR products were separated using a 1.2% agarose gel and stained with ethidium bromide.
[image:7.612.53.294.91.215.2]FIG. 5. RT-PCR detection and differentiation of influenza virus RNA templates. The multiplex primers indicated in Table 5 were tested for the capacity to type and subtype the indicated influenza virus strains. Probes were prepared in reaction mixtures containing crude viral RNA, Cy3-dCTP, and an appropriate multiplex primer mixture and hybridized overnight to microarrays. The signal intensity was cal-culated as described in Materials and Methods (n⫽4). Signals marked with an asterisk derive from perfectly matched probe-and-target pairs (i.e., the probe is identical to the arrayed target), and the remaining signals represent heterologous probe-and-target combinations (i.e., the target DNA came from a strain different from that tested in this experiment).
TABLE 4. Fabrication of eight-by-eight influenza virus cDNA arrays
Virus gene Row
DNA spotted at each column position for: Influenza A virus Influenza B virus
1 and 2 3 and 4 5 and 6 7 and 8
HA 1 HA1-1 HA1-3 HA2-1 HA-1
2 HA2-2 HA2-3 HA2-4 HA-2
3 HA3-1 HA3-2 HA3-3 HA-3
NA 4 NA1-1 NA1-2 NA1-3 NA-1
5 NA2-1 NA2-2 NA2-3 NA-2
6 Buffer Buffer Buffer NA-3
MP 7 MP-1 MP-1 Buffer MP-1
8 MP-2 MP-2 Buffer E. coli
TABLE 5. Multiplex PCR primer combinations and expected PCR products
Influenza virus target (virus type/ subtype)
PCR product generated by each primer mixture:
A (A/HA1-1, A/HA2-3,
A/HA3-3, B/MP-1) A/NA2-2, B/NA-1)B (A/NA1-1, C (A/MP-1,B/HA-1)
A/H1N1a A/HA1-1b A/NA1-1b A/MP-1b
A/H1N2 A/HA1-1 A/NA2-2 A/MP-1
A/H2N1 A/HA2-3 A/NA1-1 A/MP-1
A/H2N2a A/HA2-3b A/NA2-2b A/MP-1b
A/H3N1 A/HA3-3 A/NA1-1 A/MP-1
A/H3N2a A/HA3-3b A/NA2-2b A/MP-1b
Ba B/MP-1b B/NA-1b B/HA-1b
aVirus typed and subtyped in this study.
bSee Fig. 4 for analysis of multiplex PCR products.
on May 15, 2020 by guest
http://jcm.asm.org/
[image:7.612.321.538.441.614.2] [image:7.612.54.293.600.710.2]differ little from the more-traditional methods used with other nucleic acid binding membranes, and thus experience with traditional methods is directly applicable to the glass arrays used in these studies.
The preparation of DNA arrays used now fairly standard technology. We fixed DNA to the slide surface using a 5⬘ -amine-tagged oligonucleotide and carbodiimide cross-linker. This method seems to provide a more stable array and works well if, as was done here, cloned inserts can be reamplified using a single pair of primers directed against flanking vector sequences. However, the high cost of amine-linked primers renders the method impractical if many different modified primers are desired. In such situations we have employed non-covalent binding methods with comparable success (J. Li and D. H. Evans, unpublished data). To prepare DNA arrays ca-pable of typing and subtyping human influenza A and B virus strains, we designed 52 primers theoretically capable of ampli-fying 26 different portions of the influenza A and B virus HA, NA, and MP genes (Table 3). These primers amplified all but two of the intended targets in standard RT-PCRs. One of the two failures (B/MP-2) required primers that bind to sequences poorly represented in the databases and thus may have been badly designed; the failure of the other primer set (A/HA1-2) is inexplicable. The 24 successfully amplified viral cDNAs nev-ertheless provided a sufficiently redundant probe set for our purposes and were cloned, sequenced, and arrayed.
These arrayed DNAs, each about 500 bp long, were readily hybridized to probes prepared using the same cDNA templates (Fig. 1 and 2), with signal-to-background ratios ranging from 6 to 30 (Fig. 2). No obvious hybridization was detected at non-homologous targets, and no cross-hybridization was detected among the different subtypes of the viruses. There was some expected cross-hybridization seen when probes encoded se-quences shared by two or more target sese-quences. Further anal-ysis of this phenomenon showed that⬎100 bp of homology was required to produce any detectable binding (Fig. 3). This effect was almost certainly due to the stringent annealing conditions we used to ensure maximal specificity, with the hybridization temperature set⬃15°C higher than is recommended by the manufacturer of the hybridization buffer (Roche) for use in Southern blotting applications. This feature is useful, because it ensures that primer-derived sequences common to both PCR products and chip-bound targets will not cross-hybridize if illegitimate sequences have accidentally misamplified. We also noted that sensitivity was improved by increasing the size of the target spot and by increasing the length of the fluorescent probe (Fig. 1, panel 7). This last experiment also illustrates an important advantage of arraying partially redundant gene frag-ments rather than very large single cDNAs. The fact that a 1.6-kbp probe hybridized to three separate HA3 gene frag-ments showed that the cDNA encoded sequences spanning the entire gene. This provided an additional check on the identity of the probe.
It was not obvious how sequence mismatches affected hy-bridization efficiency. Using perfectly matched probes (i.e., probes derived from the same cDNA clones as target DNAs) we noted signal-to-noise ratios varying from 6 to 30 over a variety of gene fragments (Fig. 2). A similar range of signal-to-noise ratios (5 to 24) was noted when heterologous probes were prepared from viral isolates belonging only to the same
viral type and subtype as the target virus cDNAs (Fig. 5). Analyzing the cause of this variation is difficult because it is hard to measure the specific activities of fluorescent probes and because there also appear to be target-specific variations in hybridization efficiency even with identical probe-target pairs (Fig. 2). However, it is encouraging to note that both targets A/HA1-1 and A/NA-1 (derived from A/New Jersey/8/ 76) hybridized to probes derived from virus strain A/Denver/ 1/57 with signal-to-background ratios of 5.5 and 5.8, respec-tively. Upon the conclusion of these experiments we directly sequenced portions of these A/Denver/1/57-derived probes and found that the sequenced portions had⬃86% sequence identity with the target DNAs (GenBank accession no. AF305216 and AF305218). Similarly, B/HA-1 and B/NA-1 probes (derived from strain B/Hong Kong/5/72) hybridized to targets derived from strain B/Maryland/1/59 with signal-to-background ratios of 19 and 24, respectively. In this case se-quencing detected ⬃96% sequence identity between probe and target (GenBank accession no. AF305219 and AF305220), suggesting that mismatches may reduce the amount of probe bound under these stringent hybridization conditions. Never-theless, it seems clear that, if PCR primers of sufficiently broad utility can be designed, the great variation in influenza virus gene sequences (Table 2) will not seriously interfere with the application of this technology. We are currently expanding the content of these arrays to permit detection of a much greater selection of viral and other pathogens.
ACKNOWLEDGMENTS
We thank A. Hollis and B. Cooney for DNA sequencing. This work was supported by an OMAFRA special research grant, the Ontario Innovation Trust, and the Canadian Foundation for In-novation. Research in D.E.’s laboratory was supported by NSERC and CIHR grants.
REFERENCES
1.Anthony, R. M., T. J. Brown, and G. L. French.2000. Rapid diagnosis of bacteremia by universal amplification of 23S ribosomal DNA followed by hybridization to an oligonucleotide array. J. Clin. Microbiol.38:781–788. 2.Atmar, R. L., B. D. Baxter, E. A. Dominguez, and L. H. Taber.1996.
Com-parison of reverse transcription-PCR with tissue culture and other rapid diagnostic assays for detection of type A influenza virus. J. Clin. Microbiol.
34:2604–2606.
3.Bowtell, D. D.1999. Options available—from start to finish—for obtaining expression data by microarray. Nat. Genet.21:25–32.
4.Bressoud, A., J. Whitcomb, C. Pourzand, O. Haller, and P. Cerutti.1990. Rapid detection of influenza virus H1 by the polymerase chain reaction. Biochem. Biophys. Res. Commun.167:425–430.
5.Brown, E. G.2000. Influenza virus genetics. Biomed. Pharmacother.54:196– 209.
6.Debouck, C., and P. N. Goodfellow.1999. DNA microarrays in drug discov-ery and development. Nat. Genet.21:48–50.
7.Duggan, D. J., M. Bittner, Y. Chen, P. Meltzer, and J. M. Trent.1999. Expression profiling using cDNA microarrays. Nat. Genet.21:10–14. 8.Favis, R., J. P. Day, N. P. Gerry, C. Phelan, S. Narod, and F. Barany.2000.
Universal DNA array detection of small insertions and deletions in BRCA1 and BRCA2. Nat. Biotechnol.18:561–564.
9.Gerry, N. P., N. E. Witowski, J. Day, R. P. Hammer, G. Barany, and F. Barany.1999. Universal DNA microarray method for multiplex detection of low abundance point mutations. J. Mol. Biol.292:251–262.
10. Hacia, J. G.1999. Resequencing and mutational analysis using oligonucle-otide microarrays. Nat. Genet.21:42–47.
11. Hacia, J. G., J. B. Fan, O. Ryder, L. Jin, K. Edgemon, G. Ghandour, R. A. Mayer, B. Sun, L. Hsie, C. M. Robbins, L. C. Brody, D. Wang, E. S. Lander, R. Lipshutz, S. P. Fodor, and F. S. Collins.1999. Determination of ancestral alleles for human single-nucleotide polymorphisms using high-density oligo-nucleotide arrays. Nat. Genet.22:164–167.
12. Hughes, T. R., C. J. Roberts, H. Dai, A. R. Jones, M. R. Meyer, D. Slade, J. Burchard, S. Dow, T. R. Ward, M. J. Kidd, S. H. Friend, and M. J. Marton.2000. Widespread aneuploidy revealed by DNA microarray
on May 15, 2020 by guest
http://jcm.asm.org/
sion profiling. Nat. Genet.25:333–337.
13. Kozal, M. J., N. Shah, N. Shen, R. Yang, R. Fucini, T. C. Merigan, D. D. Richman, D. Morris, E. Hubbell, M. Chee, and T. R. Gingeras.1996. Ex-tensive polymorphisms observed in HIV-1 clade B protease gene using high-density oligonucleotide arrays. Nat. Med.2:753–759.
14. Magnard, C., M. Valette, M. Aymard, and B. Lina.1999. Comparison of two nested PCR, cell culture, and antigen detection for the diagnosis of upper respiratory tract infections due to influenza viruses. J. Med. Virol.59:215– 220.
15. Pease, A. C., D. Solas, E. J. Sullivan, M. T. Cronin, C. P. Holmes, and S. P. Fodor.1994. Light-generated oligonucleotide arrays for rapid DNA se-quence analysis. Proc. Natl. Acad. Sci. USA91:5022–5026.
16. Schena, M., D. Shalon, R. W. Davis, and P. O. Brown.1995. Quantitative monitoring of gene expression patterns with a complementary DNA mi-croarray. Science270:467–470.
17. Schena, M., D. Shalon, R. Heller, A. Chai, P. O. Brown, and R. W. Davis.
1996. Parallel human genome analysis: microarray-based expression moni-toring of 1000 genes. Proc. Natl. Acad. Sci. USA93:10614–10619. 18. Schorr, E., D. Wentworth, and V. S. Hinshaw.1994. Use of polymerase chain
reaction to detect swine influenza virus in nasal swab specimens. Am. J. Vet. Res.55:952–956.
19. Schweiger, B., I. Zadow, R. Heckler, H. Timm, and G. Pauli.2000. Appli-cation of a fluorogenic PCR assay for typing and subtyping of influenza viruses in respiratory samples. J. Clin. Microbiol.38:1552–1558.
20. Shalon, D., S. J. Smith, and P. O. Brown.1996. A DNA microarray system for analyzing complex DNA samples using two-color fluorescent probe hy-bridization. Genome Res.6:639–645.
21. Sniegowski, P. 1999. The genomics of adaptation in yeast. Curr. Biol.
9:R897–R898.
22. Stockton, J., J. S. Ellis, M. Saville, J. P. Clewley, and M. C. Zambon.1998. Multiplex PCR for typing and subtyping influenza and respiratory syncytial viruses. J. Clin. Microbiol.36:2990–2995.
23. Taubenberger, J. K., A. H. Reid, A. E. Krafft, K. E. Bijwaard, and T. G. Fanning.1997. Initial genetic characterization of the 1918 “Spanish” influ-enza virus. Science275:1793–1796.
24. Willer, D. O., G. McFadden, and D. H. Evans.1999. The complete genome sequence of shope (rabbit) fibroma virus. Virology264:319–343. 25. Wilson, J. W., P. Bean, T. Robins, F. Graziano, and D. H. Persing.2000.
Comparative evaluation of three human immunodeficiency virus genotyping systems: the HIV-GenotypR method, the HIV PRT GeneChip assay, and the HIV-1 RT line probe assay. J. Clin. Microbiol.38:3022–3028. 26. Wright, K. E., G. A. Wilson, D. Novosad, C. Dimock, D. Tan, and J. M.
Weber.1995. Typing and subtyping of influenza viruses in clinical samples by PCR. J. Clin. Microbiol.33:1180–1184.
27. Zambon, M. C.1999. Epidemiology and pathogenesis of influenza. J. Anti-microb. Chemother.44(Suppl. B):3–9.
28. Zhang, W., and D. H. Evans.1993. PCR detection and differentiation of influenza virus A, B, and C strains, p. 374–382.InD. H. Persing, T. Smith, F. Tenover, and T. White (ed.), Diagnostic molecular microbiology. Amer-ican Society for Microbiology, Washington, D.C.
29. Zhang, W. D., and D. H. Evans.1991. Detection and identification of human influenza viruses by the polymerase chain reaction. J. Virol. Methods.33:
165–189.