Volume 8, No. 5, May-June 2017
International Journal of Advanced Research in Computer Science
RESEARCH PAPER
Available Online at www.ijarcs.info
ISSN No. 0976-5697
Software Effort Estimation using Meta Heuristic Algorithm
M.Padmaja
Assistant Professor, Department of CSE, Gitam Institute of Technology, GITAM University, Visakhapatnam, India
Dr. D.Haritha
Associate Professor, Department of CSE, University College of Engineering
JNTU-Kakinada, India
Abstract: Many projects have been developed and produced through software industries. To develop the project, project management team must estimate the effort, cost as well as schedule to finish the project with high quality to satisfy the customer. In large projects, accurate cost and effort estimation are the essential task for the project manager. Software effort estimation is a vital role in industries to manage the project. To estimate the effort and cost of the new project, researchers and practitioners have recently proposed machine learning methods and optimization algorithms. In this paper we propose one of the metaheuristic approaches such as BAT algorithm to improve the accuracy of software cost estimation with existing optimization techniques. The results obtained using the proposed model compared with other model i.e GRA to minimize the error rate. The experimental observation show better results, high accuracy and has potential evidence that proves the efficiency.
Keywords: Effort Estimation, Grey Relational Analysis (GRA), COnstructive COst MOdel (COCOMO), Bat algorithm.
I. INTRODUCTION
In project management, the effort estimation is an important activity. The aim behind software project development not only in the implementation of the product successfully but also to estimate the perfect cost. Estimation includes the process of considering the essential cost, experiences, time constraints, risks, schedules, assets and other elements related to the expansion of a project. Hence, cost estimation plays vital role in managing a project mainly depends on the project manager when proposing budget for well project. In order to develop software efficiently in this competitive and complex environment, several organizations use software metrics as a part of their project development. In the last two decades, many researchers and practitioners use statistical and machine learning-based models to estimate the effort. Software effort estimation has received a significant amount of attention from researchers and has become a challenging task for software industry.
The problem with estimation is that the project manager has to quantify the cost, effort and delivery period before the completion of the design. As more information is available, estimates can be more accurate. Estimation suffers due to incomplete knowledge, lack of time and various competitive pressures that are directly or indirectly put over the developer to arrive at more acceptable estimates. This can be achieved by selecting an efficient method to estimate accurately.
Effort estimation is mainly classified into two types: algorithmic and non-algorithmic. Constructive Cost Model (COCOMO) is a static effort estimation model developed by Boehm in 1981 is used as an algorithmic model to compute the effort [1]. It has a hierarchy of three estimation models i.e basic, intermediate and detailed. All these three models use size as the main input. Another factor is “mode” of project development that is way in which the project is going to be handled. There are three types of modes, to handle projects i.e organic, detached and semi detached. In all types
of projects some factors has to be considered to estimate the effort. These factors help to calibrate effort using historical data for each development mode. Mainly these factor values influence on the estimate the effort. Hence the needs to optimize these factors arise.
Deng. J [2], has proposed a novel approach such as Grey Relational Analysis (GRA) to predict effort estimation. In 1980, Grey Systems Theory (GST) was introduced by Professor Deng Ju-long from China. It was a novel method applicable to the study of unascertained problems with few data and/or poor information [3-6]. Grey relational analysis is one part of the grey system theory. GRA is used to find out projects that are similar to a new project and configure the required parameters to estimate the effort or cost of a project.
Optimization is a process of obtaining the optimal solution of problem under given circumstances. The crucial task of optimization is to minimize time or maximize desired benefit of a given engineering system. All systems that are to be optimized have an objective function and several decision variables that affect the objective function [8]. Optimization algorithms are generally divided into two groups as deterministic and stochastic algorithms. Deterministic algorithms do not contain any operators that cause randomness. This type of algorithms produces the same result as long as their initial conditions remain constant. On the other hand, due to their random nature, stochastic algorithms tend to produce different solutions even when their initial conditions remain constant at each run.
Flexible and easily applicable structure of these algorithms has made them very popular in recent years.
II. RELATEDWORK
Estimating the effort and cost is the prerequisite process of the software development before handling the projects. The goal of a Software Manager is to deliver the software product efficiently with high quality. He is responsible to estimate the effort and cost efficiently in advance.
Jin-Cherng Lin et., al [10] was used computing intelligence techniques that is, PSO on clustered data within three to four groups to estimate effort and resulted in minimum error rate Qinbao Song et., al [11] had proposed a novel approach of using Grey Relational Analysis of Grey System Theory to address. The feature subset selection and software effort prediction at an early stage of a software development process on two types of datasets. In addition M.Padmaja, D. Haritha [6] applied GRA method on kemerer dataset and compared the results with other basic models.
In this paper we propose one of the meta-heuristic algorithms bat to optimize the factor values to estimate the effort. Bat algorithm is a meta-heuristic, nature inspired, swarm based algorithm proposed by Yang [7], in 2010. It is an optimization method based on the echolocation behaviour of bats.
Neha gupta [12] was used bat algorithm on COCOMO 63 dataset on different types of modes of projects was tested and the obtained results were compared with the obtained using the current COCOMO model coefficients.
Muhammad Ibrahim [13] bat algorithm was used to evaluate the software projects of NASA60 dataset. The results indicated that MMRE have reduced the amount of MMRE in comparison with COCOMO model and other models.
III. METHODOLOGY
In this paper, two methods selected to estimate the effort and find out the fitness value on same dataset. And compare the results to decide which one is having minimum fitness value. One is Grey Relational Analysis (GRA) was used to find similar projects of a new projects from historical data and obtain the estimated effort of that project. After obtained the effort estimation of all projects using GRA and calculate the MMRE.
Another algorithm is one of the metaheuristic algorithm bat algorithm was selected to estimate the effort of every project based on influenced factors. These factor values optimized using this algorithm at local position and global position and obtain the fitness value such as MMRE. It is mostly impact on factor values on which position getting minimum MMRE, those values to be considered. Finally compare and verify the results on both methods to show the minimum error rate regarding estimate the effort on all projects. The procedure of these two algorithms described below.
A. Grey Relational Analysis to estimate the effort:
GRA provides an efficient solution to complicated interrelationships among multiple response parameters. Based on the grey theory, a system can be investigated by means of Grey Relational Coefficient (GRC), Grey Relational Grade (GRG) so as to take a final decision regarding selection of optimum variable combination based on the highest grade i.e Grey Relational Rank (GRR). The GRA is very effective to evaluate the effort of a project based on influenced projects. The following are the steps involved in implementing GRA.
a. Normalization
The first step is the standardization of the various attributes considered as duration, KSLOC and function points since they influence the effort estimation. In this paper, to normalize the parameters used, larger-the-better and smaller-the- better were used as shown in Eqs.(1) and (2). The normalized values are always between 0 to 1.
Upper-bound effectiveness (i.e., larger – the – better):
)
(
min
)
(
max
)
(
min
)
(
)
(
*k
x
k
x
k
x
k
x
k
x
i i i i i−
−
=
(1)Here i = 1,2, , , , m and k = 1,2,3, , , , n
Lower-bound effectiveness (i.e, smaller – the – better):
)
(
min
)
(
max
)
(
)
(
min
)
(
*k
x
k
x
k
x
k
x
k
x
i i i i i−
−
=
(2)Here i = 1,2, , , , m and k = 1,2,3, , , , n
Where,
x
i(
k
)
represents the value of the kth attribute in the ith series;*
)
(
k
x
irepresents the modified grey relational generating of the kth attribute in the ith series;
)
(
max
x
ik
represents the maximum of the k thattribute in
all series;
)
(
min
x
ik
represents the minimum of the kth attribute in
all series;
b. Grey Relational Coefficient (GRC)
GRA uses the grey relational coefficient to describe the trend relationship between an objective series and a reference series at a given point in a system. To calculate coefficients of parameters in all projects, Eq. (3) was used.
GRC can be calculated as,
max 0 max min 0
)
(
))
(
),
(
(
∆
+
∆
∆
+
∆
=
ζ
ζ
γ
k
k
x
k
x
i i (3)Here ζ is the distinguishing coefficient. Generally, the
distinguishing coefficient can be adjusted to fit the practical requirements.
ζ € (0,1] i.e 0.5
)
(
)
(
)
(
00i
k
=
x
k
−
x
ik
∆
i.e. Delta values or Deviation coefficients
∆
min=
min
imin
jx
0(
k
),
x
i(
k
)
∆
min=
max
imax
jx
0(
k
),
x
i(
k
)
c. Grey Relational Grade (GRG)project to be estimated and previous history of other projects. The greater the GRG between two projects, the closer relationship between these projects is [6].
∑
==
Γ
n k ii
x
k
x
k
n
k
x
k
x
1 00
(
(
),
(
))
1
))
(
),
(
(
γ
(4) Where, i € {1, 2, 3, , , n}n is the number of response parameters d. Grey Relational Rank (GRR)
For the project to be estimated, the estimated effort should be retrieved from the historical data of project with the largest GRG among all projects [6]. Ranks should be assigned with respect to GRG with the most influenced project to find the effort estimation of the new project. e. Effort Prediction by Using GRA
To calculate the estimated effort of a particular project with most influence k projects data, the following equation is applied [6].
∑
==
n i i iw
1*
ˆ
ε
ε
(5) Where,ε
ˆ
is the predicted efforti
ε
is the actual effort of influenced project
i
w
is weight is calculated by
∑
=Γ
Γ
=
k i i i ix
x
x
x
w
1 0 0)
,
(
)
,
(
(6) Where,)
,
(
x
0x
iΓ
is the GRG value of most influenced project i=1 to k means most k influenced projects
B. Bat algorithm to estimate the effort:
Bat algorithm (BA), proposed by Xin-She Yang in 2010, is a swarm based metaheuristic optimization algorithm inspired by a property known as echolocation. This bat algorithm is based on the echolocation behaviour of microbats with varying pulse rates of emission and loudness. Micro bats echolocation capability helps them to detect preys, distinguish different kinds of insects. Echolocation is a type of sonar that guides bats in their flying and hunting behaviour. Not only can the bats move, but also they distinguish different types of insects even in complete darkness thanks to their capability [7].
The bat behaviour can be used to formulate a new BA. Yang [7-9] used three generalized rules when implementing the bat algorithms:
• All the bats use an echolocation to sense the distance, and they also ‘know’ the difference between food/prey.
• When searching for their prey, the bats fly randomly with velocity vi at position xi with a fixed frequency fmin, varying wavelength λ and loudness A0. They can automatically adjust the wavelength (or frequency) of their emitted pulses and adjust the rate of pulse emission r ϵ [0, 1], depending on prey position.
• Although the loudness can vary in many ways, we assume that the loudness varies from a large (positive)
A0 to a minimum constant value Amin. Pulse rate increases as the bat approaches prey.
In addition these simplified assumptions; we also use the following approximations for simplicity. In general the frequency f in a range [fmin, fmax] corresponds to a range of
wavelengths [λmin, λmax]. For example, a frequency range of [20khz, 5000khz] corresponds to a range of wavelengths from 0.7min to 17min.
The structure of bat algorithm [9]:
1) Initialization of bat population: The search space is assumed as a region that contains many prey sources on it. The algorithm tends to find the high or optimum quality food in the search space. Because locations of food sources are not known, initial population is randomly generated from real-valued vectors with dimension d and number N, by taking into account lower and upper boundaries. Then, quality of food sources located within the population is evaluated.
)
(
max minmin
x
x
x
x
ij=
+
ϕ
−
(7) Where i=1,2,3, . . .N, j = 1,2,3, . . .d,
xmax and xmin are upper and lower boundaries for dimension j respectively
φ is a randomly generated value ranging from 0 to 1.
2) Generation of frequency, velocity and new solution: Evaluated fitness values of all bats influence their movements. Bats fly with velocity vi which is affected by a randomly predefined frequency f. Finally they locate their new position xi in the search space.
)
(
max minmin
f
f
f
f
i=
+
β
−
(8)i t i t i t
i
v
x
x
f
v
=
−1+
(
−1−
*)
(9) t i t i t
i
x
v
x
=
−1+
(10)Where fi is a frequency value belonging to the ith bat fmin and fmax are minimum and maximum frequency values β indicates a randomly generated value
x* is the obtained global best location (solution) after comparison of all solutions among N bats
t i
v
implies the velocity of the ith bat at tth time step.3) Estimate the effort: To estimate the effort in basic COCOMO model using below equation (11). In this equation a and b are factors, using BAT method, find the factor (a,b) values to estimate the effort.
b
size
a
EE
ffort
EstimatedE
(
)
=
*
(
)
(11)Here, a and b are factors Size is size of the project
4) Evaluation criteria: Evaluate the proposed method was show the better result using equation (13) i.e fitness value is MMRE. To calculate the fitness value first finds MRE of every project. It is show the error rate of every project with proposed model.
i i i
rt
ActualEffo
ffort
EstimatedE
rt
ActualEffo
MRE
=
−
(12)actual effort taken from historical data
Estimated effort is finding using proposed model
∑
=
=
Ni
i
MRE
N
MMRE
1
1
(13)
Here, MMRE means mean magnitude relative error N is number of projects
MRE means magnitude relative error
5) Local search capability of the algorithm: In order to improve local search capability of the algorithm, Yang has created a structure in order that the bat can improve the solution near the obtained one.
t old
new
X
A
X
=
+
ε
(14)where Xold is a high quality solution
ε
is a random number in [-1,1]At is average loudness value of all bats at tth time step
6) Loudness and pulse emission rate: The loudness A and pulse emission rate r are updated as a bat gets closer to its target, namely its prey. Loudness A is decreased while pulse emission rate r is increased with respect to Eqs. (15) and (16.
t i t
i
A
A
+1=
α
(15)
[
1
exp(
)]
0 1
t
r
r
it
i
=
−
−
γ
+ (16)
Where
α
andγ
are constants0
i
r
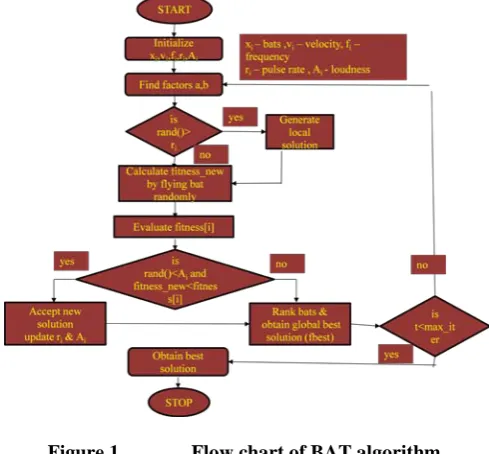
is the initial pulse emission rate value of the ith bat. Pseudo-code and flow chart of the algorithm are given in Algorithm and Fig. 1, respectively.Algorithm: Pseudo-code of bat algorithm to estimate the effort
1. Initialize the number of iterations, bats and projects. 2. Initialize the pulse rate( ri) , velocity(vi) and loudness(Ai) 3. Initialize a and b values.
4. Loop till all iterations are completed
a.Find new values of a and b based on velocity using equations 8 to 10
b.Find estimated effort of the projects with the above found a and b values using equation 11
c.Find MRE of the projects with the above found a and b values using equation 12
d.Find the MMRE(fitness[i]) using equation 13 e.If rand > pulse rate
i. then update a and b values using equation 14 ii. generate a local new solution (fitness_new),
again find the MRE and MMRE for the projects based on new a and b values around the selected best solution
f.generate a new solution by flying bat randomly i.e fitness[i]
g.if((rand< Ai) && (fitness_new < fitness[i])) i. then accept the new solution
ii. Decrease Ai, increase ri using 15 & 16 to next iteration
h.rank the bats and find the current best i.e fbest i. find out the least MMRE value
5. Display the results.
[image:4.595.315.560.57.284.2]6. Post process results and visualization.
Figure 1. Flow chart of BAT algorithm
IV. EXPERIMENTAL RESULTS
In this paper, the proposed model has been applied on Kemerer dataset and compares the results with other models. Experimentation in this paper has been done by first applying GRA method and BAT algorithm to find the effort estimation and then verify the error rate on both methods. Description of Kemerer Dataset:
In this paper, Kemerer dataset (Table 1) is used for evaluation and respective results are tabulated. On Kemerer data we applied GRA method to find the effort estimation and show the error rate. It has 15 projects. From this dataset we take size in KSLOC and effort to estimate the effort using proposed method. The step by step evaluation of the proposed methodology is described as follows.
Table 1.Kemerer data set
ID Duration KSLOC AdjFP RAWFP Effort
1 17 253.6 1217.1 1010 287
2 7 40.5 507.3 457 82.5
3 15 450 2306.8 2284 1107.31
4 18 214.4 788.5 881 86.9
5 13 449.9 1337.6 1583 336.3
6 5 50 421.3 411 84
7 5 43 99.9 97 23.2
8 11 200 993 998 130.3
9 14 289 1592.9 1554 116
10 5 39 240 250 72
11 13 254.2 1611 1603 258.7
12 31 128.6 789 724 230.7
13 20 161.4 690.9 705 157
14 26 164.8 1347.5 1375 246.9
15 14 60.2 1044.3 976 69.9
A. Grey Relational Analysis:
[image:4.595.309.560.490.757.2]between 0 to 1 using equations (1-2). On normalized data find the similarities of a particular project using equations (3-4) and finally estimate the effort of project using equation (5). Similarly, this process can be repeated to all projects and calculate the error rte using equations (13).
[image:5.595.315.557.66.238.2]Using GRA on kemerer data estimated effort of every project is shown in below table and figure.
Table 2.Estimated effort using GRA method
Project ID Actual Effort Estimated Effort using GRA
1 287 158.4833872
2 82.5 79.3454572
3 1107.31 219.9509304
4 86.9 174.169513
5 336.3 208.6745154
6 84 78.16597002
7 23.2 90.04539176
8 130.3 142.4321141
9 116 220.0229945
10 72 79.40079255
11 258.7 222.8425189
12 230.7 139.4482826
13 157 152.5512605
14 246.9 253.375697
15 69.9 133.7888356
Figure 2. Analysis of estimated effort using GRA
The results of GRA model gives a better estimation compared to the various algorithmic models of effort estimation and shows as minimum error rate as desired in below table 3 and the same is depicted clearly in the below figure 3.
Table 3.Comparison of efficiency of the various models with proposed model
Model Name MMRE(%)
COCOMO 244.2667
Halstead 7679.953
Bailey-Basil 101.5933
Doty 647.12
Watson and Felix 268.0933
PSO 56.74026
GRA 54.78
Figure 3. Efficiency of MMRE is comparison of various models with GRA model
B. BAT algorithm:
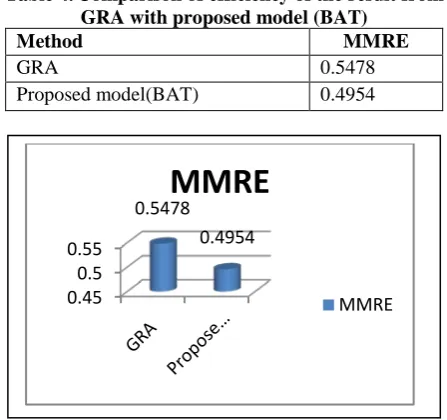
One of the metaheuristic algorithm is BAT was used to estimate the effort on kemerer data. With help of update the values using equations (8-10) find the fitness value as in local position and global position. Finally obtain the minimum fitness value irrespective of factor values. Find the fitness value using equations (12-13) and compare the result with other model i.e GRA. From this, we observe the GRA model shows the minimum error rate than GRA.
Proposed model shows the minimum error rate with other model is GRA as shown in Table 4 and figure 4. Through the experimental results, from the point of MMRE, the proposed model is proven to be more efficient in comparison to the various models in terms of accuracy in estimation resulted in better performance.
[image:5.595.32.278.154.557.2].
Table 4.Comparison of efficiency of the result from GRA with proposed model (BAT)
Method MMRE
GRA 0.5478
Proposed model(BAT) 0.4954
Fig. 4 Efficiency of MMRE with proposed model (BAT) V. CONCLUSION AND FUTURE WORK
Software projects development is a very challenging task to be handled by any industry. Effort estimation for the
0 2000 4000 6000 8000
CO
CO
M
O
Hal
st
ead
Ba
ile
y-Ba
sil
Do
ty
Wa
ts
on
…
PS
O
GR
A
MMRE(%)
MMRE(%)
0 200 400 600 800 1000 1200
1 3 5 7 9 11 13 15
Project ID
Actual Effort
Estimated Effort using GRA
0.450.5 0.55
0.5478 0.4954
MMRE
[image:5.595.325.549.507.717.2]developing projects has to be predicted before the actual software development, in such way that the newly developed project must exhibit higher quality in less cost. To accomplish this, project management team must select a best model to achieve the mentioned goals and deliver the project in time.
In this paper, the proposed model is BAT algorithm was used to find factor values to estimate the effort of every project, and then calculate best fitness value on overall projects. Experimental results show minimum error rate when compared to other algorithmic models of effort estimation is Grey Relational Analysis (GRA). Further extension of this work can be done on other COCOMO models, using variations of BAT algorithm and combining the proposed model with other techniques applied on different datasets.
VI. REFERENCES
[1] B. W. Boehm, “Software Engineering Economics”.
Englewood Cliffs, NJ: Prentice-Hall, 1981
[2] Deng. J “Introduction to grey system”, Journal of Grey
System, Vol.1 No.1, pp. 1-24. 1989
[3] K. H. Hsia and J. H. Wu, “A study on the data preprocessing in grey relational analysis”, The Journal of Grey System, Vol. 9 (1) , pp. 47–53, 1997
[4] Lin. Yi, Liu. Sifeng “A Historical Introduction to Grey Systems Theory”, IEEE International Conference on
Systems, Man and Cybernetics, 2004
[5] Deng Julong “Introduction to Grey System Theory”, The
journal of grey system, pp 1-,24, 1989
[6] M.Padmaja, Dr D.Haritha, “Software Effort Estimation using Grey Relational Analysis”, MECS in International Journal of Information Technology and Computer Science, 2017 [7] Yang, X.-S., “A New Metaheuristic Bat-Inspired Algorithm”,
in: Nature Inspired Coop-erative Strategies for Optimization (NISCO 2010), Studies in Computational Intelligence, Springer Berlin, 284, Springer, pp. 65-74.
[8] Yang, X. S., Nature-Inspired Metaheuristic Algorithms, 2nd Edition, Luniver Press, (2010).
[9] Selim Yılmaz, Ecir U. Kuc¸ uksille, “A new modification approach on bat algorithm for solving optimization problems”, Applied Soft Computing 28 , pp. 259–275, 2015
[10]Jin-Cherng Lin, Yueh-Ting Lin, Han-Yuan Tzeng and Yan-Chin Wang, “Using Computing Intelligence Techniques to Estimate Software Effort”, International Journal of Software
Engineering & Applications (IJSEA), Vol.4, No.1, January
2013
[11]Qinbao Song, Martin Shepperd and Carolyn Mair, “Using Grey Relational Analysis to Predict Software Effort with Small Data Sets”, 11th IEEE International Software Metrics Symposium - METRICS 2005
[12]Neha gupta, Kapil Sharma, “Optimizing Intermediate COCOMO Model Using BAT Algorithm”, IEEE, 2015 [13]Muhammad Ibrahim, “ A New Model for Software Cost