University of Windsor University of Windsor
Scholarship at UWindsor
Scholarship at UWindsor
Electronic Theses and Dissertations Theses, Dissertations, and Major Papers
2014
Developing a life cycle analysis framework for the microalgae
Developing a life cycle analysis framework for the microalgae
biodiesel industry
biodiesel industry
Katie Soulliere
University of Windsor
Follow this and additional works at: https://scholar.uwindsor.ca/etd
Recommended Citation Recommended Citation
Soulliere, Katie, "Developing a life cycle analysis framework for the microalgae biodiesel industry" (2014). Electronic Theses and Dissertations. 5067.
https://scholar.uwindsor.ca/etd/5067
This online database contains the full-text of PhD dissertations and Masters’ theses of University of Windsor students from 1954 forward. These documents are made available for personal study and research purposes only, in accordance with the Canadian Copyright Act and the Creative Commons license—CC BY-NC-ND (Attribution, Non-Commercial, No Derivative Works). Under this license, works must always be attributed to the copyright holder (original author), cannot be used for any commercial purposes, and may not be altered. Any other use would require the permission of the copyright holder. Students may inquire about withdrawing their dissertation and/or thesis from this database. For additional inquiries, please contact the repository administrator via email
DEVELOPING A LIFE CYCLE
ANALYSIS FRAMEWORK FOR THE
MICROALGAE BIODIESEL INDUSTRY
by
Katie Soulliere
A Thesis
Submitted to the Faculty of Graduate Studies
through Mechanical, Automotive, & Materials Engineering
in Partial Fulfillment of the Requirements for
the Degree of Master of Applied Science at the
University of Windsor
Windsor, Ontario, Canada
Developing a Life Cycle Analysis Framework for the Microalgae Biodiesel Industry
by
Katie Soulliere
APPROVED BY:
______________________________________________
M. Zheng
Department of Mechanical, Automotive, & Materials Engineering
______________________________________________
R. Seth
Department of Civil & Environmental Engineering
______________________________________________
E. Tam, Advisor
Department of Mechanical, Automotive, & Materials Engineering
iii
AUTHOR’S DECLARATION OF ORIGINALITY
I hereby certify that I am the sole author of this thesis and that no part of this thesis
has been published or submitted for publication.
I certify that, to the best of my knowledge, my thesis does not infringe upon
anyone’s copyright nor violate any proprietary rights and that any ideas, techniques,
quotations, or any other material from the work of other people included in my thesis,
published or otherwise, are fully acknowledged in accordance with the standard
referencing practices. Furthermore, to the extent that I have included copyrighted material
that surpasses the bounds of fair dealing within the meaning of the Canada Copyright Act,
I certify that I have obtained a written permission from the copyright owner(s) to include
such material(s) in my thesis and have included copies of such copyright clearances to my
appendix.
I declare that this is a true copy of my thesis, including any final revisions, as
approved by my thesis committee and the Graduate Studies office, and that this thesis has
iv
ABSTRACT
This research develops a Life Cycle Analysis framework for evaluating the sustainability
performance within the microalgae industry for producing biodiesel. The industry is now
so extensive that an LCA framework is needed as a guide. The microalgae biodiesel
industry varies considerably in configuration design and output. The industry is rapidly
developing and growing and needs an LCA tool to keep pace with assessing its benefits
and impacts. Disruptive technologies in extraction and synthesis can increase the economic
viability and catapult microalgae biodiesel as a true competitor in the fuel market. An
assessment of environmental impacts is essential, with particular emphasis on the
trade-offs of microalgae biodiesel production because of potential risks, such as when using
GMO-algae. Industry trends were coupled with LCAs from literature to develop an
industry benchmark and LCA framework. Industry benchmarks can act as an anchor for
transparent and explicit comparison of LCAs. An LCA framework was shown to be
beneficial in rapidly evaluating a design configuration for the microalgae biodiesel
industry. More research is necessary in generating benchmarks for economics, water use,
v
DEDICATION
vi
ACKNOWLEDGEMENTS
I would like to thank Dr. Tam for his patience and wisdom for the past 2.5 years. I am grateful for the new ways of thinking and working I have learned from Dr. Tam.
I would also like to thank Dr. Zheng and Dr. Seth for their time, consideration, and insightful questions and suggestions which greatly improved the final thesis.
Further, I would like to acknowledge the funding provided by Green Auto Powertrain, and the new ideas gained from attending and presenting at the annual general meetings.
vii
TABLE OF CONTENTS
Author’s Declaration of Originality ... iii
Abstract ... iv
Dedication ... v
Acknowledgements ... vi
List of Tables ... x
List of Figures ... xi
List of Appendices ... xii
List of Abbreviations ...xiii
List of Nomenclature ... xiv
1.0 Introduction ... 1
2.0 Objectives ... 3
3.0 Literature Review... 4
3.1 Potential for Microalgae Biodiesel Production ... 4
3.2 Microalgae Biodiesel Production Process ... 5
3.2.1 Life Stages: Cultivation Phase ... 6
3.2.2 Life Stages: Harvesting Phase ... 8
3.2.3 Life Stages: Extraction Phase ... 9
3.2.4 Life Stages: Synthesis Phase ... 10
3.3 Microalgae Biodiesel Lower Heating Value (LHV) ... 11
3.4 Potential By-Products ... 11
3.5 Trade-offs Associated with Microalgae Biodiesel ... 12
3.6 Bioengineering Microalgae ... 13
3.7 The Bioethanol Industry: Review ... 13
3.7.1 Brazil ... 13
3.7.2 United States ... 14
3.7.3 Canada... 15
3.8 Lessons Learned from the Bioethanol Industry ... 16
3.9 Life Cycle Analysis: Review ... 16
3.10 Life Cycle Analysis: Benchmarking ... 17
3.11 LCA Framework ... 17
viii
3.13 Current Commercial Operations ... 18
3.14 GaBi LCA Software ... 22
3.15 LCAs Currently Available ... 22
4.0 Methodology ... 26
4.1 Methodology: Industry Trends ... 26
4.1.1 Rationale for Choosing Companies ... 27
4.2 Methodology: LCAs from Literature Analysis ... 28
4.3 Methodology: Data Gap Analysis ... 33
4.4 Methodology: Functional Units ... 34
4.5 Methodology: Benchmarks ... 35
4.6 Methodology: Developing Default Case for LCA Framework... 36
4.7 Methodology: Selecting Case Studies... 36
4.8 Methodology: GaBi Testing ... 38
4.9 Compile LCA Framework ... 40
5.0 Results and Discussion ... 41
5.1 Life Stages Common to All Configurations ... 41
5.2 Industry Trends: Configuration Design ... 41
5.3 Data Quality of LCAs Reviewed ... 45
5.3.1 Data Compilation and Conversion Description ... 47
5.3.2 Calculations for Converting Data to Common Units ... 47
5.3.3 Issues Encountered Converting Units ... 51
5.3.4 Data Quality Discussion ... 52
5.3.5 Literature LCA Data Gap Analysis ... 53
5.4 LCA Framework: Prioritized Focus ... 59
5.5 LCA Framework: Definition of Functional Units ... 60
5.6 LCA Framework: Benchmarks ... 61
5.7 LCA Framework: Process Flow Options for Configuration Design ... 65
5.8 LCA Framework: Default Case Configuration and Flowchart ... 67
5.8.1 Default Case: Growth Mode ... 69
5.8.2 Default Case: Harvesting Mode ... 69
5.8.3 Default Case: Extraction Mode ... 70
5.8.4 Default Case: Synthesis Mode ... 70
5.8.5 Default Case: Overcoming Past Obstacles ... 71
ix
5.10 LCA Framework: Development Using GaBi ... 74
5.11 LCA Framework: Test Framework Using Case Studies ... 75
5.11.1 Case Study #1 ... 75
5.11.2 Case Study #2 ... 83
6.0 Conclusions ... 89
7.0 Future Work ... 91
Appendix A: Case Study #1 for LCA Framework Testing ... 92
Appendix B: Case Study #2 for LCA Framework Testing ... 93
Appendix C: GaBi Data for Case Study #1 ... 94
Appendix D: GaBi Data for Case Study #2 ... 98
Appendix E – Compiled LCA Framework ... 100
References ... 105
x
LIST OF TABLES
Table 1: Fuel Lower Heating Values ……….…………...….11
Table 2: Full Scale Microalgae Biodiesel Production Companies……….………...19
Table 3: Example LCAs for Microalgae Biodiesel Production ……….…………...23
Table 4: Microalgae Biodiesel Industry Company List……….………...27
Table 5: Rationale for Choosing LCAs from Literature……….…...………..29
Table 6: LCAs from Literature Utilized for LCA Framework………...………….32
Table 7: LCIA Microalgae Biodiesel Industry Configuration Chart………...……….……42
Table 8: Data Compiled from LCA Literature……….………..……….46
Table 9: Assessment of Characteristics for Utilized Literature LCAs………….….………….…..53
Table 10: Average and Standard Deviation of LCA Metrics from LCA Literature Data………....59
Table 11: Decision Matrix for Benchmark Creation………...………63
Table 12: Benchmark – Based on Industry Trends and LCA Literature Data……….…..……….64
Table 13: Process Flow Options for Configuration Design………...………….66
Table 14: Data Acquisition Rubric………..……..………..73
Table 15: Data Acquisition Rubric – Case #1: Base Case Scenario.……….….…………76
Table 16: Data Acquisition Rubric – Case #1: Best Case Scenario……….……..………….78
Table 17: Comparison between Original and GaBi Results – Case #1………….……..…………80
Table 18: Data Acquisition Rubric – Case #2……….……….…..………….84
Table 19: Comparison between Original and GaBi Results – Case #2………….……….……….86
Table 20: Case #1 Data from Journal Article – Brentner et al. 2011………….……….…………92
Table 21: Case #2 Data from Journal Article – Batan et al. 2010……….……...…………...93
Table 22: GaBi Raw Data: Case #1 Base Case Scenario (Energy)………….……..………..94
Table 23: GaBi Raw Data: Case #1 Base Case Scenario (GWP)………….………..……….95
Table 24: GaBi Raw Data: Case #1 Best Case Scenario (Energy)……….………..……...96
Table 25: GaBi Raw Data: Case #1 Best Case Scenario (GWP)……….………..…………..97
Table 26: GaBi Raw Data: Case #2 (Energy)……….………..……..…….98
xi
LIST OF FIGURES
Figure 1: Comparison between Rapeseed Oil and Microalgae Biodiesel ... 4
Figure 2: Life stages for biodiesel production from microalgae ... 5
Figure 3: Expanded Life Stages Diagram ... 5
Figure 4: Cultivation Phase Diagram ... 6
Figure 5: Raceway Ponds ... 6
Figure 6: Photobioreactors ... 7
Figure 7: Harvesting Phase Diagram ... 8
Figure 8: Extraction Phase Diagram ... 9
Figure 9: Synthesis Phase Diagram ... 10
Figure 10 Example Process Database in GaBi for Growth Mode for Appendix B ... 38
Figure 11 GaBi Process for US Electricity Grid Mix ... 39
Figure 12: Example life stages for biodiesel production ... 41
Figure 13: Cultivation phase ... 43
Figure 14: Harvesting Phase ... 43
Figure 15: Extraction Phase ... 44
Figure 16: Synthesis Phase ... 44
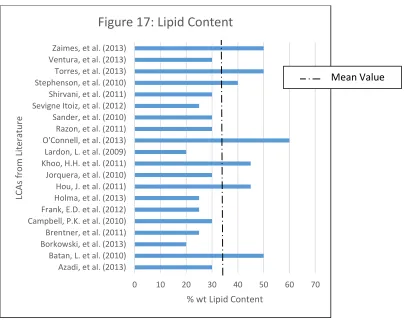
Figure 17: Lipid Content ... 54
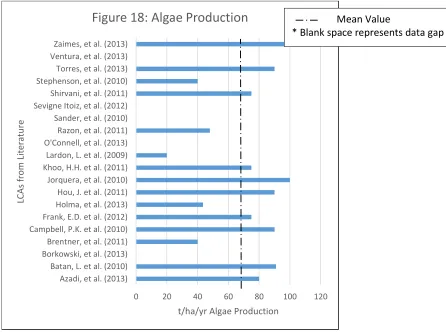
Figure 18: Algae Production ... 55
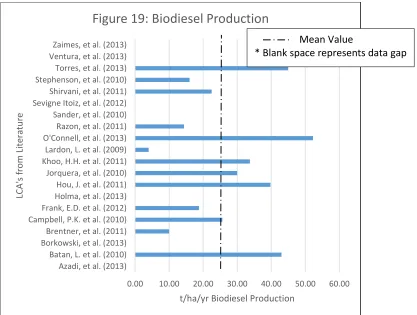
Figure 19: Biodiesel Production ... 56
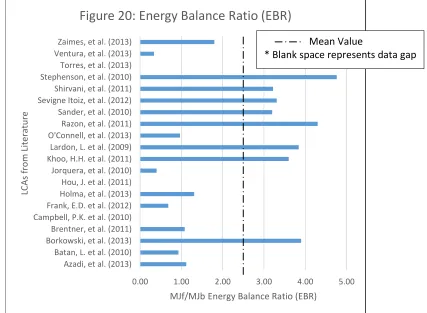
Figure 20: Energy Balance Ratio ... 57
Figure 21: Global Warming Potential (GWP) ... 58
Figure 22: Process Flowchart for Default Case ... 68
Figure 23: GaBi Default LCA Framework Flowchart ... 74
Figure 24 Case #1 Base Case Scenario Framework ... 77
Figure 25 Case #1 Best Case Scenario Flowchart ... 79
Figure 26 Case #1 Global Warming Potential ... 81
Figure 27 Case #1 Cumulative Energy Demand ... 81
Figure 28 Case #1 Energy Balance Ratio ... 82
Figure 29 Case #1 Lipid Content ... 82
Figure 30 Case #2 Flowchart ... 85
Figure 31 Case #2 Global Warming Potential ... 87
Figure 32 Case #2 Cumulative Energy Demand ... 87
Figure 33 Case #2 Energy Balance Ratio ... 88
xii
LIST OF APPENDICES
Appendix A: Case Study #1 for LCA Framework Testing……….……….92
Appendix B: Case Study #2 for LCA Framework Testing………...………..….…….93
Appendix C: Gabi Data for Case Study #1 ……….……….……94
Appendix D: Gabi Data for Case Study #2………..………..……….….98
xiii
LIST OF ABBREVIATIONS
CED – Cumulative Energy Demand
CML – Universitiet Leiden Institute of Environmental Sciences
EBR – Energy Balance Ratio
GDP – Gross Domestic Product
GHG – Green House Gas
GMO – Genetically Modified Organism
GWP – Global Warming Potential
LCA – Life Cycle Analysis
LCIA – Life Cycle Inventory Analysis
LHV – Lower Heating Value
WTT – Well to Tank
xiv
LIST OF NOMENCLATURE
% wt – percent weight
g e-CO2 – equivalent grams of carbon dioxide
GJ – giga joules
ha – hectare
kg – kilogram
L – litre
mg – milligrams
MJ – mega joules
MJb – mega joules embedded in biodiesel
MJeq – mega joules equivalent
MJf – mega joules from fuel sources
t - tonne
1
1.0 INTRODUCTION
In this research, a life cycle analysis (LCA) framework is developed for the microalgae
biodiesel industry. Biodiesel produced from microalgae has the potential to replace crude
oil diesel based on the land use and production potential (Singh and Gu (2010)). Seed oil
biodiesel and waste oil biodiesel are not currently feasible (Norgueira (2011)). Microalgae
can be cultivated on non-arable land, clean wastewater, clean factory emissions, and
produce fuel and other useful by-products in the process. However, there are a variety of
design configurations for the microalgae biodiesel production (Chen et al. (2010)), and not
all variations produce the same benefits or impacts. Furthermore, life cycle assessments
undertaken to date have used widely varying parameters in their protocol, resulting in
outcomes that cannot be readily compared to one another. The industry would benefit
significantly from having a life cycle analysis (LCA) framework that could contrast and
compare the configurations against one another based on common and transparent
parameters. The comparisons could be used for research, evaluative, and investment
purposes.
The preferred microalgae diesel production configuration depends on local conditions and
may not be suited for a different location. The location dictates the climate, nutrient
availability, and microalgae survival available for microalgae biodiesel production (Hou,
J. et al. (2011)). The different outcomes at different locations add to the complexity in
configuration design: there is no one-size-fits-all design answer for the microalgae
biodiesel industry. An LCA framework compares configurations, and accounts also for
variations due to local conditions. Furthermore, multiple scenarios can be tested using the
LCA framework.
In summary, life cycle analysis (LCA) is a tool used to evaluate and compare a product or
service over its life from cradle to grave (Curran et al. (2006)) and is commonly used to
evaluate the environmental benefits and impacts presented by an alternative. An LCA
typically defines functional units, which are the common units used throughout the LCA
to represent a meaningful unit flowing through the processes, and thus establish a measure
2
Current LCAs for microalgae biodiesel production are not easily consolidated or compared.
Furthermore, there are currently no benchmarks for the microalgae biodiesel industry:
without them, it is difficult to analyze the outcomes from LCAs. A configuration design
can be misrepresented as exceptionally good when compared to a worst-case scenario.
Instead, a benchmark would be common between all LCAs within the industry, and would
reduce the ambiguity behind how to interpret individual LCA results.
Microalgae has the potential for large-scale utilization, and there are numerous businesses
worldwide bringing the technology to market. The industry is rapidly developing, and
needs an LCA tool that can keep pace with the rapid developments. For an analysis tool
to be useful, it needs to produce meaningful insights for decision makers. Whether the
3
2.0 OBJECTIVES
There are five research objectives:
The first objective is to create an LCA framework for the microalgae biodiesel
production industry. The LCA framework is to be used by LCA practitioners in
executing an LCA on a particular configuration design for microalgae biodiesel production.
The second thesis objective is to assess and prioritize the best practices and trends
within the industry. The industry trends identify what is currently working for full scale
operations and within the marketplace.
The third thesis objective is to analyze data quality, data reliability, and data gaps. An
LCA interpretation can be vastly impacted by unreliable data as the outcomes can point in
different directions.
The fourth thesis objective is to rectify discrepancies between LCAs currently
available. Current LCAs provide rich information for the microalgae biodiesel industry,
especially if the discrepancies were rectified.
The fifth thesis objective is to develop a benchmarking system for the industry. An
industry benchmark is needed for the microalgae biodiesel industry for greater
transparency.
In summary, this thesis seeks to answer the following:
Can an LCA framework be created to analyze multiple configurations of the same
technology and meaningfully compare one to another?
Can the integrity of the analyzing process be maintained where the analysis has
value for the industry?
4
3.0 LITERATURE REVIEW
3.1 Potential for Microalgae Biodiesel Production
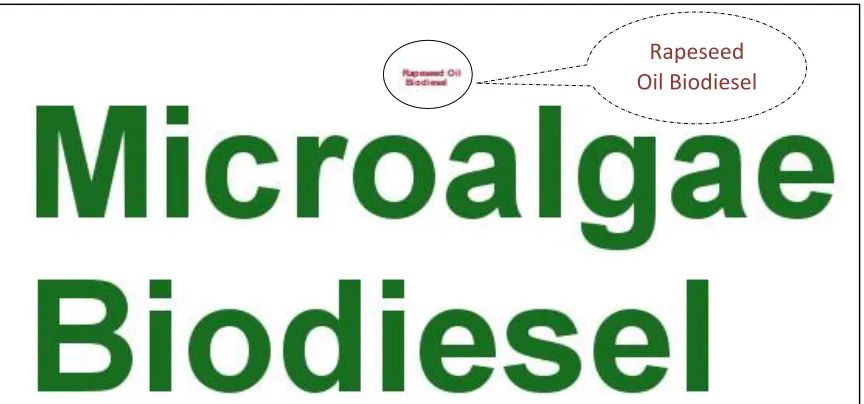
A current estimate states that microalgae could produce 136,900L/hectare of biodiesel
compared to 1,190 L/hectare for biodiesel produced from rapeseed oil (Singh and Gu.
(2010)). Also, compared to soybean, corn, sugarcane, and rapeseed feedstocks, the land
could be uncultivable: there is no land use competition for food production from
agri-business. Figure 1 below uses the relative text size of the terms to graphically depict the
production potential of microalgae biodiesel as compared to rapeseed oil biodiesel based
on literature estimates.
Figure 1: Comparison between Rapeseed Oil and Microalgae Biodiesel
The costs for current biodiesel processing from microalgae are too high even for
large-scale production (Chen et al. (2010)). However, the trend of cost reductions coupled with
a rise in the cost of a barrel of crude oil from the rapid decline in oil reserves leads to
increased interest in the microalgae industry (Singh and Gu. (2010)). However, there are
still other cost reductions needed in the areas of nutrient supply, algae separation, and oil
extraction to make biodiesel from algae competitive (Chen et al. (2010)).
Value added by-products from algae-biodiesel production have the potential to further
reduce the production costs. The by-products vary widely, and include animal feed,
plastics, pharmaceuticals, and fertilizer (Singh and Gu. (2010)).
5
3.2 Microalgae Biodiesel Production Process
The current research surrounding microalgae biodiesel production investigates whether it
is feasible to produce biodiesel from microalgae using various approaches. The various
production configurations consist of the basic life stages shown in Figure 2 below.
CULTIVATION HARVESTING EXTRACTION SYNTHESIS
PHASE PHASE PHASE PHASE
Figure 2: Life stages for biodiesel production from microalgae
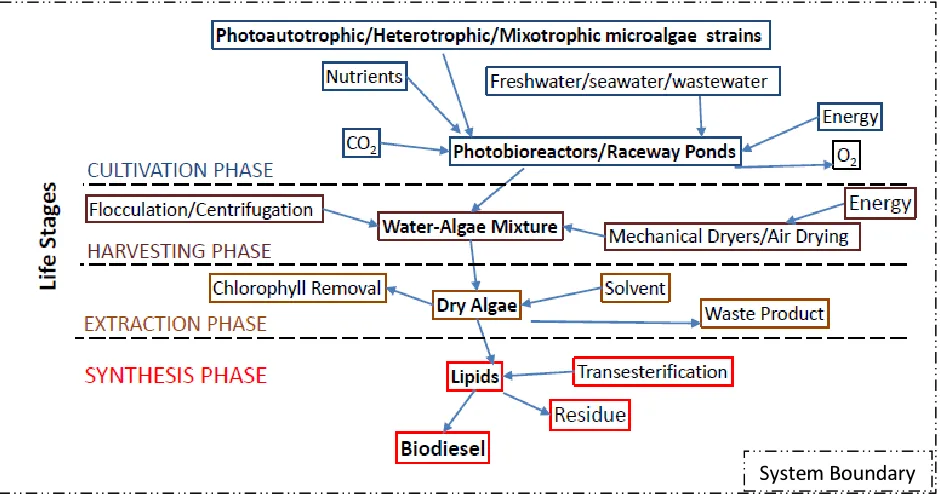
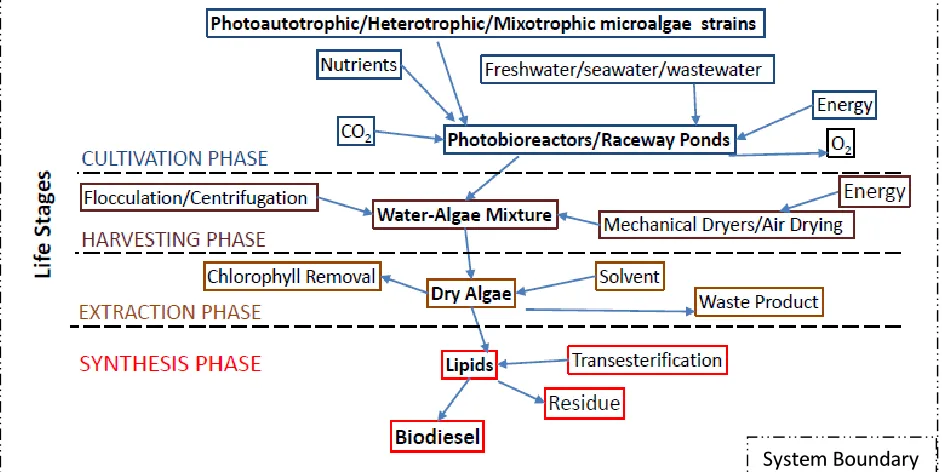
An expanded life stages diagram is shown in Figure 3 below. Each life stage is broken into
individual sections for greater clarity.
Figure 3: Expanded Life Stages Diagram
The following sections will describe in greater depth each life stage, the corresponding
technologies developed for design optimization, and opportunities for innovation.
6 3.2.1 Life Stages: Cultivation Phase
The cultivation phase is associated with the production of lipids and algae growth. The
variables within the cultivation phase for configurations consist of cultivation site,
microalgae strain, growth mode, carbon dioxide source, nutrient source, and water source.
The cultivation phase has the most diverse design options available, and the resulting
production capacities vary considerably.
Figure 4: Cultivation Phase Diagram
The cultivation site designs are currently either raceways or photobioreactors (Gong and
Jiang. (2011)). The cultivation site design depends on local conditions such as light
intensity, climate conditions, available land, water availability, and surrounding industry.
Raceways are open shallow ponds where a paddle churns the microalgae-water mixture,
and the mixture is exposed to the light and air. Raceways are inexpensive to build and
operate, but they are susceptible to microalgae failure from contaminants (Gong and Jiang.
(2011)). The shallow ponds are lined with a substrate material to prevent leaking, and
require maintenance occasionally.
Figure 5: Raceway Ponds
Microalgae
7
Photobioreactors are enclosed structures where the optimal conditions for microalgae
monoculture, necessary nutrients, CO2, etcetera are maintained. Photobioreactors can
maintain a monoculture, and can produce more biodiesel per hectare compared with
raceways (Gong and Jiang. (2011)). Photobioreactors present more opportunities for
alternative designs: currently, photobioreactors can be designed as tubes, bags, floating
panels, and thin film membranes, in vertical or horizontal orientation.
Figure 6: Photobioreactors
The lipid production is impacted from the chosen microalgae strain. There are three growth
modes microalgae can undertake. Photoautotrophic microalgae undergo photosynthesis
and affix CO2 in the process. Heterotrophic microalgae grow in the absence of light, and
can produce lipids 24 hours a day. The third alternative is mixotrophic microalgae which
have similar properties as photoautotrophic and heterotrophic microalgae (Chen et al.
(2010)). There are benefits and trade-offs for using each type of microalgae. Based on
Xiong et al. (2008), the microalgae which produce the most lipids in the shortest amount
of time is Chlorella protothecoides which produce 1209.6 – 3701.1 mg/L/day (Xiong et al.
(2008)). Research is also being conducted in the area of genetically engineering
microalgae to optimize lipid accumulation (Wu et al. (2010)).
Microalgae need nutrients and water to produce lipids. There are a variety of combinations
currently being investigated. Using commercial fertilizer and freshwater is the most
expensive option, which would greatly hamper the economic feasibility ((Jiang et al. Photobioreactor
Tubes
8
(2011)). Instead, using wastewater would supply water, carbon, and nitrogen to the
microalgae and only phosphates would need to be supplemented (Jiang et al. (2011)). Also,
seawater can be used as a water source or in combination with wastewater ((Wu et al.
(2010)). In addition, instead of municipal wastewater, animal and farm runoff can be used
as a nutrient source (Johnson and Wen (2010)).
There are numerous configurations possible within the cultivation phase. The cultivation
phase has the greatest diversity among the life stages, but current LCAs do not account for
all of the major configurations. An LCA framework could therefore contrast one
configuration with another, or one configuration’s LCA against another. Furthermore,
benchmarking would allow decision makers to assess the merits of one configuration
against another using more relevant, current criteria, becausebenchmarking can establish
an anchor for comparison.
3.2.2 Life Stages: Harvesting Phase
Removing algae from the water during harvesting can be costly and time consuming.
Usually, the algae is separated from the water and then dried in preparation for the
extraction phase (Sathish. et al. (2012)). Two processes used to separate the algae are
centrifugation and flocculation.
Figure 7: Harvesting Phase Diagram
Centrifugation consists of rapidly spinning the algae-water mixture and the algae clumps
together and separates from the water. High shear forces due to high centrifugation speed
may cause damage to the algal cell walls (Chen et al. (2010)). Centrifugation is shown to
be the preferred method for small scale harvesting, but it too costly and slow for large batch
9
Flocculation occurs when smaller particles disperse and clump together to create larger
particles of algae which would float to the surface for gathering (Chen et al. (2010)).
Autoflocculation is the result of a high pH solution where the carbonate salts and algae will
precipitate. Autoflocculation can be simulated by adding salts to increase the pH level
(Chen et al. (2010)).
The next step in harvesting the algae is drying. The two techniques employed are solar
dryers and mechanical dryers. Air drying is the most cost effective in terms of energy
intensity, but the process takes a long time to complete (Sathish et al. (2012)). The drying
step may soon be unnecessary as wet extraction techniques are currently being developed.
The harvesting phase can be disrupted by the development of wet extraction techniques,
resulting in a net savings of time, energy, and cost. More research on wet extraction
techniques from an LCA perspective could identify projected savings and increase interest
in full scale implementation.
3.2.3 Life Stages: Extraction Phase
The extraction from dried algae is accomplished through processes such as solvent
extraction, and direct transesterification (Sathish et al. (2012)). Super-critical fluid
extraction is another method used to extract oil, but it considered too costly to effectively
be used.
Figure 8: Extraction Phase Diagram
The solvent extraction can be accomplished using hexane. The microalga needs to be dried
before the addition of hexane (Halim et al. (2010)). The mixture is agitated until separation
of the lipid layer on top and non-lipid layer on the bottom occurs (Halim et al. (2010)).
Currently, research is being conducted on extracting lipids from wet algae. (Sathish et al.
(2012)) Extracting directly from wet algae would eliminate the drying step and would
10
Chlorophyll contamination can reduce the quality of biodiesel production and needs to be
removed (Sathish et al. (2012)). Chlorophyll and other contaminants need to be removed
before synthesis.
There is potential within the extraction phase to improve the economic feasibility and
competitiveness from new extraction techniques.
3.2.4 Life Stages: Synthesis Phase
Synthesis is the final step where the lipids are converted into biodiesel. The lipids undergo
a process called transesterification. Either the oils are extracted first from dried algae, or
can be synthesized using ‘in-situ’ transesterification (Ehimen et al. (2009)).
Figure 9: Synthesis Phase Diagram
The process requires a catalyst to link the Fatty Acid Methyl-Ester (FAME) chains
producing biodiesel. Methanol is typically used, but it is not the only catalyst used in the
industry (Ehimen et al. (2009)). The process needs to be carefully designed and monitored
to prevent saponification.
Another method is the supercritical transesterification, which requires high reaction
temperatures and pressures without catalysts. There are safety concerns regarding
supercritical transesterification due to the high temperatures and pressures (Ehimen et al.
(2009)).
‘In-situ’ transesterification has the potential to reduce the time and cost requirements for
biodiesel synthesis (Ehimen et al. (2009)). The process would eliminate the drying and
extraction phases, and is therefore attractive for further research.
Another option, instead of synthesizing the biodiesel onsite, is the extracted lipids could be
11
established infrastructure, machinery, and distribution systems. Also, other fuels and
by-products can be synthesized from established techniques.
3.3 Microalgae Biodiesel Lower Heating Value (LHV)
Table 1 below compares the Lower Heating Value for diesel, gasoline, ethanol and
biodiesel.
The two biodiesel ratings represent values found in literature, and are also commonly used
for LCAs conducted to date. Therefore, the range in expected LHV is 37-42 MJ/kg
biodiesel.
3.4 Potential By-Products
The materials left over from the extraction phase and synthesis phase can be used in other
products and industries. Converting the waste materials into by-products will create value
added products which further increase the feasibility for creating biodiesel from
microalgae. Current by-products under investigation are plastics, animal feed, and
pharmaceuticals.
Plastics can be created using the starchy materials remaining after lipid extraction. The
starches would have to be separated from the proteins first, and then can be easily converted
into plastics using already established methods (Singh and Gu (2010)).
Animal feed is a high demand by-product, and the remaining materials would be high in
proteins and carbohydrates (Harun et al. (2009)). The animal feed would need to meet
certain regulations as established by the agri-business.
Table 1: Fuel Lower Heating Values
Fuel Type
LHV
(MJ/kg) Density (g/gal) Source
Low-Sulfur Diesel 42.612 3206 GREET (2010)
Conventional Gasoline 43.448 2819 GREET (2010)
Ethanol 26.952 2988 GREET (2010)
Methyl-Ester (Biodiesel) 37.528 3361 GREET (2010)
12
Pharmaceuticals have been created from microalgae before microalgae were considered as
a fuel feedstock. The quality of the residual materials would need to be monitored and
maintained if pharmaceuticals are to be manufactured from the waste materials derived
from producing biodiesel from microalgae (Harun et al. (2009)).
The remaining materials could also be converted into biogas and burned to produce
electricity (Singh and Gu (2010)). The energy produced can then be used onsite or sold to
the grid to offset electricity costs.
An analysis would need to be conducted to see which industry would generate the greatest
profitability for the remaining materials.
3.5 Trade-offs Associated with Microalgae Biodiesel
There are offs for producing biodiesel from microalgae. The greatest known
trade-offs result from the cultivation phase and biodegradation prevention.
The accidental release of genetically modified microalgae is a potential threat to local
ecosystems. The genetically modified microalgae could potentially dominate a local
ecosystem similar to how invasive species have been shown to do. Microalgae is found in
the wild, which is different than other GMO products within agriculture. Corn is highly
domesticated and cannot grow without cultivation, while microalgae is not domesticated
and grows without aid.
Utilizing waste water as a water and nutrient source can improve the economic feasibility
of microalgae biodiesel. The trade-offs for using waste water may be associated with the
residual chemicals in the final fuel. The quality and reliability of the wastewater may be
difficult to control. More research is needed to assess the affects waste water has on the
final fuel.
Biodiesel degrades quickly compared to traditional diesel. The addition of pesticides to
the final fuel has been shown to increase the shelf life of biodiesel. The trade-off is the
potential environmental impacts associated with burning the additional pesticides. An
emissions analysis needs to be conducted on the fuel with added pesticides.
13
3.6 Bioengineering Microalgae
Genetic modification techniques are currently being applied to microalgae for biodiesel
production. The goals typical in bioengineering microalgae is to increase yield and lipid
content, increase growth rate, and decrease crop failure.
One technique used to increase the lipid content in microalgae is by increasing
photosynthetic efficiency. This is accomplished by modifying the strain to increase the
photosynthetic receptors’ size within the cells. The receptors are like miniature umbrellas which capture the sunlight. Increasing the “umbrella” size will increase the photosynthetic
uptake and efficiency (Flynn et al. (2009)).
A trade-off associated with genetically modifying microalgae is accidental release into the
wild. Microalgae is an opportunistic wild organism which currently grows unaided. There
are numerous strains of microalgae found in the wild, and a bioengineered microalgae
could reduce the biodiversity by crowding out the other strains.
A biosecurity risk assessment was conducted by Campbell (2011) for Australia for
importing microalgae strands for biodiesel production. The risk to local biodiversity by
importing opportunistic species is high, and a protocol was proposed for assessing which
imports to allow and which to reject. A similar protocol needs to be established for
bioengineered microalgae based on regional conditions.
3.7 The Bioethanol Industry: Review
The bioethanol industry has been established for longer than the biodiesel industry. The
bioethanol industry has gone through the preliminary stages of development, and has
overcome obstacles inherent in the process. The microalgae biodiesel industry can leapfrog
over certain obstacles by learning from the bioethanol industry. The following section will
review the bioethanol industry for Brazil, United States, and Canada.
3.7.1 Brazil
The following review for Brazil’s bioethanol industry is based on a journal article by Azadi
et al (2012). The information reflects their research, but may not depict the entire industry
14
technologies are developed and implemented. This discussion, however, can inform the
biodiesel industry to avoid certain pitfalls.
Brazil is the largest producer of bioethanol in the world. Brazil produces approximately
32.5 billion litres of ethanol from sugarcane per year. 90% of all ethanol produced is
consumed in Brazil, while 6% of production was exported to the US (Azadi et al (2012)).
There is high political drive for ethanol production in Brazil. Large corporations like BP
have invested approximately a billion dollars on ethanol research with particular emphasis
on Brazil.
Sugarcane is a labour intensive crop, and the bioethanol industry currently employs
approximately 1 million people in Brazil. The bio-ethanol industry comprises 3.5% of the
GDP for the country. The labour conditions in the bio-ethanol industry in Brazil are
considered “forced labour” and are similar to slave labour. There are organizations trying
to mitigate the labour conditions in Brazil (Azadi et al (2012)).
Sugarcane fields are traditionally burned for harvesting, which results in pollution to the
air, water, and soil. Also, the labourers working the fields are at risk of breathing in the
particulates from the burnt fields.
Also, using food crops to produce biofuels has been linked to food price increases and
shortages. Brazil had a devastating food shortage in 2008, while land that could have been
used for food crops or cattle were taken by biofuels.
Sugarcane fields currently compose 2.5% of arable land in Brazil. The land needs to be
near water, and is not shown to be located near the Amazon rainforest. There is debate
surrounding whether biofuel production is linked to deforestation, but the results are
inconclusive (Azadi et al (2012)).
3.7.2 United States
The United States is the second largest producer of bioethanol behind Brazil. The main
15
Using corn as a feedstock to the fuel industry has been linked to rising food prices as it is
competing with the food market. Even if there is enough land for corn to be cultivated,
having more than one industry interested in corn crops increases the prices at market.
There is federal pressure to increase bioethanol production to replace 25% of gasoline.
Corn as a feedstock is supposed to be replaced with 2nd generation feedstocks in the near
future, but there is a bottleneck with the technology to convert lignocellulosic feedstock
into a quality fuel (Akinci et al. (2008)).
3.7.3 Canada
The majority of bio-ethanol produced in Canada is from corn. Any benefits from
converting corn into ethanol can be cancelled from the cultivation phase of production
(Champagne. (2006)).
The quality of the feedstock determines the quality of the ethanol produced. Hard
lignocellulose materials need to first be broken down using enzymes for efficient release
of the sugars within for fermentation.
Biosolids from manure, municipal wastewater, and industrial wastewater are not quality
feedstocks for ethanol production. The biosolids consists of protein which is more
challenging to convert to ethanol compared with other lignocellulosic materials. The
quality of the ethanol produced is compromised (Champagne. (2006)).
The industry in Canada is comprised mainly of small scale plants. Feasibility is limited
based on costs in converting waste materials into ethanol due to the low yield and high cost
for the hydrolysis process.
If all agricultural waste products in Canada combined were used for ethanol production it
would replace 18-27% of the fossil fuel demand in Canada. Using available crop residues
not currently used as soil remediation and animal bedding would replace 3.7% of the fossil
fuel demand in Canada (Champagne. (2006)).
The Canadian government currently requires 2.5% of the total gasoline use in Canada to
16
3.8 Lessons Learned from the Bioethanol Industry
The microalgae biodiesel industry can learn from the bioethanol industry by looking at
their previous successes and failures. Caution is needed in applying the lessons directly as
the industries have significant differences.
Government regulations and incentives helped catapult the bioethanol industry into a viable
business option. The incentives and labor conditions for producing bioethanol in Brazil
results in competitive price points. The microalgae biodiesel industry is cost intensive in
technology and not labor intensive compared to the bioethanol industry in Brazil.
Biodiesel from microalgae does not compete directly with resources used to grow food
crops, and can be marketed in those terms. The controversy of rising food prices created a
blithe over the bioethanol industry and has slowed down its progression.
Quality standards for microalgae biodiesel should be established and each product meeting
the criteria should be shown upfront. The LHV of biodiesel is lower than crude oil diesel
and should be stated with the product so a true energy comparison can be made. The LHV
varies for different biodiesel blends.
3.9 Life Cycle Analysis: Review
A life cycle analysis (LCA) is a tool used to evaluate a product or service over its life from
cradle to grave. An LCA is used in decision making by designers, executives, government
regulatory officials, and academics. Typical metrics used are associated with economics,
energy, air, water and land emissions with particular emphasis on greenhouse gases,
eutrophication, acidic depletion potential, and human toxicity. An LCA uses a functional
unit particular to the product or service under investigation. There are system boundaries
defined to show which flows are being accounted for, and where the process starts and
ends. The outcomes from the LCA are evaluated against previous designs or other designs.
An LCA framework is used to evaluate different configurations within the same industry
which perform the same function or produce equivalent products. An LCA framework
would assess each configuration with the same functional units, and would define how the
data would be collected and analyzed. The LCA framework streamlines the LCA process
17
consistent roadmap for users and reduce the data gaps and uncertainty surrounding
individual LCA practitioners generating distinct flowcharts, boundaries, functional units,
and metrics. The LCA framework allows LCA practitioners to focus on higher level
analysis since the basic structure is already developed.
3.10 Life Cycle Analysis: Benchmarking
Benchmarks are established agreed upon values used for comparison within a particular
industry. Benchmarks can be basic expectations for outcomes from a particular process.
If an LCA were conducted, and the results are below the benchmark value for a benefit
and/or above for a system cost the process would be considered poor. Without a
benchmark, there would not be a transparent, explicit measure to base the merits of a
process. A poor system design could hide behind their outputs by creating their own low
baseline benchmark. An industry accepted benchmark would help to eliminate false
representations and improve the LCA quality and credibility for a particular industry.
3.11 LCA Framework
This LCA framework is a template for LCA practitioners to use to develop an LCA for a
particular industry. The LCA framework is specific to this industry, and is defined to give
relevant information to the LCA practitioner. It acts as a structure to reduce LCA
processing time, while also striving to improve reliability and quality of an LCA. The LCA
framework is intended to be a guide which describes the control points and best practices
for LCAs within this industry.
3.12 LCA Model Software: GREET
Argonne Laboratories has developed an LCA model for algal biofuels pathways for their
program GREET (Frank et al. (2011)). The model describes one particular pathway with
variances only within the sensitivity analysis. The model does not allow variability in
configuration design.
There are several gaps within the model that can be investigated. First, photobioreactors
are not considered within the model. Only raceway ponds are considered based on large
scale facilities in place as of the model development (Frank et al. (2011)). There is
18
Another gap within the GREET model is it only considers photoautotrophic growth mode.
Heterotrophic and mixotrophic growth modes are not considered (Frank et al. (2011)).
Research into all three growth modes is currently underway.
Also, the model only determines the microalgae nutrient supply from fertilizers. The
fertilizer data is taken from previous investigations for seed oil biodiesel (Frank et al.
(2011)).
There are fixed parameters given for the microalgae strain, which would mean only one
strain of microalgae is considered (Frank et al. (2011)). There are numerous microalgae
strains being identified as potential biodiesel feedstock. Also, genetic engineering
techniques are being applied to microalgae to increase the lipid production (Tabatabaei et
al. (2010)).
Another gap within the model is its exclusion of wastewater. The water source within the
model is freshwater (Frank et al. (2011)). Using freshwater in the model can greatly skew
the end results away from determining if microalgae were sustainable. Seawater and
wastewater have been shown to work as a water source for microalgae production. Also,
the wastewater would supply nutrients to the microalgae (Pittman et al. (2010)).
Finally, the model assumes the conversion facility from lipids to biodiesel is 600mi away
and would require transportation. The figure was chosen based on transportation distance
from the production of soybean oil biodiesel and not from algae facilities (Frank et al.
(2011)).
The model could be used as a framework, but if additional LCAs were built from the model,
the inherent flaws of the model would be perpetuated. Also, without defining what the
functional units would be for the LCAs extrapolated from the model, one could not
compare and contrast the results.
3.13 Current Commercial Operations
There are multiple microalgae biodiesel production facilities in North America. Table 2
19
Table 2: Microalgae Biodiesel Production Companies
Company Description Challenges/Differences
Algenol Biofuels1
2,300 algae strains
Flexible plastic film photobioreactor No harvest no kill strategy to
produce ethanol
Ethanol and water evaporate and is collected once it condenses from the sides
How to compare ethanol and diesel production from microalgae?
Solix Biofuels2
Develops algae growth systems for the algae industry
The demonstration plant uses waste water generated during coal bed methane production
Floating photobioreactor panel Integrated cleaning system
How to assess the microalgae contaminants from the coal waste water?
Sapphire Energy3
Power generation/factory emissions are inserted into opens ponds with algae and non-potable water The algae is harvested and the oil
extracted
The oil is then refined at a traditional refinery
How to assess the microalgae contaminants from factory emissions?
How to assess the contaminants in final oil refined offsite?
Solazyme4
Heterotrophic microalgae strains Flexible input such as sugarcane,
corn and stover, miscanthus, switchgrass, forest residue, waste streams
Uses standard industrial fermentation equipment
How would the oil yield be impacted by the flexible input?
20
Looking to sell oil directly to refiners to access their distribution infrastructure
Heliae5
Different strains for different applications
Open to fully closed photobioreactors
Solvent extraction process
Harvesting and dewatering selected based on needs including
centrifugation, membrane filtration, flocculation, and additional solids separation technology
What configuration do you choose based on local conditions given the configuration complexity?
Synthetic Genomics6
Genetically modified strains available for licensing
What are the impacts of using genetically modified strains?
What are the unintended outcomes in the event of a mishap?
Algae Systems7
Floating offshore growth systems Municipal wastewater
Factory emissions non-GMO algae
Algae harvested, and the biomass is converted into biodiesel.
How to assess the microalgae contaminants from municipal wastewater and factory emissions?
How would pharmaceuticals from the municipal
wastewater impact the final product?
Pond Biofuels (Canada)8
Converts raw smokestack emissions from heavy industry into algae biomass (St. Mary's cement kiln) Strains chosen based on southern Ontario environmental conditions Enclosed reactors
21
Harvested biomass is processed using mechanical, drying, and chemicals steps to yield the final biofuel
Cellana9
Algae grown in photobioreactors and open ponds
Algae strains taken locally in Hawaii.
Algae are concentrated by
gravitation, excess water removed, and then dried
What impacts to the configuration design are associated with the local conditions?
Aquatic Energy10
Open pond farm in Louisiana using a proprietary strain of algae
The algal oil is promoted as a "drop-in" feedstock for existing energy infrastructure
What impact would the genetically engineered algae have on the local biosphere?
Inventure11
Developed a Direct Extraction Technology to convert algae directly into biodiesel without extracting the oil first
How would the technology deal with impurities from using waste streams as system inputs?
1 Algenol Biofuels. (2011). In Direct to Ethanol Technology. Retrieved August 7, 2012.
www.algenolbiofuels.com/direct-to-ethanol/direct-to-ethanol.
2 Solix. (2011). In Our Products. Retrieved August 7, 2012. www.solixbiofuels.com/content/products.
3 Sapphire Energy. (2012). Sapphire Energy. In What is Green Crude. Retrieved August 7, 2012.
www.sapphireenergy.com/green-crude/.
4 Solazyme. (2012). In Biotechnology that Creates Renewable Oils from Microalgae. Retrieved August 7, 2012.
www.solazyme.com/technology.
5 Heliae. (2012). In Algae Production Systems. Retrieved August 7, 2012. www.heliae.com/technology/?page=algae-production.
6 Synthetic Genomics. (2012). In Products. Retrieved August 7, 2012. www.syntheticgenomics.com/products/.
7 Algae Systems. (2011). In Our Platform. Retrieved August 7, 2012. www.algaesystems.com/technology/integrated-platform/.
8 Pond Biofuels. (2011). In Technology. Retrieved August 7, 2012. www.pondbiofuels.com/Technology/Technology.html.
9). Cellana (2012). In Technology Alduo Patented Hybrid Hybrid Algae Production System. Retrieved August 7, 2012.
www.cellana.com/our-technology/.
10 Aquatic Energy. (2010). In Algae Technology Algae: The Super Organism. Retrieved August 7, 2012.
www.aquaticenergy.com/algae-the-super-organism.
11 Inventure. (2010). In Direct Extraction Technology. Retrieved August 7, 2012.
22
Each company approaches biodiesel production from microalgae differently. The
downsides of poor comparisons are:
Incompatible units, such as mass/time compared with mass/area/time Boundary conditions are different, therefore results are not comparable False positive or negative design decisions
No meaningful insights
Comparing and contrasting one company to another could be facilitated using a
well-structured LCA framework. The LCA framework would offset the downsides of poor
comparisons by defining the starting point and set-up for LCAs developed from the
framework.
3.14 GaBi LCA Software
PE International developed GaBi, an LCA implementation software, for LCA practitioners.
GaBi uses common internationally recognized databases and engineering metrics to
evaluate a product or service as defined by the LCA practitioner (PE International. (2013)).
GaBi was developed to support business applications for life cycle assessment, life cycle
costing, life cycle reporting, and life cycle working environment. GaBi models every
element from a life cycle perspective, and looks at the impacts from alternative
manufacturing, energy sources, distribution, recyclability, and sustainability. GaBi helps
protect brands to deliver more sustainable products to better meet customer expectations.
The LCA tool can also be used to give feedback to customers about sustainability for a
product or service (PE International. (2013)).
GaBi uses a flowchart method and can be readily used for developing an LCA framework.
Once the framework is developed using GaBi, the flowchart can be adapted for other
configurations, locations, and other parameters.
3.15 LCAs Currently Available
There are numerous LCAs available within the literature which evaluate one or two forms
of microalgae production or compare microalgae biodiesel to seed oil biodiesel, jatropha
23
The issue with current LCA studies is they are not comparable from one LCA to the next.
There are no common functional units, and what is measured is measured differently from
one LCA to the next. Therefore, the conclusions made cannot be directly compared. Table
3 on the following page reviews 7 example LCAs conducted on microalgae biodiesel
production.
Table 3: Example LCAs for Microalgae Biodiesel Production
LCA Description Problems/Issues
Batan et al. (2010)
Based on GREET model Photobioreactor
Nanochloropsis microalgae Centrifugation harvesting Extraction process based on
soybeans
Transesterification synthesis Functional units based on total
GHG emissions.
Problem A: The errors in the GREET model are carried over into the LCA.
Frank et al. (2012)
Based on GREET model Open ponds
Bio-flocculation harvesting Hexane extraction
Anaerobic digestion
Biogas conversion to electricity Functional units based on total
GHG emissions.
Same as problem A
Hou et al. (2011).
Basic LCA methodology supplemented with Gabi 4.3 System design for microalgae
biodiesel is not defined
24
Functional units based on abiotic depletion potential (ADP), global warming potential (GWP), and ozone depletion potential (ODP).
Yang et al. (2010).
Basic LCA methodology Open pond, freshwater, and
fertilizer
Harvested and dried
Extraction and synthesis based on soybean
Functional units based on freshwater usage in kg/kg biodiesel, and nutrient usage in kg/kg biodiesel.
Problem C: Basic
configuration, but does not represent industry.
Lardon et al. (2009).
LCA study of a virtual facility Open pond
Centrifugation harvesting Hexane extraction
Transesterification synthesis Functional units based on global
warming potential (GWP), Ozone, Eutro, AbD, Acid, Human Tox, Marine Tox, Land, Rad, and Photo.
Same as problem C
Campbell et al. (2010).
LCA study of a system designed for Australian conditions Open pond, CO2 from power
station or ammonia plant, fertilizer, and seawater from nearby coast
25
Harvested using diesel tractor after chemical flocculation Transesterified using methanol Functional units based on GHG
emissions and cost.
Khoo et al. (2011).
Hypothetical LCA for Singapore Photobioreactor and raceway
ponds
Harvested and dried
Lipids are extracted and filtered Transesterification synthesis Functional units based on MJ
energy demand/MJ biodiesel, and life cycle CO2 in kg/MJ
biodiesel.
Same as problem D
In summary, the LCA framework would rectify discrepancies in LCAs, and bring order to
the chaotic mix of LCAs currently available. The uniform LCA base approach would
assess the most sustainable technology and benchmarking. The benefits of comparison
between LCAs are:
Contrast economic viability Uncover realistic expectations
Identify outliers for further investigation Define regulatory conditions and incentives Contrast environmental impacts
An LCA framework would further increase the ease of comparison as the LCAs would not
26
4.0 METHODOLOGY
The LCA framework is developed for rapid LCA execution by LCA practitioners using
established benchmarks, functional units, default settings, and a data acquisition rubric.
Creating a life cycle analysis (LCA) framework consists of identifying the life stages based
on current academic and industry information, conducting a data gap analysis, prioritizing
LCA focus, defining the functional units, and testing the framework using industry and
academic data.
The following list summarizes the key steps undertaken in this research:
1. Identify life stages common to all configurations
2. Identify industry trends for configuration design
3. Create word arrays visually depicting the trends for each life stage
4. Compile LCA data from literature, and convert into common units
5. Conduct a data gap analysis for data quality and data reliability using LCAs found
from literature
6. Prioritize the LCA focus
7. Define the functional units to be used across all configurations
8. Develop and define a benchmark for industry
9. Identify the process flow options for configuration design
10.Develop and define the default case for the LCA framework
11.Create a data acquisition rubric for the LCA framework
12.Recreate the LCA framework in GaBi using objects, flows, and parameters
13.Test the LCA framework in GaBi against two case studies found in Appendices A
and B
14.Compile framework in Appendix E
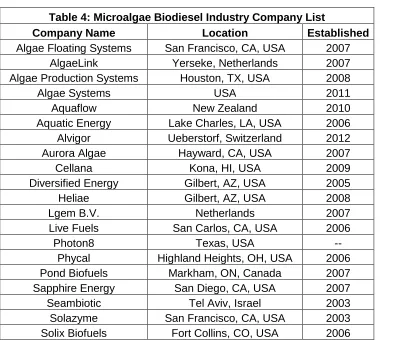
4.1 Methodology: Industry Trends
Table 4 on the following page lists the companies used for identifying industry trends,
creating word arrays, and generating the default configuration design settings. The LCA
framework uses a default case to streamline the LCA process. Basing the default case on
industry trends reflects actual industry circumstances rather than arbitrarily chosen
27
time and resources spent on creating the process flowchart. The framework should be
generically applicable, and only processes unique to the current configuration would need
to be customized.
4.1.1 Rationale for Choosing Companies
The companies chosen for inclusion in designing the LCA framework were based on the
following two criteria.
1. Each company has information posted on website for each process/life stage
2. Each company has at least a demonstration site for a complete configuration
The relevant information as described by the criteria above is used to identify industry
trends in configuration design.
Table 4: Microalgae Biodiesel Industry Company List
Company Name Location Established
Algae Floating Systems San Francisco, CA, USA 2007 AlgaeLink Yerseke, Netherlands 2007 Algae Production Systems Houston, TX, USA 2008
Algae Systems USA 2011
Aquaflow New Zealand 2010
Aquatic Energy Lake Charles, LA, USA 2006 Alvigor Ueberstorf, Switzerland 2012 Aurora Algae Hayward, CA, USA 2007
Cellana Kona, HI, USA 2009
Diversified Energy Gilbert, AZ, USA 2005
Heliae Gilbert, AZ, USA 2008
Lgem B.V. Netherlands 2007
Live Fuels San Carlos, CA, USA 2006
Photon8 Texas, USA --
Phycal Highland Heights, OH, USA 2006 Pond Biofuels Markham, ON, Canada 2007 Sapphire Energy San Diego, CA, USA 2007
Seambiotic Tel Aviv, Israel 2003
28
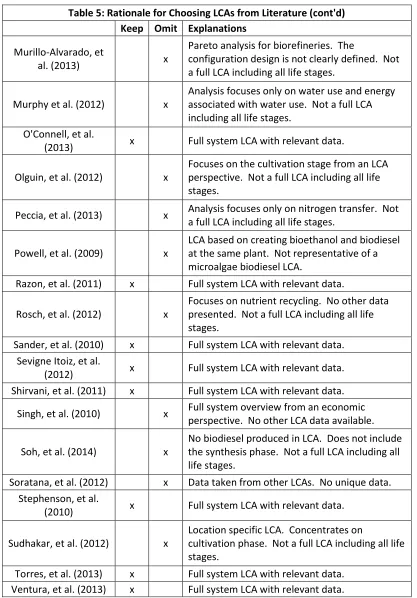
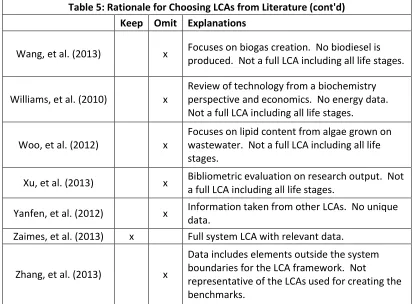
4.2 Methodology: LCAs from Literature Analysis
LCAs were taken from literature for analysis with respect to functional units, boundary
conditions, average input and output values, and benchmark creation. The methodology
for benchmark creation can be found in section 4.5. Table 5 on the following pages lists
all LCAs considered for utilization in creating the LCA framework. The LCAs were
evaluated with respect to the following criteria:
Depth of LCA as compared to the LCA framework scope
Full configuration analysis Convertible functional units
Measurements with respect to algae production, biodiesel production,
energy requirements, and emissions
Data relevant to the LCA framework scope
LCAs were eliminated by not having sufficient data or not evaluating a complete
configuration. The LCAs chosen for utilization were then compiled into a chart for
comparison. Values needing to be converted to common units were then converted. There
were issues in converting data, and data gaps were then discovered from the chosen LCAs.
Details on how the data was converted and all equations can be found in section 5.3.1. A
data gap analysis methodology can be found in section 4.3, and the results and discussions
29
Table 5: Rationale for Choosing LCAs from Literature
Keep Omit Explanations
Amin, et al. (2009) x Overview of technology and future potential. No quantifiable data.
Anthony, et al. (2013) x Review of harvesting stage. Not a full LCA including all life stages.
Azadi, et al. (2013) x Full system LCA with relevant data. Batan, et al. (2010) x Full system LCA with relevant data.
Batten, et al. (2013) x Full system overview from an economic perspective. No other LCA data available. Borkowski, et al.
(2013) x Full system LCA with relevant data.
Brentner, et al. (2011) x Full system LCA with relevant data. Campbell, et al. (2010) x Full system LCA with relevant data.
Collet, et al. (2011) x
Full LCA system with data, but it represents anaerobic digestion and no biodiesel is produced.
Frank, et al. (2012) x Full system LCA with relevant data.
Franz, et al. (2012) x
Review of variability due to algae strain and location from an LCA perspective. Not a full LCA including all life stages.
Greenwell et al.
(2013) x
Overview of technology and future potential. No quantifiable data.
Ho, et al. (2013) x
Review of variability due to algae strain from an LCA perspective. Not a full LCA including all life stages.
Holma, et al. (2013) x Full system LCA with relevant data. Hou, et al. (2011) x Full system LCA with relevant data. Jorquera, et al. (2010) x Full system LCA with relevant data. Khoo, et al. (2011) x Full system LCA with relevant data.
Lam, et al. (2012) x
CO2 balance for different algae strains. No other variables considered. Not a full LCA including all life stages.
Lardon, et al. (2009) x Full system LCA with relevant data.
Liu, et al. (2011) x
Analyzes the biodiesel yield under
photoautotrophic and heterotrophic growth modes. No data for other life stages. Not a full LCA including all life stages.
Mata, et al. (2011) x
30
Table 5: Rationale for Choosing LCAs from Literature (cont'd)
Keep Omit Explanations
Murillo-Alvarado, et
al. (2013) x
Pareto analysis for biorefineries. The
configuration design is not clearly defined. Not a full LCA including all life stages.
Murphy et al. (2012) x
Analysis focuses only on water use and energy associated with water use. Not a full LCA including all life stages.
O'Connell, et al.
(2013) x Full system LCA with relevant data.
Olguin, et al. (2012) x
Focuses on the cultivation stage from an LCA perspective. Not a full LCA including all life stages.
Peccia, et al. (2013) x Analysis focuses only on nitrogen transfer. Not a full LCA including all life stages.
Powell, et al. (2009) x
LCA based on creating bioethanol and biodiesel at the same plant. Not representative of a microalgae biodiesel LCA.
Razon, et al. (2011) x Full system LCA with relevant data.
Rosch, et al. (2012) x
Focuses on nutrient recycling. No other data presented. Not a full LCA including all life stages.
Sander, et al. (2010) x Full system LCA with relevant data. Sevigne Itoiz, et al.
(2012) x Full system LCA with relevant data.
Shirvani, et al. (2011) x Full system LCA with relevant data.
Singh, et al. (2010) x Full system overview from an economic perspective. No other LCA data available.
Soh, et al. (2014) x
No biodiesel produced in LCA. Does not include the synthesis phase. Not a full LCA including all life stages.
Soratana, et al. (2012) x Data taken from other LCAs. No unique data. Stephenson, et al.
(2010) x Full system LCA with relevant data.
Sudhakar, et al. (2012) x
Location specific LCA. Concentrates on
cultivation phase. Not a full LCA including all life stages.
31
Table 6 on the following page lists the LCAs found from literature that are utilized for
creating the benchmarks. The benchmark values are available in the LCA framework as
comparisons to then evaluate the outcomes of an individual LCA.
Table 5: Rationale for Choosing LCAs from Literature (cont'd)
Keep Omit Explanations
Wang, et al. (2013) x Focuses on biogas creation. No biodiesel is produced. Not a full LCA including all life stages.
Williams, et al. (2010) x
Review of technology from a biochemistry perspective and economics. No energy data. Not a full LCA including all life stages.
Woo, et al. (2012) x
Focuses on lipid content from algae grown on wastewater. Not a full LCA including all life stages.
Xu, et al. (2013) x Bibliometric evaluation on research output. Not a full LCA including all life stages.
Yanfen, et al. (2012) x Information taken from other LCAs. No unique data.
Zaimes, et al. (2013) x Full system LCA with relevant data.
Zhang, et al. (2013) x
Data includes elements outside the system boundaries for the LCA framework. Not