Leader Development Intervention? (Under the direction of S. Bartholomew Craig.)
The purpose of the research has been to investigate personality as a predictor of perceived performance change following a leader training program. A sample of 363 leaders attended a five day leader development training program at a centralized location. Approximately 90-120 days after returning to work in their organizations, participating leaders received a 360-degree assessment in order to assess perceived performance change. Personality was measured using the CPI260 (ref), and results were mapped onto the Five Factor model of personality. Personality was operationalized both as continuous dimensions of the Five Factor model and as categorical types. Personality types were identified via cluster analysis. Personality was further investigated as moderating the relationship between self-other rating discrepancy and perceived performance change. Results suggested that personality
dimensions and types predicted perceived performance change following a leader
by Eric G. Kail
A dissertation submitted to the Graduate Faculty of North Carolina State University
In partial fulfillment of the Requirements for the degree of
Doctor of Psychology
Psychology
Raleigh, NC March, 2007 Approved by:
________________________ S. Bartholomew Craig, Ph.D. ________________________
Mark A. Wilson, Ph.D. _________________________
Lori Foster Thompson, Ph.D. _________________________
know. She is the first and only woman I have ever loved and she inspires me to places I could not achieve on my own. Rather than pursuing her own ambitions, she continually elevates mine for the benefit of others. I love her with all my heart, mind, and soul; she is the best of each part of me.
Dr. Lori Foster Thompson and Dr. Jose Picart. I am especially indebted to Dr. Craig, who spent so many hours teaching me and editing my work. In the classroom, the field, or in a coffee shop, I could not have had a better advisor to show me the way.
And I would also like to thank three of my mentors, Thomas Kolditz, Joseph LeBoeuf and Don Snider. You are my exemplars as soldiers, scholars, and men. Your encouragement and council were invaluable to me on my doctoral journey and in the leading of soldiers.
Many thanks to the Center for Creative Leadership for the data used in this dissertation, and for all the center does for leaders and followers around the World.
LIST OF TABLES………... v
LIST OF FIGURES………. vi
1. INTRODUCTION……… 1
2. LITERATURE REVIEW 2.1 Leader Development vs Leadership Development……… 2
2.2 How Leaders Learn……… 4
2.3 Methods of Leader Development………... 8
2.4 The Leader’s Role……….. 13
2.5 Measuring Change……….. 16
2.6 Personality……….. 20
3. HYPOTHESIS AND RESEARCH QUESTIONS………... 23
4. METHOD 4.1 Participants and Procedures………... 25
4.2 Leader Development Program………... 26
5. MEASURES 5.1 Personality……….. 28
5.2 Perceived Performance Change………. 29
5.3 Performance Change Self-other Rating Discrepancy………. 32
6. ANALYSES AND RESULTS 6.1 Overall Performance Change………. 33
6.2 Personality Types………... 33
6.3 Personality Types and Performance Change……….. 37
6.4 Personality Types and Performance Change……….. 38
6.5 Moderation of Self-Other Rating Discrepancy and Perceived Performance Change……….. 40
7. DISCUSSION 7.1 Contributions……….. 42
7.2 Limitations………. 45
7.3 Recommendations for Future Research………. 46
Page
Figure 1 Overall Variable Relations………... 85
Figure 2 ESS Increase for Final 25 Fusions………... 86
Figure 3 Cluster Centroids……….. 86
Figure 4 Perceived Performance Change by Personality Type……….. 87
Figure 5 Regression Plot of the Effect of Extraversion on Relational Performance….. 88
Figure 6 Regression Plot of the Effect of Extraversion on Task Performance………... 88
Figure 7 Regression Plot of the Effect of Openness on Relational Performance……... 89
Figure 8 Regression Plot of the Effect of Openness on Task Performance……… 89
Figure 9 Regression Plot of the Effect of Conscientiousness on Relational Performance……….. 90
Figure 10 Regression Plot of the Effect of Conscientiousness on Task Performance….. 90
Figure 11 Regression Plot of the Effect of Agreeableness on Relational Performance... 91
Figure 12 Regression Plot of the Effect of Agreeableness on Task Performance……… 91
Figure 13 Regression Plot of the Effect of Neuroticism on Relational Performance…... 92
Page
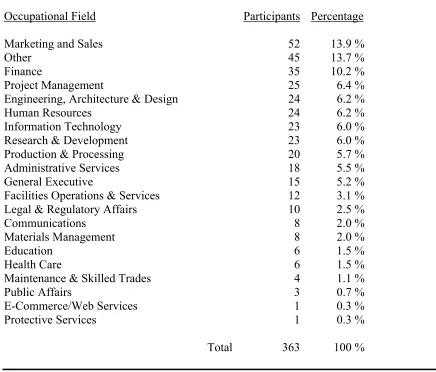
Table 1 Participant Occupation Fields……….. 59
Table 2 California Personality Inventory - CPI260 Scales………... 60
Table 3 Rotated Factor Matrix for CPI Scales on the Five-Factor Model……… 61
Table 4 REFLECTIONS© Scales………... 62
Table 5 REFLECTIONS© Items………... 63
Table 6 REFLECTIONS© Subscale Intercorrelations and Reliabilities………... 64
Table 7 Factor Loadings for REFLECTIONS® Items………... 65
Table 8 Variable Intercorrelations and Reliabilities……….. 66
Table 9 Perceived Performance Change Scores by Demographics……….. 67
Table 10 Perceived Performance Change Scores by Rater Group……….. 67
Table 11 Descriptive Statistics for Personality Clusters………. 68
Table 12 Perceived Main Effects of Performance Change by Personality Type……… 69
Table 13 Perceived Performance Change by Personality Type……….. 69
Table 14 Comparisons of Personality Type by Performance Factors………. 70
Table 15 Regression Test of the Relationship between Perceived Performance Change and Extraversion………. 71
Table 16 Regression Test of the Relationship between Perceived Performance Change and Openness………. 72
Table 17 Regression Test of the Relationship between Perceived Performance Change and Conscientiousness...………. 73
Change and Neuroticism………. 75 Table 20 Regression Test of Moderation of the Relationship between Self-Other
Rating Discrepancy and Perceived Performance Change by Copier
Personality Type………... 76 Table 21 Regression Test of Moderation of the Relationship between Self-Other
Rating Discrepancy and Perceived Performance Change by Controller
Personality Type………... 77 Table 22 Regression Test of Moderation of the Relationship between Self-Other
Rating Discrepancy and Perceived Performance Change by Charismatic
Personality Type………... 78 Table 23 Regression Test of Moderation of the Relationship between Self-Other
Rating Discrepancy and Perceived Performance Change by Dutiful
Personality Type………... 79 Table 24 Regression Test of Moderation of the Relationship between Self-Other
Rating Discrepancy and Perceived Performance Change by Extraversion….. 80 Table 25 Regression Test of Moderation of the Relationship between Self-Other
Rating Discrepancy and Perceived Performance Change by Openness……... 81 Table 26 Regression Test of Moderation of the Relationship between Self-Other
Rating Discrepancy and Perceived Performance Change by
Conscientiousness………. 82
Table 27 Regression Test of Moderation of the Relationship between Self-Other
Rating Discrepancy and Perceived Performance Change by Agreeableness... 83 Table 28 Regression Test of Moderation of the Relationship between Self-Other
Introduction
The scientific study of leadership is relatively new when compared to the general history of psychology. Several facets of leadership effectiveness remain unexplored while some extant leadership theories have yet to receive generalized empirical support. Initial impressions that leaders were great men and women who were born leaders gave way to more sophisticated and complex theories focused on the traits leaders possessed and what instruments, such as power, they used while leading (French & Raven, 1960; Terman, 1904). Later, industrial and organizational psychologists began to look at the behaviors leaders exhibit as they lead and how leader behaviors affect the relationships between leaders and followers (Stogdill & Coons, 1957). As the scope of leadership research and field study has changed over the past several decades, the argument over whether leaders are born or made continues to a lesser extent. This debate is at the center of one stream of leadership research, the study of leader emergence, which addresses the processes by which people come to be in leadership roles within groups (Judge, Bono, Ilies, & Gerhardt, 2002). A second stream of leadership research, on leader effectiveness, is the focus of the current paper.
effort by the leader, and an environment supportive of change (Goldstein & Ford, 2002; Smither, London, & Reilly, 2005). Regardless of whether one believes leaders are born or made, or even what one believes leadership should be or how it should be studied, one could argue that leaders can be developed.
Leader Development vs Leadership Development
Leader development and leadership development are similar; however, a separate conceptualization of each is important for the current study. Leader development is intrapersonal, focusing on leaders and developing them as part of the organization’s human capital. Leadership development is interpersonal, focusing on the relational dynamics of leadership as part of the organization’s social capital (Day, 2001; Palus & Horth, 2003). Whereas leader development seeks to develop leaders’ self-awareness by increasing the accuracy of their self-image as perceived by others, leadership
development seeks to develop leaders’ social awareness by encouraging service
orientation and empathy towards followers. The current study is primarily concerned with the investigation of leader development.
shared with leadership development is increasing the self-motivation of leaders. In this regard, successful leader development results in leaders taking the personal initiative required to commit to the organization with a spirit of optimism (Palus & Horth, 2003; Tinelli, 2000).
Organizations conduct leader development for several reasons. Providing leaders with increased self-awareness aimed at changing or developing critical job specific behaviors is a predominant reason (Day, 2001). Organizational outcomes such as improved profit and reduced turnover are also important goals for conducting leader development (Van Velsor, 1998). Preparation of leaders for promotion or increased responsibility within the organization is also a common reason for conducting leader development (Palus & Horth, 2003). Finally, some leaders might even be offered leader development opportunities as a last chance to demonstrate leadership potential as an alternative to termination. These reasons for conducting leader development all reflect an investment of organizational resources in order to improve leaders and the organization.
In order for the organization to receive some return on its investment in leader development, Goldstein and Ford (2002) suggest that individual goals for leader trainees and organizational goals related to leader behavior are identified through a needs
assessment. Research suggests that a given group of leaders who undergo a leader development intervention may improve by different degrees and in different job-specific areas (Smither et al., 2005; Walker & Smither, 1999). The current study seeks to
strategies and goals of leader development interventions and requisite needs assessments in order to optimize leader development.
A critical component of effective leader development is goal setting (Goldstein & Ford, 2002; London & Smither, 1995). It is generally recommended that the leader undergoing the development intervention should be included as a participant in goal setting and goals should be realistic, attainable, and directed at specific behaviors targeted in the development intervention (Locke & Latham, 1990). The current study seeks to contribute to the extant body of knowledge on leadership by providing insight into how the predictive ability of leader personality might facilitate realistic goal setting prior to, and following leader development interventions.
How Leaders Learn
Leaders use work-oriented schemas in much of their professional learning processes (Tinelli, 2000). Leaders might learn and develop while doing their jobs; however, systematic leader development programs provide a framework for leaders to focus on proactive learning rather than reflecting on their leadership behaviors outside of a learning environment. Research has identified at least three factors that influence how leaders learn outside of formal leader development programs: the organizational context, intuition based on past experiences, and consultation with colleagues (Mumford, 1980).
learn from personal experience (Van Velsor, 1998). Though seemingly a natural
phenomenon, learning from experience is not overtly or deliberately used by leaders as a method for learning (Mumford, 1980). Mumford suggests three impediments to using learning from experience as a deliberate method for leader development. First, it is difficult for leaders to know what needs to be learned while learning from experience. Second, leaders are motivated to accomplish the task at hand. The motivation to learn, if present at all, is not what drives leaders through an experience. Third, most leaders do not receive the support necessary to learn unless the organization uses formal training
systems designed to allow leaders to learn from their mistakes without aversive consequences.
Informal information-sharing among leaders is another form of leader learning (Boyce, 2004; Mumford, 1980). This method of vicariously learning from the
experiences, both positive and negative, of comparison others can be found in any organization with two or more leaders. One problem with this type of learning is that leaders passing on their experiences to other leaders rarely do so objectively (Tinelli, 2000). With the goal of enhancing the understanding of how leaders learn, the current study proposes to use data from a leader sample that has completed a deliberate and systematic leader development program aimed at changing leader behavior.
suggested by Kirkpatrick to be both a causal result of positive training-related affect and as causal to changes in behavior. Behavior, in turn, was suggested as causal to
organizational outcomes such as increased productivity due to transfer of training from the training setting to the context of the organizational workplace.
The other two models of evaluating training outcomes are extensions of Kirkpatrick’s (1963) model. The first extension divides and explicates types of trainee reactions and learning (Alliger, Tannenbaum, Bennett, Traver, & Shotland, 1997), whereas the second classifies learning outcomes (Kraiger, Ford, & Salas, 1993). Alliger et al.’s model classifies trainee reactions as either affective or utility reactions. Affective reactions capture whether or not trainees liked the training or found it enjoyable. Utility reactions are trainee judgments as to how useful or practical the training would be on the job. Alliger et al. explicate three facets of learning accomplished from training:
after which feedback is provided to trainees both in the training environment and on the job.
In the other extension of Kirkpatrick’s (1963) model, Kraiger and colleagues (1993) provide a classification of three types of learning outcomes: cognitive, skill based, and affective outcomes. These authors also recommend measurement strategies for each. Kraiger et al. (1993) further distinguish among various cognitive learning outcomes, including verbal knowledge, knowledge orientation, and cognitive strategies. Verbal or declarative knowledge, consistent with other learning theories (Ackerman, 1986; Anderson, 1982) is a prerequisite for higher order training and development and is measured in the initial stages of training. Knowledge organization is the classification of learning in which trainees form mental models from the verbal knowledge acquired through training. Cognitive strategies involve metacognition, or the knowledge and regulation of one’s own knowledge, and are used to facilitate application of knowledge acquired through training and subsequent transfer to a job-specific context.
Skill based learning outcomes concern the training related development of motor skills from cognitive learning outcomes (Kraiger et al., 1993). After initial motor skills are acquired, skill compilation is achieved by trainees proceduralizing discrete behaviors into domain-specific routines. After compilation, trainees are able to move from
controlled to automated processing (Shiffrin & Schneider, 1977), wherein performance is fluid and indicative of the trainees’ task mastery.
commitment, enhanced self-awareness, and tolerance for diversity. Motivational learning outcomes include motivational disposition, such as trainee progression from performance to mastery goal orientation, increased self-efficacy for behavioral change, and the
development of goal-setting skills. The explication of affective learning outcomes is important in that it provides a rationale for training directed at changing trainee perceptions about issues important to organizational objectives and culture. Methods of Leader Development
A variety of leader development programs and methods are available to organizations. Coaching is a leader development technique which usually includes multisource performance feedback and is aimed at assisting leaders to create strategies to improve areas in which they are weak and to sustain areas in which they are strong (Day, 2001; Palus & Horth, 2003).
uses ratings from raters with varying perspectives on a leader’s behavior on the job. Rating groups may be comprised of a leader’s direct reports, peers, and superiors (Farr & Newman, 2001; Mount, Judge, & Scullen, 1998). The terms multisource and multirater are often used synonymously with 360-degree feedback; however, multisource and multirater feedback may omit one or more of the possible rater populations. 360-degree and multisource feedback, when compared to a leader’s self-ratings, provide measures of leader self-awareness. This self-to-others comparison allows leaders to discover any differences between their self-perceptions and how different groups within the organization perceive their behavior while leading.
A central premise of 360-degree feedback is the assumption that leader
effectiveness depends on the perceptions of leaders’ direct reports, peers, and superiors and on the congruence of those perceptions with leaders’ own perceptions of their behavior. Widespread acceptance of this premise has made 360-degree feedback one of the most widely used methods of leader development in organizations today (Day, 2001; Van Velsor, 1998).
Ratings provided by subordinates might not be favorably received by leaders; therefore, rater anonymity is important (L. Atwater, Waldman, D. Atwater, & Cartier, 2000). Rater anonymity provides psychological safety for raters and the ratee (London, 2001; Van Velsor, 1998). Previous research has demonstrated that anonymous ratings are more likely to be open and candid, and that ratees are less likely to be defensive of comments suggesting needs for improvement from anonymous ratings (Atwater et al., 1995). Finally, 360 feedback is effective because ratees can compare their self-ratings to the ratings of others in order to identify behaviors needing change and to determine in which direction the behavior should change (Smitheret al., 2005; Smither & Walker, 2001).
In practical terms, 360-degree feedback can be useful for providing upward feedback, developing competitive competencies, and changing organizational culture by changing the behavior of individuals who influence organizational culture (Bracken, Timmreck, & Church, 2001; Van Velsor, 1998). All of these uses are predicated on the assertion that individual behavior change is a prerequisite for improved organizational performance. There are three purposes for conducting 360-degree feedback:
administrative, developmental, and research. Research purposes are for the refinement of the 360-degree evaluation instrument (Day, 2001), and could also be used as criteria for tailoring 360-degree assessments, feedback techniques, and leader training design as the current study suggests.
self-awareness in order to identify behaviors that need to be changed and to develop strategies for changing them. Organizations should decide whether or not to conduct 360
evaluations and feedback for administrative or developmental purposes only after they consider what they are trying to achieve by using 360-degree feedback (London, 2001). Key issues for organizations to address prior to conducting 360-degree feedback include the method of evaluation, rater selection, instrument design, and method of measurement.
Some previous researchers have argued that 360-degree feedback should be used for administrative purposes for a variety of reasons (Bracken et al., 2001; Dalton, 1998; London, 2001). Administrative decisions are extremely important and those making them should be informed of all information possible about ratees. In some instances, for
example, supervisors may not have the same ability to observe ratees in their day-to-day activities as well as ratees’ peers. Organizations commit significant resources to conduct 360 evaluations and therefore the organization would like to benefit in every way
Other previous researchers have argued that 360-degree feedback should only be used for developmental purposes (Bracken et al., 2001; Dalton, 1998; Farr & Newman, 2001; Kaplan & Kaiser, 2003; London, 2001; Smither & Walker, 2001; Van Velsor, 1998). Developmental use of 360-degree feedback has been recommended for situations in which personal development through internal motivation and reflection is an intended outcome (London, 2001; Wohlers & London, 1989). Using 360-degree feedback for developmental purposes removes potentially unqualified rater groups such as
subordinates and peers from influencing administrative decisions. It has also been
demonstrated that raters provide different information pertaining to the same ratee for the same behaviors depending on whether raters know the ratings will be used for either administrative or developmental purposes. In one study, raters who provided negative information on a ratee’s behavior during developmental ratings changed their ratings to become more positive during administrative ratings (London, 2001). In this regard, the validity of the ratings is suggested to increase when 360-degree feedback is used for developmental purposes. Developmental use of 360-degree feedback is further suggested to have increased utility in that ratees might change only behaviors which they are ready to change and that readiness is fostered through the assurance of ratees’ psychological security (Dalton, 1998).
purposes is not advised because the information gathered through these ratings may suffer distortion due to rater biases such as leniency, halo, or negative rater agenda.
Rater selection is another issue to be concerned with when measuring the
effectiveness of a 360-degree feedback program (Bracken et al., 2001). Farr and Newman (2001) suggest that it is best to begin by selecting rating groups, then individuals from these groups. Typical rating groups include ratees’ immediate supervisor, other superiors, peers, and subordinates. Since each rating group provides a unique perspective on ratees’ performance and behavior, usually no one rating group is considered more important than another (Landy & Farr, 1980). Further, raters should be selected based on their ability to observe the relevant behavior of ratees. Farr (2001) suggests that ratees be involved in rater selection and that enough raters should be selected, preferably at least five, from each group so that rater anonymity is preserved. A final consideration regarding rater selection is rater training. Raters should be informed as to the purpose of the 360-degree feedback and they may also receive training and feedback on their ratings in relation to other raters.
The Leader’s Role
Leaders’ self-awareness is important in that it affects their behavior, not
necessarily as a result of their reactions to feedback sign (positive or negative) but rather through a homeostatic response (Bono & Colbert, 2005). Feedback intervention theory (FIT) suggests that leader behavior is regulated by comparisons between feedback and goal or standard conditions (Kluger & DeNisi, 1996). Kluger and DeNisi further suggest that goals or standards are organized hierarchically in such a manner that goals at the top of the hierarchy relate to the self, such as career success or self-esteem, whereas goals near the bottom of the hierarchy are related to physical action, such as walking from one point to another. Attention is limited and therefore only discrepancies between feedback and standards receive attention required to regulate behavior. Further, outcomes from goals higher in one’s hierarchy are capable of influencing goals lower in the hierarchy (Vallacher & Wegener, 1987). Goal setting theory (Locke & Latham, 1990) suggests that when faced with a discrepancy between feedback and goals or standards such that
feedback is perceived as negative, people will be motivated to regulate their behavior to improve performance. However, if feedback is negative to the degree that a discrepancy will not be eliminated by actions, then that standard or goal may be abandoned.
Another feedback-standard gap reduction strategy is to change the goal or
Feedback intervention theory is relevant to the current study because it suggests that feedback interventions change the locus of attention within one’s hierarchy of goals and standards and thereby affects behavior. A critical proposition, supported by a meta-analysis, suggests that feedback interventions affect performance positively when the feedback is accompanied by cues directing attention away from the self and towards the behavior in question (Kluger & DeNisi, 1996). When this change in locus of attention is coupled with goal-setting and strategies for changing the relevant behavior and not the person (self) as a whole, feedback prior to beginning a leader development intervention becomes increasingly effective.
Change in leader behavior following a feedback or a developmental program may not always be positive. Research suggests that negative performance changes may occur as often as 38% of the time (Kluger & DeNisi, 1996). Negative performance change following feedback is suggested to occur due to characteristics of either the feedback or the person receiving the feedback. Feedback characteristics, such as overly negative feedback or feedback aimed at recipients rather than their behavior, might cause recipients to discount the feedback (Atwater & Waldman, 1998). Personality facets of recipients, such as neuroticism or negative affect, might also contribute to negative performance change. Previous research has suggested that individual differences should be investigated for their influence on performance outcomes following leader
Measuring Change
Multisource feedback is only as useful as the instrument used to collect the ratings is sound (Rogelberg & Waclawski, 2001). Other factors that have been found to interact with characteristics of 360-degree feedback instruments include the performance domains to be evaluated, the structure of the feedback, and the demographics of ratees and raters (Farr & Newman, 2001). According to Farr and Newman, items should be based on observable behaviors, and the behaviors must be specific. Items should not be trait-based because different raters may operationalize traits differently, and ratees may find it difficult to discern which behaviors need changing from trait-based feedback (Smither & Walker, 2001). Location of items which measure similar constructs within the instrument is also important; items should be distally placed rather than proximally to prevent inflated correlations between similar items (Crocker & Algina, 1986). An appropriate instrument should have demonstrated criterion validity and be comprised of clear, relevant, and specific items aimed at observable job-specific leader behaviors.
suggested to both motivate the ratee to behave in order to meet their own perceptions and expectations as reflected by their self-ratings (Smither & Walker, 2004; Walker &
Smither, 1999) and to meet expectations inferred from the ratings of others (Johnson & Ferstl, 1999).
Measuring change in the ratee’s behavior over time can be useful in order to track the progress of personal development and in some cases to demonstrate overall program effects (Hill, 2005). Change is typically measured using a pretest (either traditional or retrospective) and a posttest, or by directly asking raters to estimate the degree of change retrospectively (Lam & Bengo, 2003). A traditional pretest is administered to raters prior to treatment or manipulation and ratings from it are compared to a post-test administered after treatment. A retrospective pretest is administered to raters after treatment or
manipulation and raters are asked to provide ratings of ratee behaviors as they remember them (before) and as they currently perceive them (after). Research suggests that
traditional pretests are more appropriate for measuring the effects of a program between subjects and that retrospective pretests are more appropriate for measuring subjective within-individual perceptions of change related to a particular program (Hill & Betz, 2005).
Traditional pretests are thought to be vulnerable to response-shift bias (Howard & Dailey, 1979), meaning that raters might rate from different frames of reference on different rating occasions. In general, change in ratings over time can reflect underlying alpha, beta, or gamma change (Golembiewski et al., 1976). Gamma change is a
recalibrate the rating scale between time 1 and time 2. Beta change can result in either an over- or under-estimation of true change depending on how raters recalibrate their subjective metrics. Alpha change is what most researchers consider true change, defined as a variation in the level of some existential state, given constant instrumentation related to a constant conceptual domain.
Change in leader behavior for the current study is operationalized as perceived performance change scores calculated by subtracting “then” scores from “now” scores from a retrospective pretest and post-test. Change scores might have low reliability under certain circumstances and are frequently less reliable than either the pretest or posttest scores if the variance of true change across subjects is low (Kane, 1996; Miller & Kane, 2001; Rogosa & Willet, 1983). Likewise, the reliability of perceived performance change scores can be high if true change varies significantly from person to person. If a sample of leaders participated in the same development intervention, subsequent similar
improvement might result in extremely low variance across their perceived performance change scores. The relevance to the current study is that individual personality
differences might account for a significant portion of the variance in perceived performance change scores across a sample of leaders attending the same leader development intervention.
above the mean at T1 will be lower at T2 and that ratings below the mean at T1 will be higher at T2, irrespective of any effects of the intervention. Only change beyond that which is expected from regression to the mean is worthy of attention when evaluating leader development. The current study utilizes a retrospective pretest that is administered at the same time as the post-test; thereby reducing the effects of regression to the mean involving perceived performance change scores (Hill & Betz, 2005).
Finally, a traditional pretest is vulnerable to a ceiling effect (Hill & Betz, 2005; Smither & Walker, 2001). A ceiling effect may result from very high pretest ratings. Leaders with pretest ratings of eight on a ten-point scale are only capable of achieving a perceived performance change score of two due to their initially high pretest rating, whereas leaders with a pretest rating of six on the same ten-point scale are capable of achieving a perceived performance change score as high as four. A ceiling effect may result in leaders with lower pretest scores achieving higher perceived performance change scores even if they did not exhibit more behavioral change than other leaders.
Retrospective pretests are vulnerable to rater cognitive biases (Craig et al., 2000; Hill & Betz, 2005; Smither & Walker, 2001). Recall bias affects how accurately raters remember ratees’ behavior at time one and thereby influences how they rate. Social desirability bias suggests that we are more critical of our past selves than we are of our present selves, which can result in overestimated change by raters. Effort justification bias may inflate change ratings, especially if raters believe that the organization is expending valuable resources for the 360-degree feedback program.
providing raters with feedback on their ratings in order to bring their attention to the influence of cognitive biases. For example, identifying for raters how their ratings compared with those from other raters of the same ratee might help calibrate raters to provide more normative ratings less encumbered by cognitive biases. However, this could also cause raters to provide more similar ratings, thereby reducing the variance between ratings.
Personality
Previous empirical investigations of relationships among leader characteristics, leader emergence, and leader effectiveness suggest that very few traits are universally associated with leader effectiveness except for intelligence and certain facets of
personality (Judge, Bono, Ilies, & Gerhardt, 2002). The most widely accepted taxonomy of personality traits is a five factor model known as the Big Five (Barrick & Mount, 1991). The dimensions of the Five-Factor Model are extraversion, openness,
conscientiousness, agreeableness, and neuroticism (McCrae & Costa, 1987; McCrae & John, 1992).
perceived as overbearing because of their highly self-involved social tendencies (Judge & Bono, 2000). Regarding performance change after training, moderate levels of
extraversion have been suggested to be the most effective (Barrick & Mount, 1991). Self-efficacious and assertive leaders are more likely to view behavioral change as something they are capable of accomplishing. Other facets of extraversion such as social ability or positive affect might, in high levels, inhibit behavioral change in leaders by elevating the personal needs of the leader for affirmation and self-worth.
Openness to experience is the disposition to be imaginative and unconventional. Leaders with high levels of openness to experience exhibit creativity and think
divergently. Qualitative research has suggested that openness to experience is perhaps one of the most important personality factors for effective leaders (Bass, 1990; Yukl, 1998). Others have conducted quantitative research suggesting that divergent thinking is highly correlated with leader effectiveness (Sosik, Kahai, & Avolio, 1998). Herold (2002) suggests that at least moderate levels of the facets of adaptability and need for exploration are required for people to undertake behavioral change with success. However, the facets of autonomy and non-conformity might inhibit leaders from
changing their behaviors. Kluger and DeNisi’s (1996) suggestion of targeting feedback at the task level, rather than the meta-task (or person) level, is critical to understanding the role of openness concerning leader behavioral change.
conscientiousness exhibit tenacity, persistence, and attention to detail. Changing leadership behaviors, and potentially leaders’ leadership style, is likely a difficult and gradual processes in which leaders with high levels of conscientiousness who are more driven to improve might demonstrate greater change relative to leaders with low levels of conscientiousness (Smither et al., 2005; Herold, 2002). Further, people with high levels of conscientiousness tend to have detailed plans and strategies relative to their goals and thereby stand a greater chance of achieving goal-directed behavioral change (Locke & Latham, 1990).
Agreeableness is the tendency to be trusting and compliant. Previous research suggests that certain facets of agreeableness such as interpersonal sensitivity and trust are positively related to effective leadership (Judge et al., 2002), whereas other facets such as need for affiliation and compliance are negatively related to leadership effectiveness (Yukl, 1998). This dichotomy helps to explain why agreeableness has the lowest relation to effective leadership of all the Big Five factors. These findings also suggest the value of separately studying the relationships between individual facets of agreeableness and leader effectiveness, rather than combining these facets into one broad construct.
Neuroticism represents the tendency to exhibit emotional volatility, poor adjustment, and negative affect (Judge et al., 2002). Previous research suggests that neuroticism is the only factor of the Big Five negatively related to leader emergence (Hogan et al., 1994) and leader effectiveness (Hill & Ritchie, 1977). People exhibiting low levels of self-confidence and adjustment are not as likely to be perceived by others as leader-like. Likewise, people exhibiting negative affect and high levels of neuroticism are less likely to be effective leaders (Judge & Bono, 2000). Leaders with high, or even moderate levels of neuroticism might be expected to resist behavioral change due to negative reactions to feedback and anxiety regarding change in general (Smither & Walker, 2004). In sum, it seems reasonable to suppose that if the Big Five factors are related to leadership performance, then they might also be related to performance change following a leader development intervention.
Personality has also been investigated using the pattern, or person-oriented, approach (Craig & Smith, 2000; Mumford et al., 2000, Buchanan, 1998; Russell & Craig, 2000). The pattern approach differs from the variable approach in that the pattern
frequency with which different configurations occur in nature. The current study employed both approaches.
Hypothesis and Research Questions
Leader development interventions may differ in scope and form, but they can all be described as forms of training. The completion of a leader development program involving 360-degree feedback does not ensure positive leader behavior change (Kluger & DeNisi, 1996). However, the leader development program completed by the
participants of the current study incorporates many of the recommendations suggested by Kluger and DeNisi’s (1996) Feedback Intervention Theory. Further, participants are provided with developmental coaching and instruction derived from negative aspects of their 360-degree feedback. Participants also receive training directed at achieving individual learning goals; therefore, participants are expected to improve their
performance after returning to their respective organizations (Goldstein & Ford, 2002). The sole hypothesis of the current study is concerned with mean change across the sample.
Hypothesis: Leader performance will be perceived to have improved after a leader development intervention.
leader personality predicts change in actual job-related behavior after a leader development intervention. See Figure 1 for a graphic depiction of the relations to be examined.
Research Question 1: Will leader personality type predict perceived performance change after a leader development intervention?
Research Question 2: Will specific leader personality dimensions predict perceived performance change after a leader development intervention?
Research Question 3: Does leader personality type moderate the relationship between self-other rating discrepancy and perceived performance change after a leader
development intervention?
Research Question 4: Do specific leader personality dimensions moderate the
relationship between self-other rating discrepancy and perceived performance change after a leader development intervention?
Method Procedure
Participants. An archival database of data from a leader development program was obtained for the study. The sample consisted of 363 leaders from a variety of
occupations. See Table 1 for occupation types. The majority of the participants were male (n=257, 71%). Participants were classified as either junior leaders (n=12, 4%), middle level leaders (n=223, 61%), or senior leaders (n=128, 35%). All 360 degree feedback in the current study was intended for developmental purposes only, though participants also gave consent to its future use for research, and all participants voluntarily enrolled in the leader development program.
Participants for the current study were nominated by their organizations to attend a five day leader development intervention on the campus of a non-profit consulting and research organization specializing in leader development. Prior to attending the leader development program, participants and their coworkers completed a 360 degree performance assessment and participants completed a version of the California
Leader Development Program. Day one of the leader development program was focused on developing participants’ self-awareness and facilitating participants’
understanding of their behavioral strengths and areas requiring development. Program facilitators provided participants with the results of their CPI260 personality inventories and facilitated group discussions concerning the role and purposes of leadership and how leader personality and behavior patterns influence leadership style. Participants also learned a behavior-based model for developmental feedback on day one.
Day two was focused on learning the unintended consequences of leader
behaviors. The importance of others’ perceptions are emphasized as participants received the results from their preprogram 360-degree assessment. Program facilitators led group activities designed to teach participants how to manage stress and understand the
influence of individual personality facets on behavioral change. As the final event for day two, participants established one behavioral goal related to their leadership feedback.
Day three was focused on learning methods and techniques for purposeful leadership behavior change. A framework for coaching was introduced, and participants engaged in videotaped coaching role play scenarios. These scenarios were reviewed by participants in order to further develop their understanding of the dynamics of deliberate behavior change. Participants conducted peer evaluations of other participants at the end of day three.
development plan incorporating their 360-degree feedback and what they had learned while attending the leader development program. The personal development plan was structured to address goal directed and job specific behavior. Participants presented their personal development plans either to a facilitator or to their leader development program peers prior to graduating. After their presentations, participants discussed the challenges and opportunities for implementing their personal development plan goals after returning to their organizations.
Upon graduation from the leader development program, participants completed a training evaluation survey in order to assess reactions to training. Ninety days after participants returned to their organizations, plus or minus thirty days, a trainer from the leader development program conducted another 360-degree performance assessment, using the REFLECTIONS instrument (Steed et al., 2004). This post-intervention assessment instrument was designed to assess whether the program resulted in training transfer in the form of improved leader performance.
Measures
achievement needs and cognitive tendencies, and stylistic preferences. See Table 2 for a description of the CPI260 scales.
Fleenor and Eastman (1997) conducted a comparison of the CPI to the Five Factor Model (McCrae & Costa, 1987) using two separate samples and found empirical evidence linking the CPI folk scales to the Big Five using exploratory factor analyses. See Table 3. Their results showed that the CPI folk scales of dominance, capacity for status, sociability, social presence, self-acceptance, independence, and empathy all load on the Big Five factor of extraversion. This result aligns extraversion to the entire folk scale group of interpersonal aspects. The folk scales of self-control, good impression, achievement via conformance, socialization, responsibility, and well-being all load on the Big Five factor of conscientiousness. This partially aligns conscientiousness with the folk scale group of internal values and normative expectations. The folk scales of achievement via independence, tolerance, conceptual fluency, flexibility, and insightfulness all loaded on the Big Five factor of openness to experience. This partially aligns openness to experience with the folk scale groups of internal values and normative expectations and stylistic preferences. The folk scale of communality loaded on the Big Five factor of agreeableness and folk scale of sensitivity loaded on neuroticism (Fleenor & Eastman, 1997). Using Fleenor and Eastman’s (1997) mapping of the CPI260 (Gough, 2002) folk scales to the Five Factor Model (McCrae & Costa, 1987), estimates of reliability were computed in the current sample for extraversion (.92), openness (.78), conscientiousness (.81), agreeableness (.93), and neuroticism (.93).
evaluation instrument containing a retrospective pretest and a post-test. REFLECTIONS was designed in 1994 as an instrument to measure behavior change after leader
development interventions, specifically the leader development program completed by participants in the current study (Steed et al., 2004). REFLECTIONS uses a now-then retrospective methodology asking participants and their multisource observers to rate targeted behaviors as they were before the intervention (“then”) and after (“now”). A nine-point rating scale was used, with anchors provided for 1 = not at all, 3= to a small extent, 5 = to a moderate extent, 7 = to a large extent, and 9 = completely. In the current study, the signed difference between those two ratings was used as the item response.
Previous research has suggested several methodological problems with difference scores, such as low reliability and regression to the mean (Edwards, 2001). The current study did not incorporate the use of difference scores in the measurement of perceived performance change. Rather, a perceived performance change score more similar to a traditional gain score was utilized. Whereas a difference score defines a construct as the difference between two other constructs, a gain score represents the amount of change within or upon a constant single construct (Rogosa & Willet, 1983). The current study measured perceived performance change as a gain score calculated from comparison of a post-test with a retrospective pretest; therefore the psychometric challenges often
associated with difference scores were not expected to be an issue here.
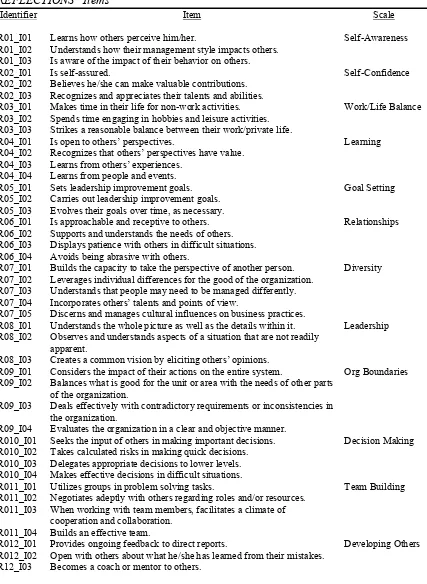
develop others (.78), make effective decisions (.78), enhance learning (.84), build & maintaining relationships (.84), work across organizational boundaries (.83), leverage diversity (.88), improve self-confidence (.79), and balance work and non-work activities (.90) (Jiang & Hannum, 2002). These reliability estimates were calculated from the current sample using scores attained by subtracting the before (then) score from the after (now) score for each item. Scale scores were calculated for each participant by averaging the scores from all raters, excluding self-ratings. REFLECTIONS scales are provided in Table 4 and REFLECTIONS items are provided in Table 5.
Improve self-awareness, using three items, measured how others perceived leaders’ leadership style and leaders’ behavior affected their coworkers. Demonstrate leadership, using three items, measured how well leaders saw the big picture and communicated their vision. It also captured leaders’ capacity to understand aspects of workplace and organizational context that are not readily apparent. Set and achieve goals, using three items, measured the extent to which leaders set, achieved and adjusted their goals for improvement over time. Build effective teams, using four items, measured how well leaders used the input of others to solve problems and how well they negotiated roles and resources with others in the organization. Develop others, using three items, measured the extent to which leaders coached and mentored others, provided feedback to direct reports, and communicated openly about what they had learned from their
events and the experiences of others. Build and maintain relationships, using four items, measured how approachable and receptive leaders were, and how well leaders exercised patience with and consideration for others. Work across organizational boundaries, using four items, measured the extent to which the leader considered the effects of their
decisions on the entire organization and how well leaders dealt with organizational contradictions and inconsistencies. Leverage diversity, using five items, measured leaders’ capacity to optimize individual differences for the good of the organization and their ability to discern cultural influences. Improve self-confidence, using three items, measured the extent to which leaders believed they could make a valuable contribution to the organization. Balance work and non-work activities, using three items, measured harmony between work and private life to include the incorporation of enriching hobbies and leisure activities (Steed et al., 2004).
from further analysis because it was not considered to be an element of leadership performance per se. Items loading on the factors resembling relational and task
performance were examined as a two factor structural model using confirmatory factor analysis (Wegener & Fabrigar, 2000) resulting in a good fitting model (CFI=.98, TLI=.99, RMSEA=.05, SMRSR=.01, df=854) and were thereby retained. Internal consistency estimates for the empirically derived scales were .98 for task performance change and .97 for relational performance change.
Performance Change Self-other Rating Discrepancy. Leader self-other rating discrepancy was operationalized as a signed continuous variable where positive scores indicated higher self ratings compared to the ratings of others and negative scores indicated lower self ratings compared to the ratings of others. This variable was calculated by subtracting the average rating of all coworkers from the average of a leader’s self rating across performance factors. Performance factors were collapsed for the calculation of self-other rating discrepancy because rating discrepancy has not been suggested to be related to any particular performance factor. Rather, the inclination to rate one’s self incongruently with the perceptions of others is more closely related to individual differences and likely to be consistent across performance dimensions (Atwater & Brett, 2003).
Analyses and Results
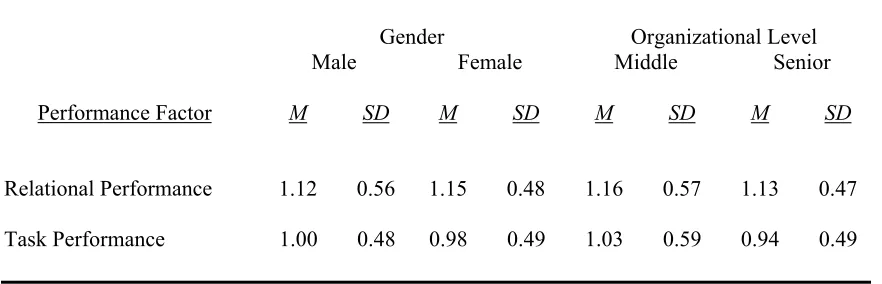
decrements or no change, respectively. As expected, performance improvement was reported in leaders with respect to both relational (M=1.14, SD=.54, p<.001) and task performance (M=.99, SD=.50, p<.001) factors. Further, the perceived improvement was significantly different between relational and task performance (p<.001), and confidence intervals of 95% for mean scores did not include zero for either performance factor. Therefore, the hypothesis that improved leader performance will be perceived after a leader development intervention was supported. Tables 9 and 10 provide further detail regarding perceived performance change by demographics. Given the relative emphasis on relational performance in the content and purpose of the current leader development program, the finding that leaders demonstrated greater improvement on relational performance compared to task performance was not unexpected.
Personality Types
Research question 1 asked whether leader personality type predicts performance change after a leader development intervention. This question was investigated by applying a taxonomic or “person” approach with regard to personality, and involved conducting a hierarchical agglomerative cluster analysis (Ward, 1963; Ward & Hook, 1963), followed by an iterative partitioning (k-means) cluster analysis, to derive a number of distinct personality “types” based on patterns across the five personality indicators. Ward’s hierarchical agglomerative clustering method minimizes the variance within clusters (personality types), thereby maximizing the variance between clusters.
shape, level, and scatter (Borgen & Barnett, 1987). Because not all cases are expected to fit neatly into a cluster, it is recommended to remove outlying cases as residuals prior to clustering (Aldenderfer & Blashfield, 1984). Using standard scores, eight cases were removed as outliers because they were not similar to any other case by less than an average squared Euclidean distance of .5 as recommended by Aldenderfer (1984). The remaining cases were submitted to hierarchical agglomerative cluster analysis using Ward’s (1963) minimum variance method.
The initial cluster solution served as the basis for a second iterative partitioning analysis, which re-evaluates each case’s cluster assignment and relocates it to a different cluster if the total error sum of squares (ESS) would be reduced via relocation. This process was iterative in that each cluster’s mean was recalculated for each iteration until no further reduction of the total ESS was attainable, thus correcting for centroid drift (Borgen & Barnett, 1987). Centroid drift occurs during the hierarchical agglomeration of the first stage when cases are assigned to clusters and not relocated, even when the subsequent addition of cases shifts cluster means, or centroids, making some cases no longer appropriate for the cluster of their initial assignment (Bergman & El-Khouri, 2002). Once cases were assigned to clusters, each personality cluster (or type) was examined, then named. Once participants were classified into personality types, a multivariate analysis of variance (MANOVA) was conducted to assess whether
participant personality types differed with regard to perceived performance change scores (J. Cohen, P. Cohen, West & Aiken, 2003).
conducting cluster analyses using the five-factor model as a set of profile indicators (Craig & Smith, 2000; Buchanan, 1998). Consistent with other studies, distinct personality types were identified within the current sample (Craig & Smith, 2000;
Mumford et al., 2000; Russell & Craig, 2000; Buchanan; 1998). However, the clusters (or types) that emerged from the current sample overlapped only partially with those from these previous studies. Previous research (Judge et al., 2002) has suggested that leaders might be expected to exhibit different personality profiles than followers. The current sample contains only leaders whereas Craig and Smith (2000) used two separate samples (undergraduate students and financial service representatives), neither of which
exclusively included leaders. Mumford and colleagues (2000) did use a sample of leaders; however, their study used the Myers-Briggs Personality Type Indicator (Briggs & Myers, 1987) as a personality measure and not the five factor model as used in the current study.
from the other three clusters on all five dimensions. See Figure 3 for a graphical comparison.
The copiers exhibited the lowest levels of extraversion and openness, and second highest levels of agreeableness and neuroticism. The low levels of extraversion and openness suggest a lack of self-confidence and originality. The relatively low levels of conscientiousness in copiers, when considered with their relatively high levels of agreeableness, suggests that leaders in this cluster may be more concerned with replicating the successful behaviors of other leaders due to a desire to be perceived as effective rather than being motivated to lead based on their own self-efficacy (Judge, et al., 2002). This group of leaders was labeled as copiers based on the expectation that they would likely copy effective leader behaviors and eschew ineffective leader behaviors without fully considering or exploring their own leadership styles.
The controllers exhibited relatively high levels of extraversion and
conscientiousness, and were the highest in openness and neuroticism. This combination is consistent with Bass’ (1984) conceptualization of personalized charismatic leaders. A personalized charismatic leader is authoritarian and has a high need for power. This type of leader may also exhibit low self-esteem, high narcissism, and is most likely to be perceived as Machiavellian by others (Judge et al., 2002). This group of leaders was labeled as controllers based on the expectation that they may exhibit narcissistic tendencies while seeking the approval of subordinates and peers through social interaction and of superiors through perceived competence.
charismatic leader. The socialized charismatic leader also has a high need for power; however, that need is counterbalanced with high activity inhibition, low authoritarianism, high self-esteem, and low narcissism. This group of leaders was labeled as charismatics based on the expectation that they would be liked by others and behave consistently with the best interest of the organization and its members.
The dutifuls exhibited the highest levels of conscientiousness and agreeableness and the second highest levels of neuroticism. Their high conscientiousness suggests that they are likely to be task focused. Their relatively low levels of extraversion coupled with relatively high levels agreeableness suggest a low self-efficacy and the need for
affirmation (McCrae & Costa, 1987). This group was labeled as the dutifuls based on the expectation that they would most likely be motivated to lead from a fear of failure or letting the organization down.
Personality Type and Performance Change
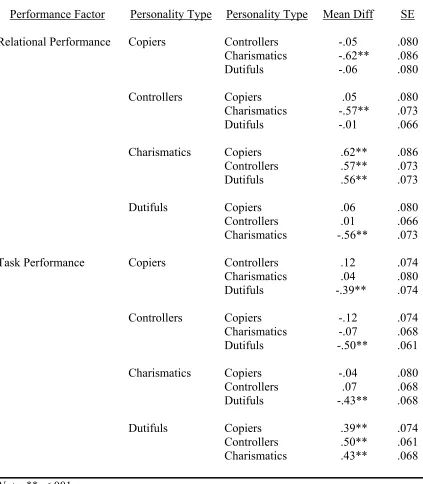
Personality type had positive and significant main effects on perceived performance change for relational performance (η2=.19, df=3, p<.05) and task performance (η2=.18, df=3, p<.05). Further detail, including comparisons across
Personality Dimensions and Performance Change
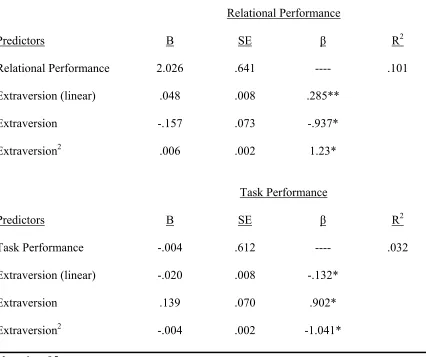
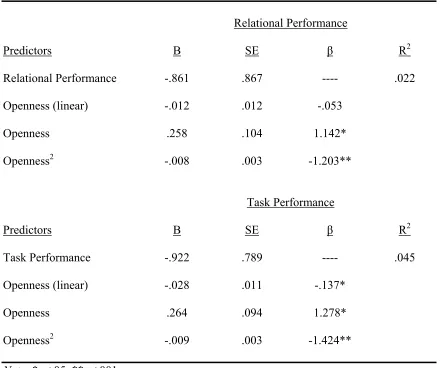
Research question 2 asked whether specific personality dimensions predict performance change after a leader development intervention. Linear and polynomial regressions were conducted using relational and task performance as criteria and personality dimension as predictors (J. Cohen, P. Cohen, West & Aiken, 2003). Results suggest that the personality dimensions of extraversion, openness, conscientiousness, and agreeableness predicted perceived relational and task performance change. Neuroticism predicted only relational performance change (see Tables 12 and 13). The effect of extraversion was oppositely signed for perceived relational and task performance change. Whereas perceived relational performance change increased as leaders’ extraversion increased, perceived task performance change decreased as extraversion increased (see Table 15 and Figures 5 and 6). Further, the relations between extraversion and relational and task performance were non-linear. Specifically, the quadratic term was a significant predictor for relational performance change (β=1.23 p<.05) and the quadratic term was a significant predictor of task performance change (β=-1.04, p<.05). These findings suggest that lower and higher levels of extraversion may be more predictive of positive relational performance behavioral change, whereas moderate levels of extraversion may be more predictive than lower or higher levels of extraversion for positive task performance change.
predict more positive relational and task performance change in leaders compared to very low or very high levels. Openness was the only personality dimension with significant quadratic effects in the same direction on both relational and task performance.
Conscientiousness had oppositely signed relations with perceived relational (β =-.26, p<.001) and task (β=.16, p<.05) performance change. As conscientiousness
increased, perceived relational performance change decreased, whereas perceived task performance change increased (see Table 17 and Figures 9 and 10). No curvilinear relations between conscientiousness and relational or task performance were observed.
Agreeableness negatively predicted relational (β=-1.90, p<.05) performance in that positive relational performance change decreased as leaders’ agreeableness increased. Conversely, agreeableness positively predicted task (β=-1.31, p<.05) performance change linearly in that positive task performance change increased as leaders’ agreeableness increased. However, agreeableness also positively predicted relational performance change in a non-linear manner, with the quadratic term having a significant regression coefficient (β=1.97, p<.05). This finding suggests that relational performance change decreased as agreeableness increased, but only to a certain point, at which relational performance change began to increase with leader agreeableness (see Table 18 and Figures 11 and 12).
Self-Other Rating Discrepancy
The other variable investigated in the current study was self-other rating discrepancy, and it was found to have nearly zero correlation with both perceived relational (r=-.01, p=.98) and task performance change (r=-.10, p=.07). Of all the variables in the current study, only openness was significantly correlated with self-other rating discrepancy (r=-.14, p<.001). Research question 3 asked whetherpersonality type moderated the relationship between self-other rating discrepancy and perceived
performance change after a leader development intervention. This question was
investigated by testing for moderation (Baron & Kenny, 1986) by personality type of the relationship between self-other rating discrepancy and perceived leader performance change. Leader self-other rating discrepancy was operationalized as a continuous variable where positive scores indicated higher self ratings compared to the ratings of others and negative scores indicated lower self ratings compared to the ratings of others. Prior to creating interaction terms, the predictor (self-other rating discrepancy) was centered (Cohen et al., 2003) in order to reduce the effects of multicollinearity between the main effects and the interaction term. Centering was accomplished by subtracting the
controllers, β=-.14, p=.26; charismatics, β=.10, p=.38; dutifuls, β=.04, p=.46) performance (see Tables 20-23).
Research question 4 asked whetherpersonality dimension moderates the relationship between self-other rating discrepancy and perceived performance change after a leader development intervention. This question was investigated by testing for moderation (Baron & Kenny, 1986) by personality dimension of the relationship between self-other rating discrepancy and perceived leader performance change. Prior to creating interaction terms, the predictor (self-other rating discrepancy) was centered (Cohen et al., 2003) as described above. Linear and polynomial regressions were then conducted for each performance factor as the criterion and the centered variables of self-other rating discrepancy, personality dimension score, and the interaction term as the predictors. In terms of moderation, only openness was found to have any influence on the relationship between self-other discrepancy and task performance change (β=-.15, p<.05).
Specifically, as leader openness increased, the relation between self-other discrepancy and task performance change became weaker (see Tables 24-28).
Discussion
leaders in the current study. The individual dimensions of the Five Factor model of personality, extraversion, openness, conscientiousness, agreeableness, and neuroticism, were also investigated as predictors of perceived performance change. Third, the current study sought to investigate whether or not personality might moderate the relationship between self-other rating discrepancy and perceived relational and task performance change. Analyses were conducted using data collected from multiple sources, thus addressing possible concerns about previous research related to monosource bias. Specifically, leader personality was measured via self-report data collected from the leaders themselves, whereas performance change was measured with ratings collected from multiple external observers.
The current study provides general support for recent research investigating the relationship between personality and leader effectiveness (e.g., Judge et al., 2001). However, the current study is not a replication of previous work because the criterion for the current study was perceived behavioral change rather than leader emergence or effectiveness, though the results from both studies are complimentary in terms of the role of personality in predicting perceptions of leader behavior. Further, the current study was not a meta-analysis, where as Judge and colleagues’ (2001) study was a meta-analysis of previous research investigating the relationship between personality, leader emergence and leader effectiveness.
groups of leaders exist in nature within any sample (Mumford, 2000). The current study also demonstrates the complementary natures of the person-oriented and traditional variable-oriented approaches to research. Whereas a variable-oriented approach can provide suggestions about what outcomes might be expected for individuals with specific configurations, a person-oriented approach can reveal whether those individuals actually exist in nature and test the hypotheses generated from variable-oriented investigations.
Investigating the relationships between personality and performance change using both personality types and dimensions as variables proved useful in the current study. The results from the analyses using personality types and dimensions were congruent. However, investigating the manner in which personality dimensions exist as a whole within leaders provides insight as to how a leader training program such as the one used in the current study might result in differential performance change as perceived by coworkers. Given that personality is somewhat stable over time (McCrae & Costa, 1987; McCrae & John, 1992), the findings from the current study suggest that subsequent leader development training might be designed to sustain strengths and improve weaknesses with the knowledge of leaders’ performance and personality.
The findings relevant to personality dimension prediction of performance suggest that certain dimensions might predict positive relational performance change, yet
negative task performance change. For instance, increasing levels of extraversion and agreeableness were related to improved relational performance, but declining task performance. Just the opposite was found in regard to conscientiousness. Decreasing levels of conscientiousness were related to declining relational performance, yet
correlation between relational and task performance (r=.01, p=.91) provide support for the distinction between relational and task performance as separate constructs. Further, the nonlinear relationships between certain individual personality dimensions and both relational and task performance provide support for the suggestion that more is not always better (Kaplan & Kaiser, 2003).
The current study involved a leader development program that incorporated many of the recommendations suggested by extant theory. Feedback Intervention Theory (Kluger & DeNisi, 1996) suggestions were present and do appear useful in a leader development intervention associated with positive relational and task performance. In particular, using knowledge of the recipient’s personality profile to structure feedback delivery techniques and procedures could prove quite useful in terms of reducing negative affective reactions and for the purposes of incorporating goal setting.
development of optimized training based on the personality of leader trainees might become possible. The central question concerning this issue is not which leaders to select into training programs, but rather, what type of training would be optimal for leaders based on their personality profile and developmental needs.
It should be noted that previous research has suggested that self-other rating discrepancy is related to leader reactions to feedback (Atwater & Brett, 2003; Brett & Atwater, 2001). However, the current study operationalized self-other rating discrepancy differently than previous research. Whereas Atwater and Brett (2003, 2001)
operationalized over- and under-rating as the number of items on which a leader rated themselves higher or lower than others did, the current study operationalized self-other discrepancy as a continuous variable, calculated as the overall difference between self and other ratings, thus capturing both the direction and magnitude of the rating
discrepancy in a single number. This difference in self-other rating discrepancy operationalization may have contributed to the differences in findings concerning this variable between the current study and the suggestions of previous research conducted by Atwater and Brett (2003, 2001).
Limitations