Dvnamic Behaviour antl Sensitivity Analysis of 5 kW PEMFC Stack Simulation
Arshail Ahmadl
Ahmad Raoof Ramliz
I Depattment of Chenical Engineering
Universiti Teknoloqi Malaysia, 813I0 UTM Skudai' Joho. Malavsia Tel: +60-7'sS 3 -56 1 0, Fex: +60'7' 558' I 463' Enail: [email protected] m!
2lnboratory of Process Control, Deparrnent of Chenical Eneineeing Universlti Teknologi Malaysia,81310 UTM Skunai' Johor' Malavsia
Tel: +60-7-5ss 35858 Enail: [email protected]
Abstract
This paper describes a three'dimensional 5 kW PEMFC stack dwamic nodcl. Both time and spatial dependence arc considired. Dynanic response anit sensitirit, analvses of the stack are caried out usi g MATI'AB and Simali* nadules. The rcsuks hiShliSht the three-dimensional distributions of species concentratio s, power densiu Md tenperaturc for the nodel. The effects ofleed flow ntes on the stark power PerfoftMnce are illustrated. me resuh conrtrmed that the nodel det)eloped as a reasonable rcprcsentation ol the fuel cell stack svstem.
Keywords:
Three-dimensional 5 kW PEMFC stack; finite differences scheme; siack power
Performance-Introduction
The use of combustion engine in aulomotive applications suffers fiom two main drawbacks. The irst issue is related to pollution from the exhaust gas emission. To adabess this concern, substantial efforts have been carried out. For example, lhe design of catalytic reactors has made the automotive etgine substafltially cleaner during the last lwo decades. Automotjve manufactureN have applied large efforls in reducing the emissions of hazardous gases from the combustion engine. However, it has still be€n proven to be difficult to eliminate NOx and SOx emissions from this
The second issue is regarding the overall efficiency achievable by the combustion engine. The chemical energy of gasolioe is converted to mechanical energy via the production of heat in the combusdon pmcess. The efficiency of this process is l;mited by the efficiency formula for the Carno! cycle. This lirut serves as the upper limit and hence cannot b€ further improved.
Procudinss of I ettutionoL ConJer^ce On Ch.nial ond DiaPn.es EnSineenne 27' 29' Au.uti 2N3 , u"i,^iti Malattia sabah Kota Kinabalu
A more efficient process, aJld one of the main candidates for power producdon in future automotives, is the new generation of fuel cells. The cells ir princiPal work similar as battedes, yet while batieries are essentially batch reactors, fuel cells are continuous reacto$. In a fuel cell-power€d engine, the chemical energy in the fuel is conveded to electrical energy and then to mechanical ene€) by an electric molor. The ptoce.. bypasses lhe limitations of the Camot cycle, and the theoretical efficiency is substantially higher than that of the combustion engine as illustmted in figure l. This implies that a fuel cell:powered automotive will be able to run for longer distance using the same amount of fuel compared to a conventional automolive. Carbon dioxide emissions are consequenily lowered, since smaller amounts of fuel are consumed for the same distance travelled The low temperatures in the process Practically eliminate the production of NOx and SOx and hence should in principle be cleane( tian Lhe exisling auromolive engin€
Figure l- Thermodywmic Eficency for Fuel CeLLs and Camot Efri.cienc, lot Heat Ensines.
their experiment as functions of membrane water content and equilibrium conditions between membrane liquid waler and electrode water vapour at the membrane-electrode inErfaces were applied. Their model also predicted an increase in membrane resistance with increased cun€nt density and showed the advantage ofa thinner membrane in alleviating the resismnce pmblem. Their model prepared lhe foundation for these simulations by also providing the key properiies of the membrane required for a numerical model. However, $ey considered a pseudo one-dimensionai model in which flow chanDels were treared as being well mjxed.
Srivinivasan et al. [2] conducted studies of four PEM fuel cells: 125 pm thick^ Dow membrane wirh high plarinum loading (10 mg/cm') electrodes and wiih low platinum loading (0.4 mg/cm'z) electrodes, a 100 pm rhick Nafion membrane with low platinum loading and a 175 lr,In thick Nafion membrane with low platinum loading. Equation 2.23 was used to d€scdbe fuel cell voltage as a function of
Pr@adirys d Inter@tiotul ConJerence On Chznnal ann Bioprocess Engi44ihg 2/' - 2q Ausust 2003 , Uaivedni Matatsia Sabah, Kota Kinabai
restrict the access of fuel and oxidanr gases to the catalysr layer and the thickness of rhe gas-diffusion eteltrode on the current and water disrribution wirhir th€ c€tl. They showed the expected change in cell performance rhai affects ftom the partial blocking of the substrare layer. However, in their work they considered only rhe half-cell potential for a given applied current.
Lee et al. [6 and 7] developed a model for a pEM membmne/elecrrode assembly rhat can be integrated into numerical model of compiele fuel cell stack. Empirical equations were used to modet physical processes, polarizations and elecrrical charactedstics. These equaiions are incorporated into a larger dynamic model to de[ermine electrical performance of a fuel cell stack. The dynamic model accounts for differences in local temperature. pressure, humidity and oxygen concenrrarion within rhe stack, Results from the model were reasonable in comparison ro established peformance experimenral results,
Curau et al, [8] included rwodimensionat, non-isothemal mathematical model for a PEM fuel celt. To simulare transport phenomena and performance of PEM fuel cells, equations were developed ao calculate actual concentration distributions along the int€rface berween the gas diffuser and catalyst layer. Non-dimensional kansport equarions were applied ro rhree domains: the carhode gas channel-gas diffuser-catalyst layer for rhe air mixture, rhe cathode gas diffuser-c:ithode catalyst layer-membrane-anode catalysr layer-anode gas diffuser for liquid water, and the anode gas channel-gas diffusei -catalyst layer for hydrogen. The transport equations were solved numericatly. Resutts from the madrematical model were compared wirh previously published results based on one-dimensional numerical models. The author suggested thar the resutts siould be considered mostly qualitatively. Unlike orher nodels, rhis model is able ro Fedict phenomena in rhe region where concentlarion polarizalion is predominanr.
Kulikovsky et al. [9] developed a two-dimensional simulation of the caihode compartmenr of pEM fuel cell and only investigared rhe iDfluence of two-dimension effects on carhode perfomlance. Their model was based on continuity equations for concentration of the gases and Poisson's equatiors for rhe polenriats of membrane and ' ca$on phase, coupled by Tafel relation for reacrion kinetics. Their resulrs prcsenred that for a low value of ca$on phase conductivity, a "dead zone,, in the active layer in fiont of the gas channel is formed, where the rcaction mte is small. The catalyst might b€ removed from this zone without significant Ioss in cell perfo(nance. Consequentty. these results showed the possibilities for a considerable reduction of the amount ofcaralyst.
Djanie tl0l developed a dynamic model of proron Exchange Membrane Fuel Cell (PEMFC) plant. The planr model war derived based on information gathered in the
E = E. - blog(i) - Ri
( l )E = fuel cell potential or voltage 4,= ideal fuel ceil potential
, = Tafel slope for oxygen reduction reaction n = cell resistance (primarily ohmic and charge
transfer rcsistance) i = current density.
The second tenn on rhe right hand side of Equation (t) represents activation polarizadon effects while the rhird represents ohmic resistance effecrs. Based on experimenral resuits, nonlinear least-squares fir technique is used !o determine Eo, , and R for each fuel cell analyzed.
Amphlett et al. [3 and 4] developed a steady-stare model for a Ballard PEM fuel cell using a combined mechanisiic and empirical approach. Usjng ma:s rran.pon anatysis, oxygen and hydrogen partial pressures and concentrarions at the catalyst surfaces are derermined. An expression for the actual vo age is developed based on ideal volrage at standad temperature and pressure, activation polarization as a function of temperarure, current density and oxygen concentration, and ohmic polarization as a function of tempemture and curent density. Using experimental dara from a single Ballard Mark IV PEM fuel celt, parametric coefficients for lhe activation polarization and ohmic polarization functions are determined. For the mnge of values used fof iemperature, oxygen partial pressure and curen! d€nsiry, the experimenral dala for actual voltage agree well with Ihe model results.
West and Fuller [5] designed lwo-dimensional analysis of PEM fuel cell by studying fie effect of rib sizing that
iileralure. Based on this model. dre dynarnic response of the plant was analyzed and the required control system was designed. In rhis plant, the fundamenlal theories of the PEM fu€l cell were based on conservation of mass and energy. The cunenl density was considered to be the product of the plant instead the power. Thus, the PEM fuel cell opemtion functions were not exacdy the behaviour of the real PEM fuel cell operation. The PEM fuel cell model did not considered the €ffect of the ohmic loss, anode and cathode p€fforrnances, Oxygen and Hydogen concentrations distributaries within the area, the humidity of the cell and the charge transfer resistance. Furthermorc, the model used many assumptions to simplify the PEM fuel cell operations due to the complex process.
Mann et al l ll developed a model ao predicl the steady-state performance of solid polymer electrolyte fuel cells (PEMFC). In general. the model has nol been applicable io cells with differenr chaftcteristics, dimensions, etc. The development of a generic model will accept as input not only values of the operating variables such as anode and cathode feed gas, pressure and compositions, cell lempefature and current density, but also cell parameter including active area and membrane thickness. A fufther fearure of the model \ras the addition of a term lo account for membrane ageing. The resulting model was largely mechanistic, with most terns being derived fiom theory or including coefficients that have a theoretical basis. -The major nonmechanistic term was the ohmic overvoltage that was primarily empidcally based. Data for va.ious PEM cell dosiSns were well corelated by the model. Due io diff€r€nces in the charact€ristics of the electocatalyst was the lack of agreement of the model predictions with some experimental
results-Rowe and Li n2l developed a one dimensional non-isothermal model of a pmton exchange membrane (PEM) fuel cell. The motives of the model were to investigate the effect of various design and operating conditions on the cell performance, thermal response and water managemeni and to understand the underlying mechanism. The model included variable membrane hydralion, temary gas mixtures for both reactant streanN, phase change of the water in the electrodgs with unsatunted reactant gas streams and rhe enefgy equation for the temperature distribution across the cell. The temperature distribution within rhe PEM fuel cell was found to be affected by water phase change in the electodes. especially for unsaturated reactant strcams, LaJgef peak temperatures occured within the celi at lower cell operaling tempemtures and for partialy humidified reactantr as a rcsult of increased membrane resistan€e arising ftom reduced membnne hy&ation. The results of the model indicated that opemting temperature and pressurc can be optimized, based on cell pedormance, for given design and other opemting conditions.
Djilali and Lu I13l presented an analysis of transport phenomena in a proton exchang€ membrane fuel cell, with
Prdeedius al tkt.mtidol Cufercrce On Ch.nical ana Bioptuce$ Enein ennq 2t -2qr A|AN 20A3 , Unite9iti Malatrio Saban, Kota Khabalu
a focus on the modelling and assessment of non-isothermil and non-isobaric effects thal have been neglected in previous studies. A model was formulated for a complete fuel cell taking inro accounl diffusion rhrcugh fie porous elechodes of the humidified fuel (Hr, COr, and HrO(')) and oxidant gases (Or, Nr, and HrOo). The rhermodynamic equilibrium potential was calculated using the Nemst equation and the reaction kioetics was determined using the Buder-Volmer equation. The model was solved numerically to analyze fuel cell performance and water transpo$ over a range of opemting curreni densities, Non-uniform temperaturc and pr€ssue disdibutions were found to have a large impact on the Fedicred liquid water and vapour fluxes in the anode and cathode diffusion layers. In particular, the results indicated that waier management requirements (i.e., humidification or wa@r removal) to prevent potential membrane dehydration or electrode flooding were much more conservative than predicted assuming isotbermal conditions.
In this wo*, modelling of a three-dinensional 5 kW PEMFC stack dynamic is devetoped. Based on this modei, the dynamic response and sensitivity analyses of the stack are carried out.
Model Formulation
A schematic diagram of a typical PEM fuel cell is shown in Figue 2. The cell consists of a cathode and anode elecbodes with a proton conductive membrane as the elecirolyte sandwiched in between. Between each of the electodes and the membnne there is a catalyst layer, refened to as the caftode and anode catalyst, rcspectivety. This work is based on the models developed by Djaeni ll0l. In addition. other relationships are also added to completely specify the system accwately. These include the intedacial transport equations like Butler-Volmer equation and Electrode reveNible voltages, Stefan-Maxwell equauon,
Figurc 2 - A Schematic of A PEM FueL CeII
1
6
* r
o g
s ?
1
I
E ! € o
t
Interfacial Transport Equatiotrs
The Butler - Volner equation describes the charge transfer Drocess across the anoAic and cathodic double layer' This equation characterizes the functional relationship between rh; activadon or charge-transfer overpotenlial (1) and cunent densily for an electrode at a paflculd temperature' oressure and volumerric concenlmlion ofreactiog sPecies at ihe electrode or elecrrolvle inlerface This equation allows the comDutation of lhe rct cunent density flowing through an elecirode or elecuolyte inierface for a particular overvoltaqe (nJ esLablished belween the melallic electtode ruaac. una ,ni n"lmr,ottt plane' taking into consideGtion the presence of a forward (ir) and backward (iJ current denslry flowing across fte mention€d metal or eleckolyte inlerface. The net current density for a one-step electrochemical reaction flowing through an elec$ode can be defined mathematically using the following equationl
(2)
Cons€quenlly the expression fot the net cunent density for one-srep elecEochemicai reaction flowing through a metallii electrode is expressed using fie following Where the forward curent density (i) and the
current density (ib) are defined as follows:
9!!!
(t-d).n.F.4
" l
I
Pfi,e1dn!\ ot lntc4aioMt Conlcrcn( Oa Ch.ni.al and Bioprc"st Eaaineenne 27' 2q' A,su! 2NJ Ua;vPtit: Molorao Sobah Kota Kiaabalu
according to a specific and un€quivocal scale. These magdtudes are named "elecrode potentials" and are defined as the electromotive force of a cell containing the elecEode under analysis and the standard hydrogen electrode (SHE), for which the voltage is arbilrarily talcn as zero. Generally the reve$ible potential of an electrode for a specific electrochemical reaction can be separated into 3 terms. The first one represenis the standard electrode potential and contains parameters that conespond to a ;hndard slate as a reference (normally I atrn and 25 "C). The second one contains values dependant only on temperature and the third one depends directly on temperaturc, pressure, ion activities, etc. The following equations show the mathematically formulations for the anodic and cathodic reversible voltage.
At the anode the reversible voltage for the oxidation of pure hydrogen is given by the following equation:
A " P T
E i = " " ' -
* ! . ( T
- I )*-:--.ln(pH,)
q . . b d " . t L r , . r(6'
At the cathode ihe reversible voltage for the reduction of pure oxygeo is given by the follo\ting equation:
^ n a A s ' I ? ' f
E: = '" | - =- .(T -7", - -:::- .ln( pO t)
c t c . F d c . f d , . fa)
In a thfte-dimensional system the equation of mass continuity for incompressible fluid flow of constant density is expressed using the following general formula:
( 8 )
t14l
(3)
(4)
*=1*"'.*o',n{0".)
'=r.l
(5) p: Fluid density, (kg/cmr).v: Vetocity vector, 1cm/s) p.;t Mass flux, Ike/(cm'?.s)1.
V.(p. i ):Net rate of rnass flux per unit volume, tkg/(cmtr, .
Reananging terms it can be wriiten in the following vectodal folm:
Equation (5) is called the Butler_Volmer equation. N;rmally the variables associated with this equation (the exchang! cunent densily i. and the charge transfer coefiicient ct) are obtained from empirical proce-dures This equarion ;s considered a valid Lool lo explain the inlerfacial ctrarge rran.fer process even though the delailed mechanisms of electrode electrochemical reactions are not well understood.
In addition, it is imPortant to know that the electric potential of an isolated elecrode (or absolute electric potential) cannot be measured in pmctice Fol that reason, iome relative magnitudes are defined by convention
870
(e)
#=-t"b;)l
Equation 10 shows the Schlogl equation ln this equation' the first term is related to the elecarical force actirg upon the ionic species in the membrane, which is proportional to the gradient of volhge. In the second tefi& the Parameier p r€presents the combined effect of static Pressure and
"=lt.ry.4.v.vp
-t".v,
Placeedin$ oJ lntemtionol Canference On Cheni.al and Bioptuces EryiwetinE 2/ 29 Ausd 2aB , U^ive6ri Malattia saboh Koto Kinabdlu
v.,,
=fj,.(,,l, -,, t,)
(t2)
Equation 12 is known as the Stefan-Maxwell equation. Energy Balance
Temperature of PEMFC is determined by the sensible heat of input and output streams, and the heat of waier formation. Approximated model can be derived as:
dT
| . ) = F T Q A N ) - t Q c o r t + Q M ( \ l ( C h F , ) \ t 3 ) dt
(t4)
( 1 5 ) ( 1 6 )
I10l
( l0)
Membrane fixed charge site concentration
Membrane electroknetic permeability, (m'z). Membrane hydraulic permeability, (m'?)
Bulk mean velociry, (nr/s).
Charge of fixed (sulfonate, SOl ) sites. Electrical potential, (V).
Pore-water viscosiry, [kg(m.s)].
e*, = F^ IZGp,c)dr
F:
kp: p:
v l
zf
0:
QsFc= @fiu)vFclt )
The Stefan-Maxwell's equation can be considered the first step for the calculation of ordinary diffusion in multicomponent gas mixtures, If we consider the presence of an ideal gas mixture in the porous electrodes it is Dossible to exDress the mass flux in ihe anodic and cathodic porous etecrroae mrough rhe following equalion:
,, ={.y*,u,.o,.v.,,
JirMass flux of species i, lmole,/(cn'?s)]. p: Fluid mass denqiry. (kg/cmr).
c = n/v - Pr/(R.T): Fluid molar density. Mi: Molar mean molecular w€i8ht of species i,
(kg/nole).
lvlj: Molar mean molecular weight of species j, (kg/mole).
Dit: Diffusivity ofthe pair i-j in a multicomPonent mixture,(cm'?ls).
xr = PilPr Mole fraction of species i, (dimensionless).
The mass flux equation l l can be rearranged as suggested by Hart and Womack [15] to obtain the molar fraction of species 'i' using the following equatioo:
(=l F. is rhe accumulalion of lhe gdse. temperatu.e leaving PEMFC (K/sec) OAN is lhe heat ftom anode side (J/sec; OcAr is the heat from ca$ode side (vsec) oRrc is the heat of water formation (tsec) Crhc is the heat capacily of PEMFC IJIL) fis the temperature of PEMFC (K) ?ArN is the temperature of inlet air (K) fl/Hro is the standard heat of water fomation
(Ymole)
Development of 5 kW PEM Fuel Ce Stack
The development of the fuel cell stack module models takes into considerations behaviour of individual components as well as their interactions. To simplify the development procedurc, the stack is subdivided into three sub-modules These sub-modules include power distribution. gas flow and performance.
Pow€r Disftibution
The power distxibudon module compares the summations of the calculated values for the single cell curent ancl power produced to the requirement power that is 5 kW. This is done to determine if there is agreement between the
sum of the local values and the ovemll rcouirements. The total curent produced by the k'h cell in th€ stack is calculated by summing the contnbutions to the total cell
( 1 7 )
PruuediaE| oJ lhtemtiotul CanJeren e O. Chenicat and Bioprrcess En|ircerin| 27r - 2q Ausust 2OO3 . Uniwnni Maktsia Sabah. Kotuki,abdi
determined by the desired accuracy and tle nu.merical stability of the calculations. The propeaies of each computational element are assumed b€ sparially uniform and change wirh time. Time is measured in discrete steDs wilh the fuLure state of an elemenL calculaled using rie cunent state of the surrounding elements and marerial and transport properties. The size of the time sieDs. is also deLennjned by lhe desired accuracy of lhe resulrs and rhe numerical stability of the resutq rhe smaller lhe time sreD. or elemenr. the grearer rh€ accuracy and srabitiry bur Lhe greater the number of calculations that must be completed. A numerical srabte catcutalion is one rhat convereei on a solulion, whereas an unstable calcutaLion does no(.
After the single cell dynamic modej has been develoDed u s i n g M a t l a b , r h e f i l e rhen ; s con!ened i n i o simulink b t o ; k in order to develop rhe slack simularion that represents a 5 kW PEM fuel cell sLack. The parameleB and vzriabtes as well as the inirial values thar were necessary for simulation had been showo in Tabte I and Tabte 2.
In an actual fuei cell srack the currenr produced by each cell is th€ same since they are in electrical series. Thus, it is a requirement thar th€ calculated current pmduced by each cell be the same.
The tolal power produced by a particular cell is deleimined by multiplying the cunenr for each cell by the voltage for that cell. Thal is,
( 1 8 ) Finally the roral power produc€d by the entire stack is calculated by sumrning the power produced by each cell in the sbck. Thar is,
P " . " - = 5 k w = t r P . . r .
P,,*rr Totai power produced by the srack,
ts kwl.
P*rr: Power produced by the kth cell [kW] K: Number of cells in the stack. Gas Flow
The gas flow module uses the flowmte information from the flowrate of a single cell. This is accomplished by first multiplying the flowrate of a single cell by the number of cells in the stack and again by rhe number of flow channel for each cell. This process produc€s the total mass flowmte of a gar at the inlet of the stack.
mrblrl= mxinhx tL x K
ft": Mass flowrate ofgas x [kg/s] nc: Number of flow channets in a sirgle
element.
K: Number of cells in the srack.
Process Simulation
The model developed was simulated in MATLAB 6.1 envifonment. To model the non-steady state behaviour of a fuei stack. rhe modelling metiodology ulitised an explicir finite difierence scheme. This requires rhe tuel ce srack to be divided into small etemenrs. The size of each element is
872
Table I -ParatneteN and Vaiables
Parsmeter Value
L Gas channel length (m) 0.04 H Gas channel height (m) 0.0002
w
Gas chamel width (m) 0.0002 Gas diftuser widrh (m) 0.0002Catalyst layer width (m) I x 1 0 ' M€mbrane thickness (m) 0.0044
d- Transfer coefficien r, anode side T|ansfer coefficien r, carhode side
&odi
ref. exchanse
€unent
densiry
6 x 1 0 5i:I
l;lholde
ref. exchanse cunent density 4.4x10'
Faraday constant (C/mole) 96485.3
t
R Universal constant of gases (J/mole.K) 8.314 T.w Absolute rcference temperatue (K) 298.15 AC Shndard free energy charge (J mole) 2.18x10⁷ /^f Standard entropy change (tknole) 2.86x10³
cf
Membrane fixed charge site concentmtion (kmoYrni)1 . 2
Fixed-site charge -t
lllmbrane
electrokineric permeabitity 7.2xl0
Membrane hydraulic permeabiliry (m,)
o.20
ISBN:983-2643-15-5 (19)
Pore rvator viscosity (kg/m s) 2 . 3 x 1 0 ' s Hydrogen molecular weight
(kgil@ole)
2
Oxygen molecular weight (kg^motel 32
Water mole.ular weight (kg^mole) 1 8
Ptuedinss oJ Int.natiml Conlerene On Chenical and BioPraces EnBineenng 27\ -29\ Aus"st2AB. Universri MaLarsia Sdbah, Kota Kkabalu
Fig rc4 - Comparison of Prcdickd lsobaric Petomance Cu^)es With the ModEL of Djaeni [ 10]
Behaviour of feeds cotrc€ntration itr the gas channel The present model considered only three species in tle gas channels; hydrogen in the anode channel and in the cathode channel, oxygen and water. The distributions of the feed species are presented in figure 4 and 5 and the run time is
100 second.
FiBurc 4 - HJdrogen Concentration Distibution in the
Results
and Discussidn
This on-going works were aimed at Foducing complete models that completely cha&cterizes th€ behaviour of the fuel cell systems. However, the focus of this paper is on the response of the feed concentations inside the gas channel in 3-Dimensions and the overall dynamic response of tbe fuel cell stack. Tbe physical properties of the membraoe and electrode are the same as those Siven in Djaeni [10] as those given in table I and 2; in the discussion "base case' will be used to refer to isobanc condition.
Model validation: Isothermal and isobarlc conditions In the limit of constani pressure, the present numencal model is equivalent lo the l-D dynamic model of Djaeni [10]. In order to validale the numerical model, simulations were therefore performed first for constant gas pressure to allow comparison with the results of Djaeni Figure 3 compares the polarization curves (voltage vs. cunent) computed. The results of the present model were in good overall agreement with Djaeni's data; the slight difference between the two can be attributed to the different treatments of the gas channel and anode: in the present model (i) the gas channel are considered, and (ii) fie anode diffusion layer is included.
FiSure 5 - Orygen Concentralion Distrtbution in the Cathode Gas Channel.
The hydrogen and oxygen concentmtions as illustrated in figure 4 and 5 deqease from 0.20705 kmole/m' to 0.20405 knole/m3 and from 0.036231 kmole/mr to 0.036044
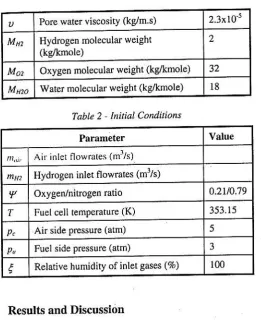
Tabk 2 - Initial Conditiotl,
Parameier Valu€
Aif inlet flowrates (mr/s)
Hydrogen inlet flowrates (m1s)
Oxygenhitrogen ratio
0.2tn.79
T Fuel cell temperature(K) 353.15Air side pressure (atm) 5 Fuel side pressure (atm) 3
I
Relative humidity ofinlet gases (7,) 1 0 0Hyd6!'i cdoi,'dhi o,mo tn1 6' r
Anod.e Gas Channel.
kmol€,/mr resp€ctively- The coocentmtions drop along the channels because the reactanls are diffused !o the electrode region (gas di|fusion layers). The dittusion process is a continued until the concentrations between the two regions
Sta€k Temperature
Figure 7 shows the stack lemperature generated from the energy balance equaiions using ODE solver. The !€mpemture of the stack is 328.15 K afier 35 second
PmeediBs olldeuatiotul Coaference On Chenical ahn Bioprocess EnBineerias 27' - 29' Atsue 2003 , Universni Malatria Sabah, Kota Kinabalu
tu. (3..&0
Fisure 9 - Response of PFc Due to The Skp Change of FB
Figurc 7 - The Tenperatwe of the PEMFC Stack
Dymmic response analysis
Figure 8 shows the schematic diagam of irput-output of the PEMFC. In this system, the effect of hydrogen flow on the power is observed. The flow of hydrogen is changed and air is adjusled at conslant flow. FiguE 9 presents the results of th€ procedure.
Hydrogen
Fieure 8 - The Schenntic Diaeram ofThe Input-Output of PEMFC stack
Figure 9 shows the rcsponse of the cell power output to step change of hydrogen flow. ln this case, the produced power decreases with the ircrease of hydrcgen flow. This is because; the increase of hydrogen flow decreases the residence time. Consequently. the ionization of the hyahogen at th€ anode also drops because of the shorter contact time. Besid€,s, the increase of hydrogen flow reduces the lemperature of PEMFC. since temperdturc of hydmgen fed into the system is lower than the operating temperature of PEMFC. As a result, the reaction rate of water formation or electric current genemtion beca$e
Conclusion
The models for a single cell and 5 kW PEM fuel cell stack have been developed in this study. The single cell model includes 3-D feeds concennation disFibution in the channels and polarization curves indicate the behaviours of the voltage and current density produced. The model was simulated in MATLAB 6,1 environment. The 5 kW PEM fuel cell stack model includes the stack tempemture and power. The model was simulated in Simulink and analyses of the dynamic behaviour of the process were ca.ri€d out. Results arc in agreemert to the work of Djaeni I l0l.
Acknowledgement6
This wo* is funded by the Ministry of Science, Technology and th€ Environment through National Science Foundation Scholarships and IRPA research grant. Our hea(iest apFeciations are for everybody who has dirccdy or indirectly contribute to the success of rhis project.
References
E
I I ]
Spdnger, T. E., and Zawodzinski, T. A. 1991. Polymer Electrolyte Fuel Cell Model Jounnl of the Electrochemical Society. y ol 138, No, 8. 2334. Sdnivasan, S., Velev, O. A., Parthasarathy, A., Maido, D. J. and Appleby, A. J. 1991. High Energyj
I
8'74
t2l
Efficiency and High Power Density Proton Exchange [8] Membrane Fuel Celh - Elecfode Kinetics and Mass
Transpott. Joumal of Power Sources. 36. 299-320.
Amplett, J. C., Baumert, R. M., Mann, R. F., Peppley, [9] B. A., and Roberge, P. R., 1995. Performance Modelling of the Ballard Mark Iv Solid Polymer Electrolyte Fuel Cell, L Merhanistic Model Development. Joumal of Ekctrochemktry Society.
142, No. l. 1-8. ttol
Ampletr. J. C., Baumerl, R. M., Mann, R. F., Peppley, B. A.. and Roberge. P. R., 1995a. Performance flll Modelling of.he Ballard Mark IV Solid Polymer
Electrolyte Fuel Cell. IL Empirical Model Development. Jounal of Electrcchemistry Saciery.
1 4 2 . N o . L 9-15.
West, A.C. and T.F. Fuller 1996. Influence of Rib lU Spacing in Proton-E\change Membrane Elecaode
Assemblies. Joumal of Applied Ekc,rochemistry. 26, 5 5 7 . 5 6 5
| l 3 | Ire, J. H., Lalk, T. R., and Appleby, A. J. 1998.
Modelling Electrochemical Performance In Large Scale Proron ExchanSe Membrane Fuel Cell SLacks. Joumal oI Pow?t Source s. 10.2s8-268.
Lee, J. H. and La1k, T. R. 1998a. Modelling Fuel Cell Stack Systeru. Joumal of Power
'ouffcs.
73.229-2 4 \ - l l ) l
Pnucdir$ aJ kkhd;ontt Conf.r.n e On Chtni.at onn Bioproc.$ Cnck<.dns 2r - 2q' Aus6t 200J , Univ?6ai Malatlio sobah, Kbkt K;,abatu
Gurau, V., Liu, H. ard Kakac, S. 1998. Two Dimensional Model For Proton Exchange Membrane Fldet Cells. Joumal of AIChE. 44.2410-2A2
Kulikovsky, A., Divisek, J. and Komyshev, A. 1999. Modelling tie Cathode Compartment of Polymer Electrolyte Fuel Cells: Dead and Active Reaction Zones. Joumal of ElectrochemicaL Sockty. 146.3981' 3991.
Djaeni, M 1999. Modellirg and Control of Fuel Cell S y s L e m . M s c . D i s s . , U n i r e r s i L i T e k n o l o g i M a l a y s i a : Mann, R, F., Amphlett, J. C.. Hopper, M. A. I., Jensen. H. M., Peppley, B. A. and Roberge, P. R. 2000. Development and Application of A Generaljsed Steady-State Electrochemical Model For A PEM Fuel Cetl. Joun^l of Powet Sources. 86. 173-180.
Rowe, A. and Li, X. 2001. Mathematical Modelling of Proton Exchange Membrane Fuel Cells. Joumal of Power Sources. 1O2. 82-96,
Djilal;,N. and Lu,D. 2002. Influence of Heat Transfer On Gas and Water Transport ln Fuel Cells. Intenutional Joumal ol Thermal Sciences. 4l .29"40. Hirchenhofer, J. H., Stauffer, D. B., Engleman, R. R. and Kletr. M. C, 1998. Fuel Cen. Handbook. Forr'rth Bdition. DOEFETC-99/1076.
Hafi, A.B. and G.J. womzck 1967. Fuel Cell Theory and Application. Chapman and HaI Ltd., London