ISSN(Online): 2320-9801
ISSN (Print): 2320-9798
I
nternational
J
ournal of
I
nnovative
R
esearch in
C
omputer
and
C
ommunication
E
ngineering
(An ISO 3297: 2007 Certified Organization)
Vol. 4, Issue 11, November 2016
Survey on Splitting Overlapped Blood Cells
using Segmentation Techniques
Vihangi H. Desai#1, Prof. Nisha Velani#2
M.E. Student, Dept. of Computer Engineering, Sardar Vallbhbhai Patel Institute of Technology, Vasad, Gujarat, India
Assistant Professor, Dept. of Computer Engineering, Sardar Vallabhbhai Patel Institiute of Technology, Vasad,
Gujarat, India
ABSTRACT: Accurate segmentation of blood cell is very much important because it acts as a health indicator. But it may happen that blood cell appears in clumps which are very difficult to split. Furthermore accurate identification of overlapping cell can increase the accuracy of the automatic cell counting system and this information is very helpful in diagnosing particular diseases like anemia, leukemia, etc. Also, by splitting the overlapped cells into single cell, one can get the exact blood count and all the relevant blood statistic like RBC, WBC and MCV etc. In automated cell imaging the first step is itself cell segmentation and it should be perfectly done because it affects the success of the successive steps. This paper presents various segmentation techniques for splitting the overlapped blood cells.
KEYWORDS: Segmentation, Detection of clumped cells, Overlapped blood cells, CBC (complete blood count)
I. INTRODUCTION
Exact CBC (complete blood count) is very much important in detecting any kind of disease i.e. from the count or say number of cells diseases like anemia, leukemia and others are detected in early stage and the patient can get the right treatment. To get this exact count perfect detection and segmentation of blood cells is required. Even this is more challenging in such a situation where blood cells may appear as a clump. In this situation where there are overlapped cells, first step is to detect those cells and then for splitting those cells segmentation techniques are used. [2]
Now a day automated imaging systems are becoming very popular for analysing the cells. These cells can be fixed or live. Manual counting of blood cells is time consuming and requires experts- pathologist which can be erroneous. In such an automated cell counting systems cell segmentation is the first step and it greatly affects the performance of the subsequent steps. [5]
In live cell images, these cells are in different morphologies and intensity characteristics. Also these characteristics may differ from one tissue to another. So from these points one can say that accurate cell segmentation plays crucial role in diagnosis.
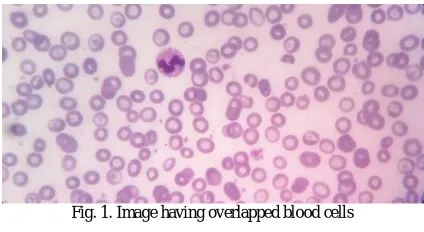
Fig. 1. Image having overlapped blood cells
II. RELATED WORK
ISSN(Online): 2320-9801
ISSN (Print): 2320-9798
I
nternational
J
ournal of
I
nnovative
R
esearch in
C
omputer
and
C
ommunication
E
ngineering
(An ISO 3297: 2007 Certified Organization)
Vol. 4, Issue 11, November 2016
segmenting the cells. In this method first the input image is converted in to binary image based on some threshold value let say K. Now if the pixel value is greater than K, then it belongs to the object region otherwise not. Here one can use Otsu’s thresholding method, too. In [2] author has used Morphological operations. Morphology involves structuring elements which is applied on to the input image and it will create the output image of the same size. Morphological operations are widely used in segmentation. In [2] authors have suggested Region growing method which is simple region based segmentation method involves seed points. Depending on to the seed points, it determines whether the pixels are to be added in to the region or not. For extracting cells from the blood different features like color, shape and texture are used. In [3] authors have used the algorithm based on the concave region extraction and erosion limit. In this approach erosion limit is combined with the concave region to separate the overlapping cell. In [4] authors propose watershed segmentation which produces better result for the gray level images with the different minima and catmint basin. Distance transforms (DT) is used to preprocess the image and to make it appropriate for the watershed segmentation. In [5] authors have used Marker controlled watershed algorithm in which accurate localization of internal and external markers is very important. First by identifying both the internal and external markers, in the end by combining the markers, original gradient image is modified and watershed segmentation is applied. In [6] graph based Power watershed segmentation algorithm is proposed by the authors. The formulation is performed on a discrete graph.
III.METHODOLOGY
There are four major steps which are carried out to split the overlapping cells which can be used as an input to many automatic cell counting systems. These steps may include Image Acquisition, image Preprocessing, Image Enhancement and Segmentation of overlapped cells.
The general block diagram of such system is shown below:
Fig. 2. Block diagram of cell segmentation
Image Acquisition:-
This is the first step which generally means retrieving an image from the source. In this system the source can be microscope and image itself is a microscopic image which can be obtained from hospital blood sample. This image is in RGB format.
Image Preprocessing:-
To improve the quality of the image preprocessing of the image is required. It is the technique of adjusting the image so that it can be suitable for the subsequent steps. This technique includes contrast enhancement, noise removal through various filters and morphological operations. In this system for better segmentation of blood cells the image must be enhanced.
Image Enhancement:-
The next step followed by preprocessing is enhancement. The aim of enhancement is to improve perception of information in the images and to provide better input to the next step. Image enhancement is the process of manipulating an image so that the result is more suitable than the original for a specific application. This include thresholding, contrast stretching etc.
Segmentation of overlapped cells:-
ISSN(Online): 2320-9801
ISSN (Print): 2320-9798
I
nternational
J
ournal of
I
nnovative
R
esearch in
C
omputer
and
C
ommunication
E
ngineering
(An ISO 3297: 2007 Certified Organization)
Vol. 4, Issue 11, November 2016
luekemia is identified from these information. So, the segmentation of these overlapped cells gains very much importance from all above listed steps. Various techniques are available for segmentation like thresholding, region growing, watershed segmentation, power watershed segmentation etc.
IV.SEGMETATIONTECHNIQUES
This section is all about different segmentation techniques which can be used in segmenting the overlapped blood cells.
A. CELL PROFILER
It is an open source software. Cell Profiler can be used to measure the size, shape, intensity and texture of different types of cell. It can be freely downloadable and is available for Windows, Mac and Unix. In this algorithms for image analysis are available as an individual module and it can be placed in a sequential pipeline. It identifies the object of interest and then measures its characteristics. It is capable of handling hundreds and thousands of images [1]. In cell profiler there are already existing methods and there is provision for developing new methods by experts. Though it is having above mentioned advantages it is not suitable for time-lapse and three dimensional image stack analysis.
B. THRESHOLDING
It is the simplest method for segmentation which is pixel based. In this approach the original image is converted in to binary image by selecting the proper threshold value K. Now by comparing all the pixel values in the image with the threshold value K we can convert the image into binary image. If the pixel value is greater than K, then it belongs to the object region otherwise not [2]. Related to blood cell segmentation, all the blood cells are having different intensity levels so one can easily extract RBC or WBC from the sample image of blood. Authors in [9] have used Otsu’s thresholding for extracting the RBC and WBC from the image. Thresholding is very simple and efficient method which is most widely used for segmentation.
C. MORPHOLOGICAL OPERATIONS
Morphological image processing that includes collection of non-linear operation related to features in an image. Also, it involves a template called structuring element which is a small matrix of pixels, each with a value zero or one. This structuring element is applied onto the input image and it produces the output image of the same size. In the output image some pixels are added or removed depending on the size of the structuring element. These morphological operations can be used in combination of other methods for segmentation. For example authors in [7] have segmented the blood cells by thresholding and used morphological operations as post processing before the counting step. Different morphological operations like erosion, dilation, opening and closing are used for specific purpose. So, morphological operations are used as pre or post processing in segmentation or counting of blood cells.
D. REGION GROWING
Rather than treating each pixel individually as in case of thresholding in region growing, connectivity between pixels is checks to decide whether that pixel is of the same region or from the different one. Seed point plays an important role in this approach and this is the first step in region growing. Seed point is selected is based on user criterion after that 4 – connected or 8 – connected neighbourhood is used to grow from the seed points. Authors in [8] have used region growing method for cytoplasm segmentation from a WBC.
E. USING CONCAVE REGION EXTRACTION AND EROSION LIMIT
ISSN(Online): 2320-9801
ISSN (Print): 2320-9798
I
nternational
J
ournal of
I
nnovative
R
esearch in
C
omputer
and
C
ommunication
E
ngineering
(An ISO 3297: 2007 Certified Organization)
Vol. 4, Issue 11, November 2016
F. WATERSHED SEGMENTATION
Watershed segmentation is similar to the notion of catchment basin of a heightmap. Clumped cell appear in the blood sample with various degree of overlapping. Watershed Segmentation is based on the concept of topographical representation of image intensity. The basic concept of watershed is based on visualizing a gray level image into its topographic representation i.e. minima, catchment basin and watershed lines. It uses Distance Transforms (DT) to preprocess the image and make it appropriate for the watershed segmentation. Several commonly used DTs are Euclidean, Quasi- Euclidean, City Block and Chessboard. From the experimental results it can be seen that by using Euclidean, Quasi- Euclidean, City Block DTs images are oversegmented. Here oversegmenting means segmenting the cell which is not even overlapped. While segmentation using Chessboard DT gives better result.
G. MARKER CONTROLLED WATERSHED SEGMENTATION
This algorithm first identifies the markers of an image i.e. the internal and external markers. After identifying the markers it starts flooding process from those markers. Here the success of the segmentation of overlapping cells is highly dependent on how accurately markers are identified on the image. If there is one to one mapping between the markers and the actual cell, one can get the more accurate result.
H. POWER WATERSHED SEGMENTATION
Power Watershed segmentation is graph based method. These graph based methods are becoming very popular in
recent years [7]. The formulation is performed on a discrete graph. It is defined as a graph = { ,ℰ } consists of a set
of vertices and a set of edges ℰ ⊆ × . Edge between and is denoted by . Now the weight is
assigned to every edge. The seed segmentation energy in [7] is given as
Where and are the binary labels associated with vertices and . F and B is the set of foreground and
background markers.
V. CONCLUSION
In this review paper, various methods for separating overlapping cells in the blood are explained. As the result of this segmentation is going to be used as an input to the automated counting systems it should be properly separated. In some methods morphological operations are carried out as a pre or post processing. Apart from the thresholding and morphological operations segmentation techniques such as watershed, marker controlled watershed and power watershed segmentation techniques are becoming very popular.
ACKNOWLEDGEMENT
The authors would like to thank HOD of department, Prof. Bijal J. Talati for her continuous support, encouragement and Civil Hospital, Surat for providing dataset for our future work.
REFERENCES
1. A. Carpenter et al., “Cellprofiler: image analysis software for identifying and quantifying cell phenotypes,” Gen Biol, pp.100.1-11, Oct 2006. 2. L. A. Bhavnania, U. K. Jaliyab and M. J. Joshi, “Blood Cell Segmentation and Counting”, International Journal of Innovative and Emerging
Research in Engineering Volume 2, Issue 11, pp.21-24, 2015.
ISSN(Online): 2320-9801
ISSN (Print): 2320-9798
I
nternational
J
ournal of
I
nnovative
R
esearch in
C
omputer
and
C
ommunication
E
ngineering
(An ISO 3297: 2007 Certified Organization)
Vol. 4, Issue 11, November 2016
5. Can Fahrettin Koyuncu, Salim Arslan, Irem Durmaz, Rengul Cetin-Atalay, Cigdem Gunduz-Demir,“Smart Markers for Watershed-Based Cell Segmentation”, PLOS ONE, Volume 7,Issue 11,pp.1-11,November 2012.
6. Noha El-Zehiry, Oliver Hayden and Ali Kamen, “Cell segmentation in digital holographic images”, IEEE, pp.209-212, 2016.
7. Y. M. Alomari, S. N. H. Sheikh Abdullah, R. Zaharatul Azma, and K. Omar, “Automatic Detection and Quantification of WBCs and RBCs Using Iterative Structured Circle Detection Algorithm,” Comput. Math. Methods Med., vol. 2014, p. e979302, pp.1-18, Apr. 2014.
8. P. Maji, A. Mandal, M. Ganguly, and S. Saha, “An automated method for counting and characterizing red blood cells using mathematical morphology,” in 2015 Eighth International Conference on Advances in Pattern Recognition (ICAPR), pp.1-6,2015.
9. Faliu Yi, Inkyu Moon, Bahram Javidi, Daniel Boss, and Pierre Marquet, “Automated segmentation of multiple red blood cells with digital holographic microscopy” Journal of Biomedical Optics 18(2), pp.026006.1-8, February 2013.
10. Camille Couprie, Leo Grady, Laurent Najman, and Hugues Talbot, “Power Watershed: A Unifying Graph-Based Optimization Framework”, IEEE transactions on pattern analysis and machine intelligence, VOL. 33, NO. 7, pp.1384-1399, July 2011.
BIOGRAPHY