ABSTRACT
CHOI, UCHEOR BRANDON. Single Molecule Fluorescence Reveals Dynamic Structures of SNARE Protein Assemblies. (Under the Direction of Assistant Professor Keith Weninger.)
Conformational information about proteins can often reveal the mechanisms of their biological functions. This thesis examines conformational aspects of the synaptic SNARE (soluble N-ethylmaleimide-sensitive factor attachment protein receptors) protein complex that is essential for membrane fusion leading to Ca2+ triggered neurotransmitter release. Biochemical and high-resolution structural studies of SNARE proteins and several different assemblies of these proteins have provided a foundation for our understanding of
neurotransmitter release, but the exact mechanisms these protein machines use to effect membrane fusion are still unclear. Here we apply single molecule fluorescence spectroscopy to this problem. Single molecule fluorescence resonance energy transfer (smFRET) is used to characterize dynamic aspects of intermediate structures of SNARE proteins along the pathway to full SNARE complex formation. Several SNAREs fall into the class of
DEDICATION
BIOGRAPHY
U-Cheor Brandon Choi was born in Busan, Korea in 1980, but most of his
ACKNOWLEDGMENTS
Committee members: Alex Smirnov (NC State, Chemistry), Robert Riehn (NC State, Physics), Celeste Sagui (NC State, Physics), Keith Weninger (NC State, Physics)
Weninger Lab: Laura Wessels, John Sakon, Trevor Anderson, Ruoyi Qiu
TABLE OF CONTENTS
LIST OF TABLES .……….…….vii
LIST OF FIGURES....…....………. ..viii
INTRODUCTION TO SNARES………….………..………1
1.1BACKGROUND ON SNARES AND NEUROTRANSMISSION…………..…..2
1.2PROPERTIES OF THE SNARE PROTEINS……….……3
1.3ROLES OF ACCESSORY PROTEINS IN REGULATING 1.4NEUROTRANSMISSION………..6
1.5DYNAMICS OF PROTEINS………..9
1.6SINGLE MOLECULE APPROACH TO BIOLOGY………...10
1.7OVERVIEW OF EXPERIMENTAL METHODS USED IN THIS THESIS ………12
1.6.1 SMFRET……….12
1.6.2 TOTAL INTERNAL REFLECTION MICROSCOPY (TIRM) ……….…...13
1.6.3 SAMPLE PREPARATION……….…...15
1.6.4 SNARE COMPLEX FORMATION………..16
1.6.5 VESICLE ENCAPSULATION AND RECONSTITUTION INTO LIPOSOME.………..………16
1.6.6 LIMITATIONS………...………..…..18
1.7 OVERVIEW OF EXPERIMENTS IN THIS THESIS………..18
REFERENCES………..…..22
CHARACTERIZATION OF THE UNFOLDED STATE OF ISOLATED SNARE PROTEINS ...……….……….26
2.1 INTRODUCTION……….……27
2.2 RESULTS………..…31
2.2.1 SMFRET MEASUREMENTS OF IDPS ISOLATED IN LIOPOSOMES………..…………..31
2.2.2 MEMBRANE ANCHORED IDPS………..……..32
2.2.3 EFFECT OF HIGH IONIC STRENGTHS ON IDPS………..…..34
2.2.4 CHANGE IN SMFRET MEASUREMENTS IN COMPLEX FORMATION OF IDPS………..34
2.3 DISCUSSION OF RESULTS ……….……...37
2.4 MATERIALS AND METHODS………...…….……...41
REFERENCES……….…...45
ACCESSORY PROTEINS STABILIZE THE ACCEPTOR COMPLEX FOR SYNAPTOBREVIN, THE 1:1 SYNTAXIN/SNAP-25 COMPLEX………....…….….47
3.1 SUMMARY……….…..…48
3.2 ACCESSORY PORTIENS STABLILIZE THE ACCEPTOR COMPLEX FOR SYNAPTOBREVIN, THE 1:1 SYNTAXIN/SNAP-25 COMPLEX ………...…50
SINGLE MOLECULE FRET DERIVED MODEL OF THE SYNAPTOTAGMIN 1-
SNARE FUSION COMPLEX ……...……….……….51
4.1 INTRODUCTION……….……52
4.2 RESULTS………..53
4.2.1 ARRANGEMENTS OF C2A AND C2B FOR ISOLATED C2A-C2B FRAGMENTS IN SOLUTION………..…..……..53
4.2.2 BINDING TO THE SNARE COMPLEX CHANGES THE CONFORMATION OF SYNAPTOTAGMIN………..…...56
4.2.3 FRET BETWEEN SYNAPTOTAGMIN AND MEMBRANE LOCALIZED SNARE COMPLEX IN PC BILAYER…..………...59
4.2.4 A SMFRET DERIVED MODEL OF THE SYNAPTOTAGMIN- SNARE COMPLEX ON PC BILAYERS………...……60
4.3 DISCUSSION………..………..64
4.4 MATERIALS AND METHOD………...……..65
4.4.1 PROTEINS………...……..65
4.4.2 MICROSCOPY………..67
4.4.3 DATA ANALYSIS……….69
4.5 SUPPLEMENTARY MATERIAL………....70
4.5.1 SUPPLEMENTARY NOTES………70
4.5.2 SUPPLEMENTARY FIGURES……….75
REFERENCES………80
SUMMARY………..…...….…...84
LIST OF TABLES
LIST OF FIGURES
Figure 1.1. The SNARE complex………...5 Figure 1.2. Schematic of the formation of ternary SNARE complex………6 Figure 1.3. A model of interactions among the SNAREs and other regulatory partners
in Ca2+ triggered neurotransmitter release ……..…..………...……...8 Figure 1.4. FRET versus distance between the two dye molecules……….13 Figure 1.5. Schematic diagram of a prism-type TIR setup and example of how smFRET
measurements are analyzed to yield a FRET histogram ……….……....14 Figure 2.1. Schematic of the experimental set-ups and the example traces………….……...30 Figure 2.2. Histogram comparison of smFRET measurements on intrinsically
unstructured proteins………...……33 Figure 2.3. The behavior of intrinsically unstructured proteins at 2.0M NaCl
concentration………35 Figure 2.4. The shift in FRET values when intrinsically unstructured proteins form
complexes with binding partners ………..……..38 Figure 4.1. smFRET reveals Syt1 conformations………..…..55 Figure 4.2. smFRET shows Syt1 conformations are dynamic……….……57 Figure 4.3. smFRET –derived model of the Syt1-SNARE complex………...……….……...61 Figure S1. Syt1 binds to SNARE complexes reconstituted in 100% PC bilayers more
strongly at decreased ionic strength of the buffer ………...………75 Figure S2. FRET histograms for additional control experiments where both donor and
acceptor are in the same C2A domain………. …...……...76 Figure S3. smFRET efficiency histograms for the Syt1 C2AB construct with labels at
residues 252 and 396……….….…..77 Figure S4. Simulated FRET efficiency distributions using molecular dynamics
simulations of Syt1 C2AB for the four C2AB spanning label pairs shown in
Fig. 1C……….……78 Figure S5. Gaussian fitting of smFRET distributions and zero FRET peak subtraction
Chapter 1
1.1 Background on SNAREs and neurotransmission
Neuronal networks involve communication between neurons that make connections at specialized junctions called synapses. Signals are transported over cell-sized distances within neurons as voltage differences between the inside and outside of cells that are due to ionic gradients in sodium and potassium. Once this traveling signal (called an action potential) reaches the synapse between two neurons it opens calcium specific ion channels that allow Ca2+ to enter the presynaptic side of the junction. The Ca2+ influx triggers the release of neurotransmitters from the presynaptic side into the synaptic junction. The neurotransmitter molecules then diffuse to the adjacent cell and trigger a new neuronal response that propagates away from the synapse.
Neurotransmitters are released by a Ca2+ dependent fusion of synaptic vesicles to the plasma membrane (Sudhof 2004). SNAREs (soluble N-ethylmaleimide-sensitive factor attachment protein receptors) are the essential components in the Ca2+ -triggered fusion machinery that mediates Ca2+ triggered membrane fusion of synaptic vesicles in order to release neurotransmitter. Synaptic vesicle membrane fusion is the fastest membrane fusion event triggered in cells, occurring on sub-millisecond timescales following the arrival of the action potential at the presynaptic terminal (Chapman 2008).
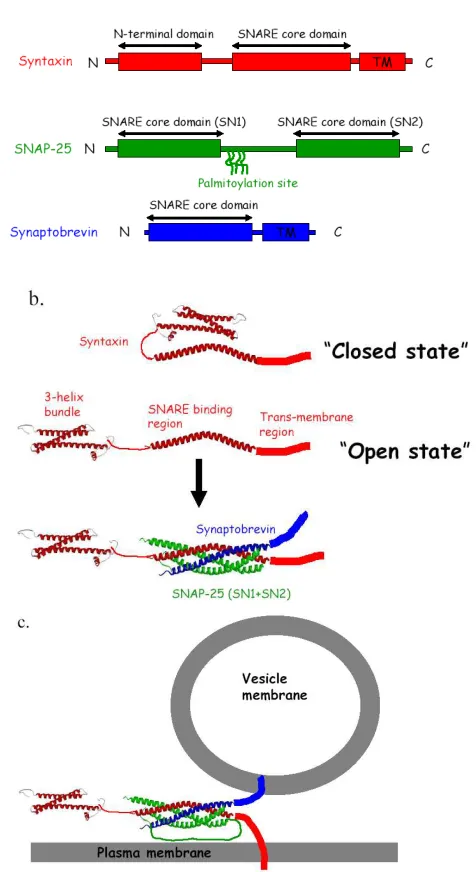
Three neuronal SNAREs are central to the triggered membrane fusion process.
alpha-helical bundles in which the helicies are formed from the so-called SNARE motifs. Syntaxin and synaptobrevin each contribute one helix and SNAP-25 contributes two helices to the SNARE complex. This complex has been studied by crystallography and X-ray diffraction at high resolution (figure 1.1b) (Burkhardt and others 2008; Sutton and others 1998b).
This SNARE complex is unusually stable, resistant to 90ºC with SDS (Sodium Dodecyl Sulfate) treatment. In vivo it requires the activity of ATPase enzymes to disassemble the complex for reuse of the individual proteins. The configuration of the complex as solved in the crystal structure positions the transmembrane anchors of syntaxin and synaptobrevin at the same end of the protein bundle very close by each other.
Extrapolation of this complex to the full proteins including transmembrane domains implies that the SNARE complex will force the two apposed membranes into close proximity and somehow promote fusion. The deep binding of the SNARE complex led to the so-called SNARE zippering hypothesis, which posits that the free energy released in assembling the final SNARE complex seen in the crystal structure from the mostly unstructured isolated SNAREs is somehow transduced into the membranes to overcome the barriers to fusion that are substantial. Revealing intermediates along the SNARE complex assembly pathway is essential for testing the zipper hypothesis of SNARE mediated membrane fusion.
1.2 Properties of the SNARE proteins
that anchors itself to the plasma membrane (Dulubova and others 1999). Switching between an open and closed conformation of syntaxin is thought to be involved in regulating
syntaxin’s ability to enter into the full SNARE complex on the path to membrane fusion (figure 1.1b). In the closed conformation, the Habc domain binds to the syntaxin SNARE domain. In the open conformation of syntaxin, the Habc is dissociated from the SNARE core domain. Thus the SNARE domain is free to interact with its partners, SNAP-25 and
synaptobrevin, to form a binary complex (Syntaxin and SNAP-25) or full complex (syntaxin, SNAP-25 and synaptobrevin) (Misura and others 2000; Weninger and others 2008).
Interactions in the SNARE core domain are mostly hydrophobic, with an asymmetric ionic layer formed at the center of the four-helices sandwiched between the hydrophobic layers (Jahn and Sudhof 1999).
SNAP-25 is an unfolded protein with two SNARE binding motifs called SN1 and SN2 (Fasshauer and others 1997) and a palmitoylated linker region (amino acids 84-130 of SNAP-25) that connects the two domains and serves as a membrane anchor (figure 1.1a) (Nagy and others 2008). SNAP-25 is known to bind to syntaxin and predicted to form coiled coils when binary complex or ternary complex is formed (Fasshauer and others 1997;
Pevsner and others 1994).
Synaptobrevin, also known as the vesicle-associated membrane protein (VAMP), is another unfolded protein that binds to the binary complex of syntaxin and SNAP-25, yielding the ternary SNARE complex (Hanson and others 1997; Sutton and others 1998a).
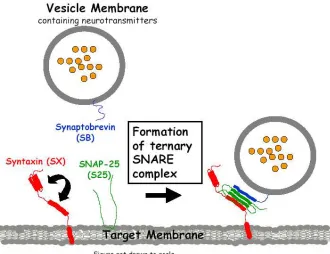
Figure 1.2. Schematic of the formation of ternary SNARE complex. The assembly of a four-α-helix bundle, one each from Syntaxin and synaptobrevin and two from SNAP-25 (SN1 and SN2) allows the synaptic vesicle containing neurotransmitters to dock on the plasma membrane.
plasma membrane, and allows membrane fusion to occur - releasing the neurotransmitters (Weber and others 1998).
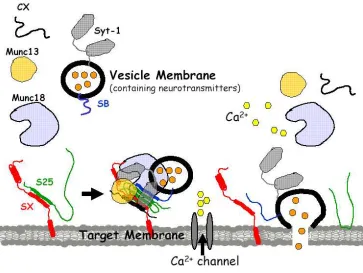
1.3 Roles of accessory proteins in regulating neurotransmission
Synaptic vesicles undergo a complex trafficking cycle before neurotransmitters are released to the synaptic cleft (Sudhof 2004). Vesicles are assembled and filled with
Docking of the synaptic vesicle requires the machinery of SNAREs along with other
proteins, notably Munc18 and Munc13. Docking is thought to involve partial assembly of the SNARE proteins but the specific intermediate states remain unknown.
calcium binding loops was found that suggests the possibility of a more complex role for synaptotagmin in triggered membrane fusion (Xue and others 2008). Evidence is building that there is interplay between synaptotagmin and complexin where complexin blocks complete SNARE complex zippering and then upon Ca2+ exposure, synaptotagmin releases the complexin clamp to allow the SNAREs to fully zipper, leading to fusion.
The necessity of the activity of many other proteins in addition to complexin and synaptotagmin is well established for proper operation of the SNARE membrane fusion machinery, but very few precise functions have been determined for any synaptic proteins. For example, SM (Sec1/Munc18-like) proteins, in neurons Munc18-1, binds to and stabilizes a ‘closed’ conformation of syntaxin (Dulubova and others 1999) that does not permit
SNARE complex formation with SNAP-25 and synaptobrevin (Zilly and others 2006). This conformation is presumed to inhibit neurotransmitter release. Yet, Munc18-1 is required for correct synaptic function because knockout mice lacking Munc18 show a total loss of triggered neurotransmission (Dulubova and others 2007; Dulubova and others 1999; Latham and others 2007; Rickman and others 2007). In general, the intermediate states that these synaptic proteins likely stabilize have been extremely difficult to characterize by standard biochemical methods. This thesis will focus on using single molecule fluorescence methods to reveal aspects of the dynamics of these proteins as they work together to assemble the SNARE machinery of neurotransmission. The generality of the single molecule approach will make these methods applicable to many other protein systems that involve dynamic conformations.
1.4 Dynamics of proteins
shapes that are critical for their function. These trends suggest that structural flexibility and dynamic mobility of proteins may contribute fundamentally to many biological functions (Garza and others 2009). An extreme example of this trend is the class of proteins termed intrinsically disordered proteins (IDP). These proteins are common, with ~75% of mammalian signaling proteins predicted to contain long disordered stretches and 25% of mammalian proteins are predicted to be fully disordered (Dunker and others 2008). Often the signaling function of these proteins involves transitions between ordered and unordered in response to stimuli. IDP play crucial roles in many areas of biology such as transcriptional regulation, translation and cellular signal transduction (Dyson and Wright 2005).
There are very few methods that can experimentally observe detailed properties of disordered proteins. NMR has a capability to report average dynamic behaviors of parts of proteins, but transitions between states are typically hidden by the ensemble average. Dynamic light scattering, Raman and other spectroscopies, or methods such as hydrogen-deuterium
exchange can reveal aspects of the behavior of IDP, but lack the ability to follow the specific trajectories of these dynamic conformational rearrangements (Dyson and Wright 2005). In this thesis we will develop single molecule fluorescence methods that are well-suited to reveal aspects of dynamic proteins and IDP that are undetectable by other methods.
1.5 Single molecule approach to biology
populated may be observed. Unsynchronizable processes in an ensemble may be directly measured with single molecule methodologies. By monitoring single or countable numbers of molecules or molecular complexes, single molecule studies have been applied to many biological phenomena including replication, recombination, transcription, translation, RNA folding and catalysis, non-canonical DNA dynamics, protein folding and conformational changes, various motor proteins, membrane fusion proteins, ion channels, and signal transduction (Roy and others 2008).
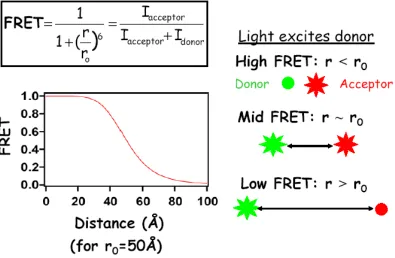
Single molecule fluorescence resonance energy transfer (smFRET) has been used to study the protein interactions and conformational changes of proteins in vitro. In FRET efficiency measurements, fluorescent dye molecules, also termed donors and acceptors, report the distance between them by the ratio of acceptor intensity over the sum of the donor and acceptor intensities. This energy efficiency, E, is also given as
1 6 0
)
)
(
1
(
+
−=
R
R
E
,where R0 is the Föster radius (when E=1/2) determined by properties of the two fluorescent dyes. From the distance dependency, FRET measurements are used as “spectroscopic rulers” to measure separations in biological macromolecules and complexes (Stryer and Haugland 1967b). Typically, the timescale of FRET measurements ranges from milliseconds to minutes giving the ability to monitor individual molecules for extended periods if they are
1.6 Overview of experimental methods used in this thesis
1.6.1 smFRET
FRET at the single molecule level has become a powerful technique for studying conformational distributions and dynamics of individual macromolecules. In traditional ensemble FRET measurements it is difficult to synchronize kinetics and detect rare events due to the ensemble averaging. FRET measures dye separation by using a non-radiative energy transfer between two fluorescent dye molecules (donor and acceptor) (figure 1.4) that is sensitive to the inter-dye distance, R, by the energy efficiency of energy transfer, E, given by 1 6 0
)
)
(
1
(
+
−=
R
R
E
.Figure 1.4. FRET versus distance between the two dye molecules. Top: The relation of FRET efficiency with the emissions of the dye molecules termed the intensity of
acceptor (Iacceptor) and the intensity of donor (Idonor). Right: When the distance between the two dye molecules are smaller than r0, there is a strong energy transfer where donor emits weakly and acceptor emits strongly giving a high FRET measurement. When the distance (r) is near r0, 50% of the energy is transferred giving FRET=1/2. When the distance is greater than r0, the energy transfer is weak and the acceptor emits weakly, giving a low FRET measurement.
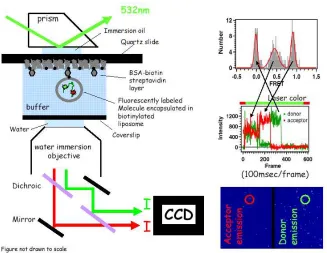
1.6.2 Total internal reflection microscopy (TIRM)
A prism-type TIRM was used to measure the emissions of the two fluorescent dyes in these smFRET studies. The evanescent field that is created from the total internal reflection (TIR) setup extends only to ~200nm from the glass surface of the microscope slide to which the fluorescently labeled sample is immobilized. This method greatly reduces the
higher single/noise ratio. An illumination laser, normally 532nm (8-10 mW) is used to excite the donor dye. The fluorescence emissions from both the donor and acceptor dyes are
collected by a water immersion objective lens (PlanApo 60X, NA 1.2, Olympus, Melville, NY) and split into donor and acceptor channels by a 645dcxr dichroic mirror (Chroma). Donor and acceptor emissions are filtered with band pass filters, HQ585/70 (donor) and HQ700/75 (acceptor) then collected by a two-dimensional detector, Cascade EMCCD (Princeton Instruments)
Alternating laser illumination (0 to 1 second of 635nm at 5mW; 1.5 to 100 seconds of 532 nm at 10mW; 105 to 110 seconds of 635nm at 5mW) allows us to distinguish the number of donor and acceptor dye molecules at each spot and custom programs written in MATLAB (The Math Works, Natik, MA) identified the single molecule locations and extracted intensity timecourses. The FRET values from many molecules are typically collected into histograms to differentiate the distinct populations of the spontaneous fluctuating molecules.
1.6.3 Sample preparation
From cysteine free templates, cysteine mutations were generated using the
Quickchange method (Stratagene)(Bowen and others 2005). Proteins were expressed from pet28a (Novagen) vector except synaptotagmin C2AB, which was expressed from pGex4T1 (GE Biosciences). Protein expression and purification of 6-Histidine fusion and GST fusion have been previously described (Bowen and others 2004; Bowen and others 2005; Weninger and others 2003). Briefly, proteins expressed as 6-Histidine fusions in pet28a used
separated from the protein, by gel filtration and extensive dialysis. Typically, the labeling efficiencies are greater then 80%.
1.6.4 SNARE complex formation
SNARE complex was formed as described previously (Weninger and others 2003). Briefly, proteins were mixed at a ratio of 1:2:5 (syntaxin:SNAP-25:synaptobrevin) and incubated overnight at 4ºC. To minimize the antiparallel assembly, 7.5M urea wash was included in the purification step. Free synaptobrevin was purified away by ion exchange on monoQ. For full length SNARE complex with the transmembrane domain of syntaxin, the detergent was exchanged to 100mM β-octyl glucoside for reconstitution in to liposomes.
1.6.5 Vesicle encapsulation and reconstitution into bilayer
thus allows study of interactions with other binding partners from solution. Normally an acceptor dye molecule is attached on the membrane localized protein and a donor dye molecule on the accessory protein that is freely diffusing in solution.
For encapsulation, soluble proteins were labeled and diluted to ~20nM concentration and mixed with dried phosphatidylcholine (Egg PC) containing 0.1% head group biotinylated 1,2-Dioleoyl-sn-Glycero-3-Phosphoethanolamine (biotin-PE) lipids to yield the final lipid concentration of 1mg/ml. Then the mixture was extruded through a 100nm pore filter followed by chromatography on Sepharose CL4B column to remove the unencapsulated proteins. Quartz microscope slides coated with biotinylated BSA/streptavidin were the surface for tethering the biotinylated liposomes containing encapsulated proteins.
Proteins with transmembrane domains were studied in supported lipid bilayers on quartz microscope slides. Proteins were first reconstituted into liposomes as describe earlier(Weninger and others 2003). Briefly, proteins in 100 mM β-octyl glucoside were diluted to ~20nM and mixed at a 1:4 ratio with 30mg/ml liposomes (50nm in diameter) and incubated on ice for 30 min. After a 1:1 dilution with detergent free buffer, the
unincorporated proteins were separated by chromatography on a Sepharose CL4B column. Bilayers were formed by 15 min incubation with protein containing liposomes (~3mg/ml) in a quartz microscope slide chamber sealed with UV curing optical adhesive (Norland
1.6.6 Limitations
There are some critical limitations on smFRET measurements that need to be discussed before planning experiments with this technique. First, for common dye-labeling strategies, a cysteine free protein template is required and at least two cysteine mutations need to be created at locations of interest to attach the extrinsic dyes. High labeling
efficiencies of the dye molecules are desirable for accurate single molecule analysis. These modifications risk changing protein functionality. Ideally, a functional assay can be used to verify the perturbations due to dye labeling do not significantly alter the protein behavior. Use of multiple combinations of dye labeling sites can further alleviate concerns about these perturbations. Second, complexes with weak interactions maybe hard to study due to the low concentrations of the molecules required for single molecule detection. Third, to achieve accurate FRET measurements that can report small distance changes, a high signal/noise ratio is crucial. Fourth, time resolution is limited by CCD camera transfer rates although confocal microscopes using avalanche photodiodes can minimize this problem at the expense of lower overall experimental throughput. Fifth, it remains challenging to convert smFRET values to absolute distances because of uncertainties in fluorescence properties of the dyes and possible failures of the freely rotating assumption about the orientations of the dye molecules (Roy and others 2008).
1.7 Overview of experiments in this thesis
forming the SNARE complex and the proteins that interact in regulatory roles with the SNARE complex.
In chapter 2, smFRET is applied to several of the SNARE proteins that are expected to be intrinsically disordered proteins. Versions of the proteins are created with two
fluorescent dyes positioned at various separations along the peptide chain and FRET is measured to determine the average separation of those positions. Proteins are immobilized for study by encapsulation inside liposomes, which are tethered to a quartz surface. Modeling the proteins with theories of polymer physics allows parameters to be extracted from the measurements that address aspects of the random flexibility of the proteins. These
parameters reflect the degree that these proteins satisfy definitions of intrinsically disordered proteins. Conditions are found that can affect these parameters, indicating changes in the randomness of the configuration of the peptide chain.
reconstituting an extremely low concentration of syntaxin to supported bilayer and forming the binary complex in a flow channel of a microscope slide. By labeling SNAP-25 with fluorescent dye molecules (donor and acceptor) at distinct locations, we were able to monitor the intermediate structures and dynamics of the binary complex, prior to synaptobrevin binding. By adding synaptobrevin or other accessory proteins, the intermediate state of the binary complex forming a three-helix bundle (SX-SN1-SN2) configuration is suppressed. This chapter has already appeared in print elsewhere as “Accessory proteins stabilize the acceptor complex for synaptobrevin, the 1:1 syntaxin/SNAP-25 complex” Structure `16, 308-320 (2008).
In Chapter 4, the interactions between synaptotagmin and the fully assembled
Properties of this complex are in agreement with other biochemical studies.
REFERENCES
Boukobza E, Sonnenfeld A, Haran G. 2001. Immobilization in surface-tethered lipid vesicles as a new tool for single biomolecule spectroscopy. Journal of Physical Chemistry B 105(48):12165-12170.
Bowen ME, Weninger K, Brunger AT, Chu S. 2004. Single molecule observation of liposome-bilayer fusion thermally induced by soluble N-ethyl maleimide sensitive-factor attachment protein receptors (SNAREs). Biophys J 87(5):3569-84.
Bowen ME, Weninger K, Ernst J, Chu S, Brunger AT. 2005. Single-molecule studies of synaptotagmin and complexin binding to the SNARE complex. Biophys J 89(1):690-702.
Burkhardt P, Hattendorf DA, Weis WI, Fasshauer D. 2008. Munc18a controls SNARE assembly through its interaction with the syntaxin N-peptid. Embo Journal 27(7):923-933.
Chapman ER. 2008. How does synaptotagmin trigger neurotransmitter release? Annu Rev Biochem 77:615-41.
Chapman ER, Davis AF. 1998. Direct interaction of a Ca2+-binding loop of synaptotagmin with lipid bilayers. J Biol Chem 273(22):13995-4001.
Dulubova I, Khvotchev M, Liu S, Huryeva I, Sudhof TC, Rizo J. 2007. Munc18-1 binds directly to the neuronal SNARE complex. Proc Natl Acad Sci U S A 104(8):2697-702.
Dulubova I, Sugita S, Hill S, Hosaka M, Fernandez I, Sudhof TC, Rizo J. 1999. A conformational switch in syntaxin during exocytosis: role of munc18. Embo J 18(16):4372-82.
Dunker AK, Silman I, Uversky VN, Sussman JL. 2008. Function and structure of inherently disordered proteins. Current Opinion in Structural Biology 18(6):756-764.
Dyson HJ, Wright PE. 2005. Intrinsically unstructured proteins and their functions. Nat Rev Mol Cell Biol 6(3):197-208.
Fasshauer D, Bruns D, Shen B, Jahn R, Brunger AT. 1997. A structural change occurs upon binding of syntaxin to SNAP-25. J Biol Chem 272(7):4582-90.
Fernandez I, Arac D, Ubach J, Gerber SH, Shin O, Gao Y, Anderson RG, Sudhof TC, Rizo J. 2001. Three-dimensional structure of the synaptotagmin 1 C2B-domain:
Fernandez-Chacon R, Konigstorfer A, Gerber SH, Garcia J, Matos MF, Stevens CF, Brose N, Rizo J, Rosenmund C, Sudhof TC. 2001. Synaptotagmin I functions as a calcium regulator of release probability. Nature 410(6824):41-9.
Garza AS, Ahmad N, Kumar R. 2009. Role of intrinsically disordered protein regions/domains in transcriptional regulation. Life Sci 84(7-8):189-93.
Gerber SH, Rah JC, Min SW, Liu X, de Wit H, Dulubova I, Meyer AC, Rizo J, Arancillo M, Hammer RE and others. 2008. Conformational switch of syntaxin-1 controls synaptic vesicle fusion. Science 321(5895):1507-10.
Giraudo CG, Eng WS, Melia TJ, Rothman JE. 2006. A clamping mechanism involved in SNARE-dependent exocytosis. Science 313(5787):676-80.
Ha T. 2001. Single-molecule fluorescence resonance energy transfer. Methods 25(1):78-86. Hanson PI, Roth R, Morisaki H, Jahn R, Heuser JE. 1997. Structure and conformational
changes in NSF and its membrane receptor complexes visualized by quick-freeze/deep-etch electron microscopy. Cell 90(3):523-35.
Herrick DZ, Sterbling S, Rasch KA, Hinderliter A, Cafiso DS. 2006. Position of
synaptotagmin I at the membrane interface: cooperative interactions of tandem C2 domains. Biochemistry 45(32):9668-74.
Jahn R, Sudhof TC. 1999. Membrane fusion and exocytosis. Annual Review of Biochemistry 68:863-911.
Latham CF, Osborne SL, Cryle MJ, Meunier FA. 2007. Arachidonic acid potentiates exocytosis and allows neuronal SNARE complex to interact with Munc18a. J Neurochem 100(6):1543-54.
Misura KM, Scheller RH, Weis WI. 2000. Three-dimensional structure of the neuronal-Sec1-syntaxin 1a complex. Nature 404(6776):355-62.
Nagy G, Milosevic I, Mohrmann R, Wiederhold K, Walter AM, Sorensen JB. 2008. The SNAP-25 linker as an adaptation toward fast exocytosis. Mol Biol Cell 19(9):3769-81.
Okumus B, Wilson TJ, Lilley DM, Ha T. 2004. Vesicle encapsulation studies reveal that single molecule ribozyme heterogeneities are intrinsic. Biophys J 87(4):2798-806. Pevsner J, Hsu SC, Braun JE, Calakos N, Ting AE, Bennett MK, Scheller RH. 1994.
Reim K, Mansour M, Varoqueaux F, McMahon HT, Sudhof TC, Brose N, Rosenmund C. 2001. Complexins regulate a late step in Ca2+-dependent neurotransmitter release. Cell 104(1):71-81.
Rickman C, Medine CN, Bergmann A, Duncan RR. 2007. Functionally and spatially distinct modes of munc18-syntaxin 1 interaction. J Biol Chem 282(16):12097-103.
Roy R, Hohng S, Ha T. 2008. A practical guide to single-molecule FRET. Nature Methods 5(6):507-516.
Schaub JR, Lu X, Doneske B, Shin YK, McNew JA. 2006. Hemifusion arrest by complexin is relieved by Ca2+-synaptotagmin I. Nat Struct Mol Biol 13(8):748-50.
Stryer L, Haugland RP. 1967a. Energy Transfer - a Spectroscopic Ruler. Proceedings of the National Academy of Sciences of the United States of America 58(2):719-&.
Stryer L, Haugland RP. 1967b. Energy transfer: a spectroscopic ruler. Proc Natl Acad Sci U S A 58(2):719-26.
Sudhof TC. 2004. The synaptic vesicle cycle. Annu Rev Neurosci 27:509-47.
Sutton RB, Fasshauer D, Jahn R, Brunger AT. 1998a. Crystal structure of a SNARE complex involved in synaptic exocytosis at 2.4 A resolution. Nature 395(6700):347-53.
Sutton RB, Fasshauer D, Jahn R, Brunger AT. 1998b. Crystal structure of a SNARE complex involved in synaptic exocytosis at 2.4 angstrom resolution. Nature 395(6700):347-353.
Weber T, Zemelman BV, McNew JA, Westermann B, Gmachl M, Parlati F, Sollner TH, Rothman JE. 1998. SNAREpins: minimal machinery for membrane fusion. Cell 92(6):759-72.
Weninger K, Bowen ME, Choi UB, Chu S, Brunger AT. 2008. Accessory proteins stabilize the acceptor complex for synaptobrevin, the 1:1 syntaxin/SNAP-25 complex. Structure 16(2):308-20.
Weninger K, Bowen ME, Chu S, Brunger AT. 2003. Single-molecule studies of SNARE complex assembly reveal parallel and antiparallel configurations. Proc Natl Acad Sci U S A 100(25):14800-5.
Xue M, Ma C, Craig TK, Rosenmund C, Rizo J. 2008. The Janus-faced nature of the C(2)B domain is fundamental for synaptotagmin-1 function. Nat Struct Mol Biol
Zhang X, Rizo J, Sudhof TC. 1998. Mechanism of phospholipid binding by the C2A-domain of synaptotagmin I. Biochemistry 37(36):12395-403.
Chapter 2
Characterization of the unfolded state of isolated
2.1 Introduction
Some of the SNARE proteins and SNARE binding proteins lack typical indicators of secondary structure when isolated. SNAP25 and synaptobrevin have been considered to be unstructured until they form complexes containing syntaxin. When mixed with syntaxin, circular dichroism studies indicate that SNAP25 gains alpha helicity. When synaptobrevin is mixed with syntaxin and SNAP-25, even greater levels of alpha helicity are observed that are consistent with the coiled coil structure of the full SNARE complex. (Uversky, Gillespie et al. 2000; Uversky 2002). In that complex, the two SNARE domains of SNAP-25, SN1 (residues 1-91) and SN2 (residues 112-212), bind in a parallel configuration (Weninger, Bowen et al. 2008) with syntaxin and synaptobrevin contributing one helix each (Sutton, Fasshauer et al. 1998). In contrast to the atomic resolution structure of the full SNARE complex, very little information about the nature of the unstructured state of isolated SNAP25 and synaptobrevin is available. We used single molecule fluorescence resonance energy transfer to examine the unstructured state of these proteins and also complexin.
that all of our measurements report highly averaged behavior of the dye-to-dye separation. Comparisons to simple theories of polymer behavior were used to extract characteristic parameters that can describe aspects of these random ensembles of protein configurations.
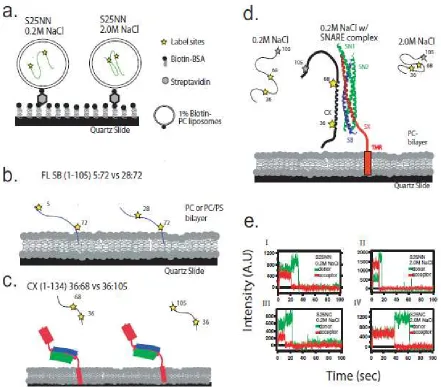
For SNAP-25 we selected label pairs that we designate NN (Q20C/N139C) and NC (Q20C/N197C) because the NN pairs are positioned very close in the full SNARE complex (at the N-terminal ends of the two parallel alpha helicies) and the NC pairs are very far apart in the SNARE complex (at the N-terminal end of one helix and the C-terminal end of the other helix). Thus, when the ternary SNARE complex is formed in a parallel configuration, SNAP-25NN gives high FRET and SNAP-25NC gives mid FRET (Weninger, Bowen et al. 2008).
dyes. Later the donor fluorophore photobleaches as it suddenly decreases to zero emission intensity. The single step transitions confirm single molecule level detection.
FRET efficiency is calculated from the background subtracted intensity time traces by the formula shown in figure 1.4 and histograms of FRET efficiency were assembled from measurements of many molecules. The FRET efficiency histograms were fit with gaussian functions and the center of the gaussian fit was used to extract the average dye-to-dye distance for each label pair. Since FRET efficiency (E) is inversely proportional to the sixth power of the dye separation, the distance R between the two-dye molecules can be extracted from the measured E as:
6 1 0
1
1
−−−−
====
E
R
R
,where R0 is Forster radius. We used 5.3 nm for our FRET pair based upon values supplied by the dye manufacturer (Invitrogen, www.Invitrogen.com).
As a simple estimate of the fluctuations of the proteins modeled as random polymers, we compared our experimental results to the worm like chain model (Rivetti, Guthold et al. 1996; Bouchiat, Wang et al. 1999; Abels, Moreno-Herrero et al. 2005). This model predicts that the mean square end-to-end distance between two points, <R2>, is related to the contour length L along the polymer separating the two points by the relation
−−−−
−−−−
====
−−−−PL
e
L
P
PL
R
22
1
1
,
continuous flexibility of the chain. We calculated L by multiplying the number of amino acids between the two cysteines where the dye molecules are bound by 3.4Å, a typical value
quoted for amino acid dimensions. Using a numerical approach of plotting L R
2
2
vs. P, we
derived an estimate of the persistence length of SNAP-25 from the measured FRET efficiencies.
2.2 Results
2.2.1 smFRET measurements of intrinsically unstructured proteins isolated
in liposomes
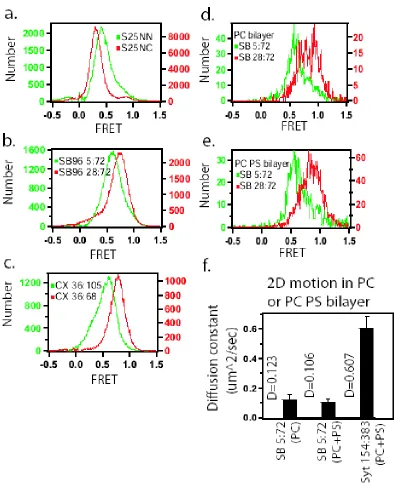
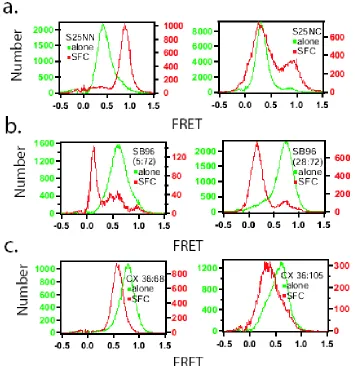
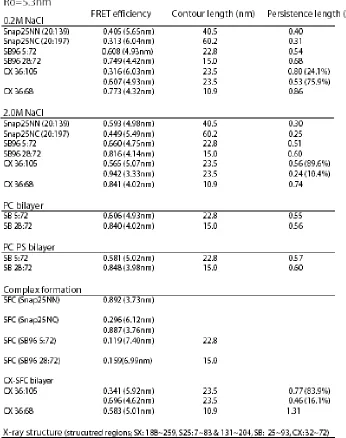
Isolated SNAP-25 NN and NC in solution, show the average fret values of E=0.40 and E=0.31 (figure 2.2), which converted to mean end-to-end distance of 5.7nm and 6.0nm. The contour lengths between these label sites were 40.5nm and 60.2nm for NN and NC respectively. Combining these values with the worm-like chain model yields persistence lengths of 0.40nm and 0.31nm for NN and NC respectively. These persistence lengths are intriguingly close to the amino acid dimension, suggesting a possibility for bending on very short length scales for SNAP-25.
E36C/D68C. For the two versions of soluble synaptobrevin (1-96), SB96 5:72 and SB96 28:72, the averaged fret values were 0.61 (<R>=4.9nm) and 0.75 (<R>=4.4nm) giving persistence length of 0.54nm and 0.68nm, respectively (figure 2.2b). A clear single gaussian fit peaking at E=0.77 (<R>=4.3nm) was measured for complexin 36:68 giving the persistence length of 0.86nm, but complexin with dye pairs at 36:105 showed two gaussian fit peaking at E=0.32 and E=0.61, giving the mean end-to-end distance of 6.0nm and 4.9nm (figure 2.2c). These two distances gave two values for the persistence length of complexin 36:105 of 0.80nm and 0.53nm. From comparing the area population of the gaussian fits, the gaussian with FRET peak at 0.61 was more dominate where 76% of the total molecules exist. All of the measurements are summarized in table 2.1. The longer persistence length of synaptobrevin and complexin compared to SNAP-25 indicates that the different proteins have different flexibility despite the uniform ‘unstructured’ appearance by other characterization methods.
2.2.2 Membrane anchored IDPs
Due to the 2D motion of reconstituted synaptobrevin in the plane of the lipid bilayer, a tracking program was used to measure emission from synaptobrevin molecules. These measurements yielded both the diffusion constant and the smFRET efficiency (figure 2.2d-f). The average diffusion constant of synaptobrevin on the bilayer was about 0.11 um2/sec, with a persistence length derived from FRET measurements of about 0.57nm. Use of PC or PC with 15% PS bilayers did not significantly change the single molecule FRET measurements of either of the two constructs of synaptobrevin.
2.2.3 Effect of high ionic strengths on IDPs
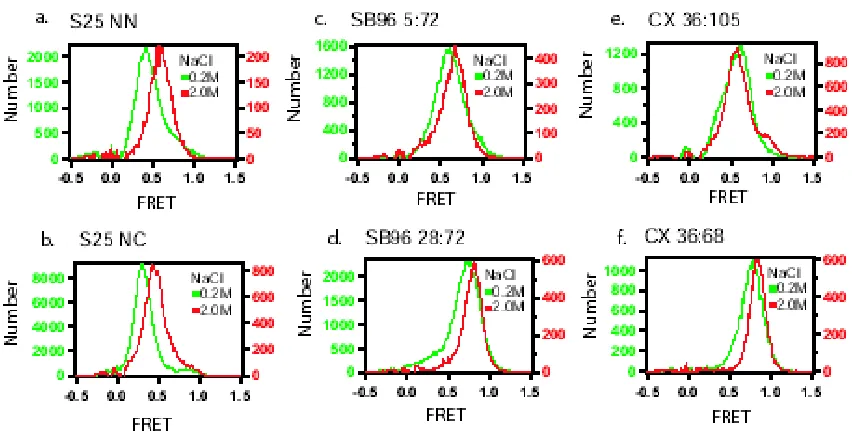
We measured the dependence of the FRET measurements on NaCl concentration. All of the previous measurements were in buffers containing 200 mM NaCl. When SNAP-25, synaptobrevin, and complexin were measured in 2.0M NaCl, the persistence length decreases about 0.1-0.2nm (figure 2.3a-f). To verify that 2.0M NaCl does not alter the properties of the dyes, four different sets of double stranded DNA molecules that were labeled with donor and acceptor dyes with different numbers of bases separating them, giving different FRET values, were measured at 0.2M and 2.0M NaCl (data not shown). FRET values from the DNA rulers ranged from 0.14 to 0.89 and did not change more than 0.04 for each when NaCl was changed between 0.2 M and 2.0 M.
2.2.4 Change in smFRET measurements in complex formation of IDPs
Figure 2.3. The behavior of intrinsically unstructured proteins at 2.0M NaCl. The red histograms show the FRET distribution for each protein at 2.0M NaCl, which can be compared to the 0.2M measurements in the green histograms. (a) and (b) are for snap25 labeled at NN and NC, (c) and (d) are for synaptobrevin (1-96) labeled at 5:72 and 28:72, and (e) and (f) are for complexin labeled at 36:105 and 36:68.
SNARE complex. We assembled full SNARE complex using either our double-labeled versions of SNAP-25 or double labeled synaptobrevin and measured FRET to verify the expected changes due to complex formation.
described elsewhere (Bowen, Weninger et al. 2005) and measured while reconstituted into supported lipid bilayers.
FRET measurements were in agreement with distances expected from the crystal structure of the SNARE complex shown in figure 1.1 (Sutton, Fasshauer et al. 1998). Our FRET measurements of SNAP-25 NN and NC incorporated into the SNARE complex (figure 2.4) gave dye-dye distances of 3.7nm and 6.1nm, which compare well to the distances from the crystal structure of 1.5nm and 8.0nm. Single molecule FRET measurements of SB96 28:72 and SB96 5:72 showed a decrease in FRET when synaptobrevin enters into complex with syntaxin and SNAP-25 (figure 2.4b). The distance of the two dye molecules for both versions of synaptobrevin increases by about 2.5nm when in SNARE complex compared to the isolated proteins. For SB96 28:72, the Cα-Cα distance from the crystal structure of the SNARE complex is 6.6nm, which compares well to our measurement of 7.0nm (Sutton, Fasshauer et al. 1998) (table 2.1). The published crystal structure of the SNARE complex only contained residues 25 to 93 of synaptobrevin, which prevents direct comparison to our Sb5:72 label site results but the trend of distance increase is consistent with the conformation of the complex.
versions of complexin (36:68 and CX 36:105) bound to membrane localized, unlabeled ternary SNARE complex (figure 2.4c). FRET from CX 36:68 bound to the SNARE complex was around 0.57, which converts to a distance between the dyes of ~5.05 nm. This result is different from the previously mentioned isolated complexin measurements (figure 2.2c; fret~0.773, distance~4.32nm), and compares favorably to the Cα-Cα separation of these residues (4.83 nm) from the crystal structure of complexin/SNARE complex (Chen, Tomchick et al. 2002) (table 2.1). FRET from CX 36:105 bound to the SNARE complex was around 0.57, which converts to a distance between the dyes of ~5.05 nm. These measurements of CX 36:105 bound to the SNARE complex are not dramatically different than the isolated complexin results (fret~0.61, distance~4.93nm). This is not surprising because complexin between residues 72 and 105 was not structured in the crystal structure, and a random polymer model for this domain is expected to be more appropriate.
2.3 Discussion of results
that the persistence lengths for SNAP-25 were considerably shorter than for the other proteins. We believe this is a unique method that can reveal differences in the disordered state of proteins that cannot be measured with other techniques. We propose that smFRET will be a useful tool to characterize the general category of proteins known as intrinsically disordered proteins.
Theoretical and computational methods have been the only methods thus far successfully applied to reveal differences among classes of intrinsically disordered proteins. Names have been applied to categorize these differences (unfolded, molten globule or folded), but quantitative experimental characterization has been lacking. Here we have found differences in a directly measured parameter of the disordered state, the persistence length – based upon distances derived by single-molecule fluorescence resonance energy transfer (smFRET) combined with interpretation using the worm-like-chain model (WLC) for isolated intrinsically disordered proteins under physiological conditions. Further, these signals change in predictable ways as the proteins fold to enter stable complexes that have been solved at high resolution. Further application of this method to a wider range of intrinsically disordered proteins will likely prove fruitful. In the next chapter, we extend this methodology to examine the flexible nature of an intermediate state formed by syntaxin and SNAP-25 along the pathway to full SNARE complex assembly.
2.4 Materials and Methods
Full length syntaxin-1a, SNAP-25, complexin 1, full length synaptobrevin II (SB), and synaptobrevin II (SB) fragment (residues 1-96) were expressed, purified, and labeled as described earlier(Bowen, Weninger et al. 2005). Briefly, all proteins were cloned into pet28a vector (Novagen), and expressed as hexa-His fusions and purified by metal affinity, ion exchange, and gel filtration chromatography. (see chapter 1, section 1.6.3 for further details)
synaptobrevin-II (1-96, and full length) (A5C/A72C, S28C/A72C) and complexin1 (E36C/D68C and CX E36C/105C) were created from cysteine-free templates by the QuickChange method (Stratagene).
Proteins were labeled with Alexa 555 and 647 maleimide (Invitrogen, Carlsbad, CA) using the protocols described earlier (Weninger, Bowen et al. 2003). The labeling efficiencies were typically greater than 80% except for the full length synaptobrevin which was ~50%. Alternating laser illumination was used to separate the proteins labeled with two donor dyes, two acceptor dyes, and exactly one donor and one acceptor dye. Only molecules with one donor and one acceptor dye were kept for further analysis.
Soluble proteins were immobilized at the quartz surface coated with biotinylated BSA-streptavidin layer by encapsulation in biotinylated liposomes. One mg of egg PC and 0.1% biotin PE were mixed in chloroform, dried under flowing argon gas to a thin film in a glass tube and kept in the vacuum for at least 1hr to remove the rest of the chloroform. Labeled proteins were diluted to about 10nM concentration with TBS (20mM Tris pH 8.0, 200mM NaCl or 2M NaCl with 1mM DTT) and then mixed with the dried lipids. Sonication or 1 minute incubation in a 37ºC water bath helps with initial formation of small liposomes following rehydration of the films. These mixtures are then passed through a 100nm pore size filter 21 times with the Mini-Extruder (Avanti Polar Lipids) followed by a size-exclusion chromatography on Sepharose CL4B (GE Healthcare Bio-Sciences, Piscataway,NJ) to remove the unencapsulated proteins.
tape was used to define the edges of a channel between the coverslip and the slide, which was finally sealed with 5-minute epoxy. For experiments with lipid bilayers, background contamination from the glue in the tape was avoided by forming all four edges of the channel between the slide and the coverslip with UV curing optical adhesive (Norland Products, Cranbury, NJ) (Bowen, Weninger et al. 2005).
To study full-length synaptobrevin tethered into lipid bilayers by its transmembrane domain, double-labeled full-length synaptobrevin was reconstituted into liposomes, which were used to form supported lipid bilayers in the flow cells by spontaneous fusion. For reconstitution, full-length synaptobrevin (40nM) in TBS containing 100mM β-d-octyl glucoside (βOG) was mixed at a 1:4 ratio with 30mg/ml liposomes (PC or PC with 15% PS) and incubated on ice for 20 minute. These mixtures were then diluted 1:1 with detergent free TBS at room temperature for 3 mins. Finally, liposomes were separated from detergent and unincorporated proteins using size-exclusion chromatography on a Sepharose CL4B column. Bilayers were formed by 15-minute incubation in the flow channel with full-length synaptobrevin containing liposomes (3mg/ml) followed by a second incubation with protein free liposomes (30mg/ml) for an hour at room temperature.
determine background subtracted signal levels. Molecules that close enough to locations containing molecules in the previous frame (usually less than 8 pixel steps) were considered to be the same particle and time trajectories were formed for the intensities of these events.
REFERENCES
Abels, J. A., F. Moreno-Herrero, et al. (2005). "Single-molecule measurements of the persistence length of double- stranded RNA." Biophysical Journal 88(4): 2737-2744. Bouchiat, C., M. D. Wang, et al. (1999). "Estimating the persistence length of a worm-like
chain molecule from force-extension measurements." Biophysical Journal 76(1): 409-413.
Bowen, M. E., K. Weninger, et al. (2005). "Single-molecule studies of synaptotagmin and complexin binding to the SNARE complex." Biophys J 89(1): 690-702.
Chen, X., D. R. Tomchick, et al. (2002). "Three-dimensional structure of the complexin/SNARE complex." Neuron 33(3): 397-409.
Dunker, A. K., I. Silman, et al. (2008). "Function and structure of inherently disordered proteins." Current Opinion in Structural Biology 18(6): 756-764.
Dyson, H. J. and P. E. Wright (2005). "Intrinsically unstructured proteins and their functions." Nat Rev Mol Cell Biol 6(3): 197-208.
Eliezer, D. (2009). "Biophysical characterization of intrinsically disordered proteins." Current Opinion in Structural Biology 19(1): 23-30.
Garza, A. S., N. Ahmad, et al. (2009). "Role of intrinsically disordered protein regions/domains in transcriptional regulation." Life Sci 84(7-8): 189-93.
Okumus, B., T. J. Wilson, et al. (2004). "Vesicle encapsulation studies reveal that single molecule ribozyme heterogeneities are intrinsic." Biophys J 87(4): 2798-806. Rivetti, C., M. Guthold, et al. (1996). "Scanning force microscopy of DNA deposited onto
mica: Equilibration versus kinetic trapping studied by statistical polymer chain analysis." Journal of Molecular Biology 264(5): 919-932.
Sutton, R. B., D. Fasshauer, et al. (1998). "Crystal structure of a SNARE complex involved in synaptic exocytosis at 2.4 A resolution." Nature 395(6700): 347-53.
Tokuriki, N. and D. S. Tawfik (2009). "Protein Dynamism and Evolvability." Science
324(5924): 203-207.
Uversky, V. N., J. R. Gillespie, et al. (2000). "Why are "natively unfolded" proteins unstructured under physiologic conditions?" Proteins 41(3): 415-27.
Weninger, K., M. E. Bowen, et al. (2008). "Accessory proteins stabilize the acceptor complex for synaptobrevin, the 1:1 syntaxin/SNAP-25 complex." Structure 16(2): 308-20.
Weninger, K., M. E. Bowen, et al. (2003). "Single-molecule studies of SNARE complex assembly reveal parallel and antiparallel configurations." Proc Natl Acad Sci U S A
Chapter 3
Accessory proteins stabilize the acceptor complex for
synaptobrevin, the 1:1 synataxin/SNAP-25 complex
Keith Weninger, Mark E. Bowen, Ucheor B. Choi, Steven Chu and Axel T.
Brunger
Published in:
3.1 Summary
Our study of a bound state of the syntaxin and SNAP-25 in 1:1 stoichiometry, which is an intermediate state on the SNARE complex assembly pathway, was published in the February 2008 issue of Structure. The entire copy of the publication is reproduced with permission in the appendix of this dissertation. Here I will briefly summarize the results in that paper.
Neurotransmitter release involves a series of steps where the synaptic vesicle docks to the plasma membrane in preparation for priming and triggered membrane fusion. SNAREs are the central machinery that is important in the docking and fusion of synaptic vesicle to the plasma membrane. The synaptic vesicle SNARE synaptobrevin and the plasma
membrane SNAREs syntaxin and SNAP-25 assemble into a tight ternary SNARE complex and bring the two membranes together. On the plasma membrane, SNAP-25 is unfolded until it meets its neighboring partner, syntaxin, and forms a binary complex, which is believed to assemble first and serve as an acceptor for the binding site of synaptobrevin in order to form a final, ternary SNARE complex. Until now, it has been difficult to characterize the 1:1 syntaxin/SNAP-25 binary complex due to its propensity to form the “dead-end” 2:1
(syntaxin/SNAP-25) complex when mixed in bulk solution. Here, we used a single molecule fluorescence approach of assembling the 1:1 complex of syntaxin and SNAP-25 by
Q20C/N139C, CC: K76C/Q197C, or NC: Q20C/Q197C), we monitored dynamic changes in smFRET efficiency levels of the binary complex prior to synaptobrevin binding. The
intermediate smFRET state was consistent with a two-helix bundle involving one of the two SNAP-25 SNARE domain (SN1 or SN2) bound to the SNARE domain of syntaxin with the other SNAP-25 domain dissociated (SX-SN1 or SX-SN2). We observed switching between stable intermediate and high smFRET states that demonstrate the dynamic nature of the binary complex. By adding synaptobrevin or other accessory proteins, the intermediate state could be shifted away from the two-helix state and towards the three-helix bundle (SX-SN1-SN2) configuration, eliminating the dynamic variability and giving stable high smFRET efficiency levels for label pairs in NN and CC of SNAP-25 and low smFRET efficiency levels for label pairs in NC of SNAP-25.
Specific contributions of co-authors on this published work: In this study, Keith
intermediate FRET state of the binary complex (Figure 5), and representative fluorescence intensity time traces for the 1:1 binary complex formed with doubly-labeled SNAP-25 (Figure S2). Steven Chu and Axel T. Brunger helped design and organize the experiment, interpret the results, and review the literature.
3.2 Accessory proteins stabilize the acceptor complex for synaptobrevin,
the 1:1 synataxin/SNAP-25 complex
Available online at http://www.cell.com/structure/fulltext/S0969-2126(08)00004-X or in Appendix.
3.3 Supplementary Content within this Article
Chapter 4
Single molecule FRET derived model of the
4.1 Introduction
Ca2+ induced membrane fusion of synaptic vesicles at synapses is the central phenomena that results in triggered inter-neuron signaling. The membrane protein synaptotagmin-1 (Syt1) is the Ca2+ sensor for synchronous neurotransmitter
release(Fernandez-Chacon and others 2001; Rhee and others 2005). Highly coordinated interactions among synaptotagmin, SNARE (soluble N-ethylmaleimide-sensitive factor attachment protein receptor) proteins and other neuronal factors are required to create robust and adaptive neural circuits(Brunger 2005; Rizo and Rosenmund 2008). Syt1 is primarily located on synaptic vesicles and contains two independent C2-type Ca2+-sensing
domains(Cho and Stahelin 2006) (C2A and C2B) that are connected by a linker (the fragment containing both domains is designated C2AB). Syt1 interacts with both anionic membranes and SNARE complexes, and both interactions are physiologically relevant(Fernandez-Chacon and others 2001; Pang and others 2006). However, the structure of the complex between synaptotagmin and SNAREs has remained elusive. Here we used single molecule fluorescence resonance energy transfer (smFRET) between synaptotagmin’s two C2 domains to determine that their configuration consists of mostly stable states with occasional
transitions, consistent with domains in random relative motion. SNARE binding results in narrowing of the intra-synaptotagmin FRET distributions consistent with significantly reduced conformational variability. We obtained an over-determined model of the
common molecular mechanism by which the Syt1-SNARE interaction plays a role in synaptic vesicle fusion.
4.2 Results
4.2.1 Arrangements of C2A and C2B for isolated C2A-C2B fragments in
solution
Because isolated C2A and C2B conformations are unchanged upon binding Ca2+, the relative arrangement of the C2 domains largely determines the C2AB
configuration(Fernandez and others 2001; Shao and others 1998; Shao and others 1997; Ubach and others 1998), which influences Syt1 function(Bai and others 2004) . We therefore introduced specific dye labeling sites into each of the C2 domains in the Syt1 C2AB
fragment (Fig. 4.1A) to allow FRET to report interactions between C2A and C2B. Individual doubly-labeled C2AB molecules were encapsulated within 100 nm diameter biotinylated liposomes that were tethered to a streptavidin-exposed biotinylated quartz surface or added in solution over supported lipid bilayers containing SNARE complex (Fig. 4.1A). smFRET efficiencies were measured as IA/(ID + IA) (using background and leakage corrected donor and acceptor intensities: ID and IA, respectively).
First we characterized C2AB conformations in the absence of the SNARE complex. C2AB with dyes attached at residues154 (C2A) and 383 (C2B) revealed FRET emissions at intermediate levels (0.57) that were stable for seconds (Fig. 4.1B). Measurements for many Ca2+ or EDTA exposed molecules were accumulated into histograms (Fig. 4.1C, left
4.2.2 Binding to the SNARE complex changes the conformation of
synaptotagmin
We next used smFRET to characterize the Syt1 conformation when interacting with the assembled SNARE complex (Fig. 4.1A). Syt1 bound minimally to protein-free,
phosphatidylcholine bilayers in both Ca2+ and EDTA buffers (Supplementary Fig. 1A -square). Syt1 bound robustly when preassembled, purified SNARE complexes were included in the bilayers via the syntaxin transmembrane domain (Figs. 4.1A and Supplementary Fig. 1A). The binding probability increased in presence of Ca2+ and decreased with increasing NaCl (Supplementary Fig. 1A), in agreement with other
reports(Tang and others 2006), and we found similar behavior for the interaction with binary SNARE complexes (Supplementary Fig. 1B). Bound state lifetimes in 50 mM NaCl were many seconds so this condition was used for all subsequent smFRET measurements. smFRET between the dyes in the C2A and C2B domains was measured for the SNARE complex bound synaptotagmin with the same label sites used for encapsulation studies (Fig. 4.1C, right column).
C2AB domain in solution. Attempting to limit possible inter-domain motions, we added bi-functional NHS-ester cross linker to the 154:383 sample before encapsulation. The width of the smFRET distribution for crosslinked Syt1 was significantly narrower than for the uncrosslinked Syt1 (Fig. 4.2A). We also performed control experiments in which both the donor and acceptor were positioned within the C2A domain (Figs. 4.2B,C, and
identical conformation to that observed in C2AB structures (Arac and others 2006). smFRET measurements of this control construct (label sites 140-154) revealed a dominant peak
centered at 0.63, consistent with C2A structures. This smFRET efficiency distribution did not change upon Ca2+ exposure or upon SNARE complex binding (Fig. 4.2B). The widths of the crosslinked 154:383 labeled synaptotagmin were close to the widths of the control
samples with labels in the same domain, supporting the notion that the wider histograms arise from fluctuating C2 domain arrangement. This interpretation is consistent with molecular dynamics simulations of C2AB fragments modeling both C2 domains as rigid bodies connected by a flexible linker (Supplementary Fig. 4). smFRET measurements of randomly fluctuating single stranded DNA reported similar well defined, but relatively broad, emission peaks(Joo and others 2006).
The repeatability of smFRET distribution peak position and width measurements was assessed for the 154:383 label pair (Figs. 4.2D,E). The smFRET peak location did not
Further suggesting the existence of multiple conformational states for Syt1, some molecules spontaneously transitioned between two or more non-zero FRET levels during the observation period (Figs. 4.1B (top left) and 4.2F). Ca2+-free Syt1 (containing EDTA) exhibited about twice as many transitions between intermediate and high FRET levels during a 100 second observation period compared to the experiment prepared with Ca2+ (Fig. 4.2F). SNARE complex binding significantly reduced the transitions. For control experiments with both dyes in C2A, switching was almost non-existent (<0.1%). Thus, FRET value switching in the C2AB spanning studies indicates a change in the interaction between the domains.
4.2.3 FRET between synaptotagmin and membrane localized SNARE
complex in PC bilayer
smFRET between C2AB Syt1 fragments and bilayer reconstituted ternary SNARE complexes (Fig. 4.3A) allowed determination of the configuration of that complex. The SNARE complex was labeled at two N-terminal sites (Fig. 4.3B, left column), a central site (Fig. 4.3B, center column), and two C-terminal sites (Fig. 4.3B, right column). Syt1 was labeled at a variety of sites in C2A, C2B and the linker between C2A and C2B (total of six sites, Fig. 4.3B, rows). We observed distinct populations of FRET levels that could be fit to sums of Gaussian functions centered at FRET values ranging from 0.1 to 0.9 that had widely variable widths spanning 0.11 to 0.44 (Supplementary Fig. 5C). We used the values at the centers of these Gaussian fits to represent distinct binding states. Fluorescence anisotropy, quantum yield and detection efficiencies must be known for the dyes conjugated to each
labeling site to confidently convert smFRET measurements to absolute distances. This is a challenging problem that is a topic of current interest (Muschielok and others 2008; Wozniak and others 2008). Here we used our control C2A FRET pair to empirically determine the FRET efficiency-to-distance conversion parameters as Ro = 5.55 nm and γ = 1
(supplementary notes).
4.2.4 A smFRET derived model of the synaptotagmin-SNARE complex on
PC bilayers
34 smFRET derived distances for Syt1 bound to the SNARE complex in the presence of 1 mM Ca2+ (30 label pairs between Syt1 and the SNARE complex and four label pairs within Syt1 C2AB) were used as target restraints for exhaustive docking calculations where the SNARE complex and the C2 domains were kept rigid, while the linker connecting the two C2 domains (residues 263-272) was flexible. The dye center positions relative to the corresponding rigid bodies were obtained from separate simulations and used as
pseudoatoms for the distance restraints in the docking calculations. Cluster analysis of the solutions that best fitted the smFRET-derived distances yielded a unique model of the complex (Fig. 4.3C) Our collaborators Axel Brunger, Marija Vrljic, and Pavel Strop at Stanford University performed all aspects of these simulations. Details of the simulations will be published elsewhere and only the final resulting model is presented here to support the subsequent discussion.
Figure 4.3. smFRET-derived model of the Syt1 - SNARE complex. (A) smFRET efficiency time traces and (B) smFRET histograms of labeled Syt1 – SNARE complex. We used combinations of six different single donor label sites in Syt1 (indicated in the left column) (residues 140 and 154 in C2A; residue 269 in the linker; residues 368, 383, and 350 in C2B) and single acceptor label sites in the SNARE complex (indicated on the top) at the N-terminus (SNAP-25 residues 20 and 139), C-terminus (SNAP-25 residues 76 and 197), and the center (synaptobrevin residues 61) of the SNARE complex. Circles indicate the smFRET efficiency values from which distances were derived for the docking calculations. (C) Among the solutions that best match the smFRET-derived distances emerged a unique model for Syt1 bound to the SNARE complex. Three rotated views are displayed. C2A is colored yellow, C2B is orange, SNAP-25 is green, synaptobrevin is blue, and syntaxin is red. The conserved arginine residues 398 and 399 in C2B are shown as red sticks, and the Ca2+ binding loops are colored red. The
simulation of the syt1:SNARE complex is over-determined with 34 independent distance measurements constraining 12 independent parameters in possible models (3 rigid bodies x (3 rotation + 3 translational degrees of freedom) – (6 over-counting for coupled motions in global translations/rotations) = 12 degrees of freedom). Simulations performed by Axel Brunger, Pavel Strop and Marija Vrljic at Stanford University.
the SNARE complex on the side that consists of the SNAP-25 helices. This positioning is consistent with the observation that the Syt1-383:Sb-61 label pair displayed the highest FRET of all pairs (Fig. 4.3B). The other label combinations support this interaction between C2B and the SNARE complex because docking calculations omitting distance assignments involving the Sb-61 or the Syt-383 label sites all resulted in similar models (data not shown). The Syt1 Ca2+ binding loops point away from the SNARE complex. The Ca2+-binding region of the C2A domain is more distant than that of the C2B domain from the SNARE complex which is in agreement with other biochemical studies that find stronger association between the SNARE complex and C2B compared to C2A(Chapman 2008) and C2B:SNARE complex binding in the absence of C2A(Dai and others 2007). This asymmetry of the C2 domain interactions with respect to the SNARE complex is also consistent with the observation that disrupting Ca2+ binding to the C2B domain impairs neurotransmitter release more strongly than with C2A(Fernandez-Chacon and others 2001).
One helix of Syt1 (residues 385-395) is directly positioned at the interface with the SNARE complex (Fig. 4.3C). The central region of the SNARE complex that mediates Syt1 binding (as predicted by our smFRET-derived model) is essential for proper
residues results in decreased synchronous neurotransmitter release in hippocampal
glutamatergic neurons(Xue and others 2008). These independent experimental assessments of the Syt1-SNARE interactions lend further credence to our smFRET-derived model.
4.3 Discussion
Our smFRET-derived model leaves the complexin-binding site on the SNARE complex unobstructed. Therefore the central complexin helix and synaptotagmin could simultaneously bind to the ternary SNARE complex with no apparent clash between them. Indeed, there is some in vitro evidence for simultaneous binding of Syt1 and
complexin(Chicka and Chapman 2009; Tokumaru and others 2009), although competitive binding has also been observed(Tang and others 2006). The complexin arrest model(Giraudo and others 2008; Tang and others 2006) suggests an intermediate state involving trans-SNARE complexes. However, the cis state of the trans-SNARE complex is used in all biophysical and biochemical experiments to date. In any case, our smFRET-derived model suggests that a clamp release may not consist of a displacement reaction but rather a distinct
conformational change that is triggered by the increased affinity of the Syt1 – SNARE interaction upon Ca2+ binding.
The general arrangement of the Ca2+ binding loops of SNARE-bound Syt1 is
differences between smFRET measurements of doubly-labeled Syt1 and Syt3 - supplemental notes). This convergent Ca2+ binding loop behavior suggests an evolutionary conserved molecular mechanism: The synaptotagmin-SNARE complex interaction (which exists even in the absence of Ca2+, Supplementary Fig. 1) recruits synaptotagmin to assembled SNAREs and restricts the conformational variability of the C2 domains by stabilizing a configuration that enables simultaneous membrane binding. This stabilization of synaptotagmin’s dynamic conformations upon SNARE binding that we have observed with smFRET is an example of the importance of conformational flexibility that likely applies to many other biomolecular interactions. The importance of such dynamic equilibriums among multiple conformations is increasingly recognized as an integral aspect for the function of many proteins (Henzler-Wildman and Kern 2007).