Optimization Studies on Surface Grinding
Process Parameters
B. Dasthagiri 1, Dr. E. Venu gopal Goud 2
P.G. Student, Department of Mechanical Engineering, GPR Engineering College, Kurnool, Andhra Pradesh, India1
Associate Professor, Department of Mechanical Engineering, GPR Engineering College, Kurnool, Andhra Pradesh,
India2
ABSTRACT: In the manufacturing sector, producing smooth surface finish plays an important role. To fulfill this smooth finish, surface grinding process is mostly used in which the parameters to be considered are surface quality and metal removal rate. Several factors which include depth of cut, wheel grade, wheel speed, material properties and table speed affects the machining process economics. This paper mainly focuses on developing the empirical models using response surface methodology for surface roughness and metal removal rate by considering control factors as wheel speed, table speed and depth of cut. The main objective of using Response surface methodology (RSM) on surface grinding operation of EN8 steel is to find optimum machining parameters which leads to minimize surface roughness and maximum metal removal rate. For metal removal rates (MRR) and Surface roughness, second order mathematical models were developed based on experimental results and the models are validated with F-test. Analysis of variance (ANNOVA) method was used to find the adequacy of the models based on their output responses. This paper makes an attempt in optimizing cutting parameters with the help of RSM using multi objective characteristics for the models.
KEYWORDS: Surface grinding, RSM, F-test, MRR, Optimization, Surface roughness.
I. INTRODUCTION
Grinding is a metal removing process performed with the help of grinding wheel. It is employed for finishing various parts such as engine crank-shafts, splined shaft, lathe guide ways, long pipes, worms, toothed gears, pinions, racks and surfaces. Surface grinding is the process of producing flat surfaces by means of revolving abrasive wheel. According to the shape of the table and its movement, surface grinding machines can be divided into two categories – planer type and rotary type. In planner-type surface grinders, the table is rectangular in shape and traverses under the wheel. In rotary – type surface grinders, the table is circular in shape and rotates under the wheel. According to the position of the spindle, surface grinder can also be classified as a) horizontal spindle and b) vertical spindle. The various parameters which influence the surface quality in surface grinding process are wheel parameters, work piece parameters, process parameters and machine parameters [1]. These parameters must be properly selected inorder to obtain desired surface finish and MRR [2].
The present work involves the development of second order mathematical models using Response surface methodology and Design of Experiments inorder to predict surface roughness and metal removal rate. Analysis of variance is employed to checking and validates the models. Design of Experiments (DOE) mainly focuses on the impact of variables which influence the quality of the product.
II. MATERIALS AND METHODOS
The present work involves the use of Response surface methodology (RSM) method as it is accurate, practical and easy for implementation. The method starts with conducting experiments and obtaining values. Then these experimental values were used to formulate second order mathematical models using regression analysis method. RSM procedure was implemented on those mathematical models for optimization in which the output responses were analyzed by various input machining parameters such as table speed, wheel speed and depth of cut.
DESIGN OF EXPERIMENTS (DOE)
To use the statistical approach in designing and analyzing an experiment, it is necessary for everyone involved in the experiment to have a clear idea in exactly what is to be studied, how the data are collected, and at least a qualitative understanding of how these data are to be analyzed.
Designing experiments for following steps 1. Recognition of statement of the problem. 2. Choice of factors, levels, and ranges. 3. Selection of the response variable.
4. Choice of experimental design. example L9, L18,L27 etc. 5. Performing the experiment.
6. Statistical analysis of the data. 7. Conclusions and recommendations.
RESPONSE SURFACE METHODOLOGY (RSM)
Response surface methodology (RSM) consists of a group of mathematical and statistical Techniques used in the development of an adequate functional relationship between a response of interest, y, and a number of associated control (or input) variables denoted by x1, x2..., xk.
The response surface methodology follows the main steps
1. Identification of controllable factors the influence the output responses such as Surface roughness, material removal rate.
2. The above data used to design the experimental matrix and conduct the experimental trails. 3. Mathematical models can be develop by using above data.
4. Predict the constant coefficients for model
5. Checking the developed model coefficients significance or not.
6. After significance ANNOVA technique used to test the developed model.
7. Influencing input parameters on surface roughness and material removal rate can be analyzed.
III.MATHEMATICAL FORMULATION
Multiple regression analysis used to develop the first order and second order models for surface roughness and material removal rate. Multiple regression models are related to optimized values of output responses based on the input factors.
The mathematical models can be represented like that
Y= f(A,B,C) (1)
Where,
Y is output response, A is Wheel speed, B is table speed, and C is depth of cut. The responses formulated in the mathematical models.
Material removal rate = K1Aa1Bb1Cc1e (2)
Surface roughness= K2Aa2Bb2Cc2e (3)
Where,
K1,K2 are constants and e is exponent
The logarithmic transformation can be performed in the mathematical model to linearisied as follows
ln MRR = lnK1 +lnAa1 +lnBb1 +lnCc1e (4)
ln Rs= lnK2 +lnAa2 +lnBb2 +lnCc2e (5)
(6)
(7) Before going to optimization the models were tested in the F-test and Chi-square test.
IV.EXPERIMENT DETAILS
Several experiments were conducted on surface grinding machine inorder to verify whether the output parameters such as surface roughness and metal removal rates varies or not with input machine parameters such as table speed, wheel speed and depth of cut. The specifications of machine and the material were as given in below table I. here the grinding wheel used was made of aluminium oxide abrasives with vetrified bond, AA 46/54K5V8. Table II was level of independent control factors. Orthogonal array was designed with the help of Design of Experiments (DOE) using three factors and three levels. The orthogonal array selected to conduct the experiments was L27 as shown in below table III. MRR was calculated as the ratio of volume material removed from the work piece to the machining time. The surface roughness, Ra was measured in perpendicular to the cutting direction using Surface Roughness tester SJ-201 at 0.8mm cutoff value. To evaluate the output response of surface roughness, six values were obtained and are averaged. These results will be used further to analyze the effect of input machining parameters on output responses with the help of RSM and DESIGN EXPERT V7.1.3 software.
TABLE I
MACHINING CONDITIONS
a) Work piece material: EN 8 steel
b) Chemical composition: Carbon 0.35-0.45, Silicon 0.10-0.35, Manganese 0.45-0.70, Sulphur 0.060 (max)/ Phosphorous 0.060(max) and balance Fe
c) Work piece dimensions: 300mm x 20mm x 20mm
d) Physical properties: Hardness-201 brinell, Tensile Strength-620 Mpa
e) Grinding wheel: Aluminum oxide abrasives with vitrified bond wheel AA46/54 K5V8 f) Grinding wheel size :180 mm OD x13 mm width x 31.75 mm ID
TABLE II
LEVELS OF INDEPENDENT CONTROL FACTORS
S. No Control Factor Symbol Level of factors Unit
-1 0 +1
1 Wheel speed A 1250 1650 2050 RPM
2 Table speed B 7.5 10 12.5 m/min
3 Depth of cut C 5 10 15 µm
TABLE III
EXPERIMENTAL OBSERVATIONS
Trail no Wheel speed (A)(RPM)
Table speed (B)(m/min)
Depth of cut (C)( µm)
Surface Roughness (Rs)( µm)
Metal Removal rate MRR(gm/min)
1 1250 7.50 5 1.034 5.510
3 1250 7.50 15 1.624 15.505
4 1250 10.0 5 1.324 7.350
5 1250 10.0 10 1.591 13.28
6 1250 10.0 15 1.721 22.07
7 1250 12.5 5 1.38 9.190
8 1250 12.5 10 1.679 16.89
9 1250 12.5 15 1.940 26.09
10 1650 7.50 5 1.180 6.260
11 1650 7.50 10 1.56 13.13
12 1650 7.50 15 1.684 17.68
13 1650 10.0 5 1.490 11.63
14 1650 10.0 10 1.641 15.61
15 1650 10.0 15 1.716 21.70
16 1650 12.5 5 1.501 12.42
17 1650 12.5 10 1.691 18.17
18 1650 12.5 15 1.826 25.87
19 2050 7.50 5 1.361 7.760
20 2050 7.50 10 1.582 13.21
21 2050 7.50 15 1.703 19.40
22 2050 10.0 5 1.460 10.35
23 2050 10.0 10 1.632 15.16
24 2050 10.0 15 1.805 24.16
25 2050 12.5 5 1.513 12.64
26 2050 12.5 10 1.734 22.44
27 2050 12.5 15 2.072 30.44
V. DEVELOPMENT OF EMPIRICAL MODELS
The relationship between the input factors and output responses used to develop the empirical models. After machining parameter optimization the empirical models can be used. The DESIGN EXPERT V7.1.3 software used to develop the second order models for the output responses. The obtained actual factors equations for surface roughness and material removal rate.
Surface roughness = -0.43936 +4.52743E-004 * wheelspeed +0.12451 * tablespeed +0.096960 * depthofcut- 1.90000E-005 * wheelspeed * tablespeed-1.25417E-005 * wheelspeed * depthofcut
+5.33333E-005 * tablespeed * depthofcut +5.90278E-009 * wheelspeed 2-2.27556E-003 * tablespeed 2-1.70222E-003 * depthofcut2
MRR = -2.70909 +3.52274E-003 * wheelspeed-0.18759 * tablespeed-0.21802 * depthofcut +3.56250E-004 * wheelspeed * tablespeed +6.81250E-005 * wheelspeed * depthofcut +0.10063 * tablespeed * depthofcut-1.11632E-006 * wheelspeed 2 +2.35556E-003 * tablespeed 2 +0.021522 * depthofcut 2
TABLE IV
ANOVA FOR RESPONSE SURFACE QUADRATIC MODEL OF SURFACE ROUGHNESS
Source Sum of
Squares Df Mean Square F Value
pvalueProb >F significant
Model 1.18 9 0.13 25.91 < 0.0001
A-wheelspeed 0.071 1 0.071 14.01 0.0016
B-tablespeed 0.26 1 0.26 51.67 < 0.0001
C-depthofcut 0.82 1 0.82 162.78 < 0.0001
AB 4.332E-003 1 4.332E-003 0.86 0.3675
AC 7.550E-003 1 7.550E-003 1.49 0.2383
BC 5.333E-006 1 5.333E-006 1.055E-003 0.9745
A2 5.352E-006 1 5.352E-006 1.059E-003 0.9744
B2 1.214E-003 1 1.214E-003 0.24 0.6304
C2 0.011 1 0.011 2.15 0.1608
Residual 0.086 17 5.054E-003
Cor Total 1.26 26
Std. Dev. 0.071 R-Squared 0.9321
Mean 1.59 Adj R-Squared 0.8961
C.V. % 4.48 Pred R-Squared 0.8017
PRESS 0.25 Adeq Precision 18.350
TABLE V
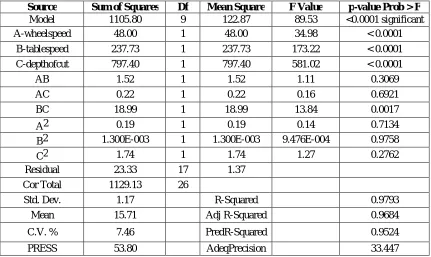
ANOVA FOR RESPONSE SURFACE QUADRATIC MODEL OF MATERIAL REMOVAL RATE
Source Sum of Squares Df Mean Square F Value p-value Prob > F
Model 1105.80 9 122.87 89.53 <0.0001 significant
A-wheelspeed 48.00 1 48.00 34.98 < 0.0001
B-tablespeed 237.73 1 237.73 173.22 < 0.0001
C-depthofcut 797.40 1 797.40 581.02 < 0.0001
AB 1.52 1 1.52 1.11 0.3069
AC 0.22 1 0.22 0.16 0.6921
BC 18.99 1 18.99 13.84 0.0017
A2 0.19 1 0.19 0.14 0.7134
B2 1.300E-003 1 1.300E-003 9.476E-004 0.9758
C2 1.74 1 1.74 1.27 0.2762
Residual 23.33 17 1.37
Cor Total 1129.13 26
Std. Dev. 1.17 R-Squared 0.9793
Mean 15.71 Adj R-Squared 0.9684
C.V. % 7.46 PredR-Squared 0.9524
Normal probability of resuduals of responses for surface roughness and material removal rate were plotted using RSM software as shown below in fig 1.
(a) (b)
Fig.1.Normal probability of residuals of responses (a) Surface roughness (b) Material removal rate
Predicted and actual values of surface roughness and material removal rate were plotted using RSM software as shown below in fig 2.
(a) (b)
Fig.2. Predicted and actual values of responses (a) Surface roughness (b) Material removal rate
VI.INTERPRETATION OF DEVELOPED MODEL
Effects of process parameters on Surface rougness:
The input parameters direct and interaction effects on output response1 Direct effects:
In the below fig.3. shows the direct effects of wheel speed, table speed and depth of cut on surface roughness. Fig.3. (a)shows that when the wheel speed increases reduce the surface roughness, (b) is shows the table speed effects on surface roughness when the table speed is faster the finishing is reduced then tool marks are shows on the work piece and (c) is shows depth of cut reduced surface roughness also reduced. Compare the all direct effects minimum surface roughness in smaller table speed , depth of cut and larger wheel speed.
(a) (b) (c)
Interaction effects on Surface roughness:
The three input parameters interaction effects on surface roughness shown on the 3D surface plots in fig 4. In each surface plots two control factors considered. Fig.4. (a)shows the good surface roughness in low table speed and medium wheel speed. (b) is shows the poor surface finish in low depth of cut and low wheel speed and also shown the non linearity in the graph . And in the (c) is shown the low depth of cut and low table speed improve the surface roughness.
(a) (b) (c)
Fig.4. Interaction effects on surface roughness (a) wheel speed and table speed,(b) wheel speed and depth of cut, and(c)table speed and depth of cut
Effects of Input parameters on Material removal rate: Direct effects
In the below Fig.5. shows the direct effect of input parameters on the material removal rate. Fig.5. (a) shown the wheel speed effect on MRR wheel speed ,where an additional parameters set aside in to mid value. (b) is shows the Depth of cut based material removal rate in high depth of remove high material. And in Fig.5.(c) is shows the table speed effects when the table speed increases improve the material removal rate. In the direct effects high range of material is removed all parameters are extreme range.
(a) (b) (c)
Fig.3.Direct effects of input factors on material removal rate (a)Wheel speed effects (b)Table speed effects(c) Depth of cut
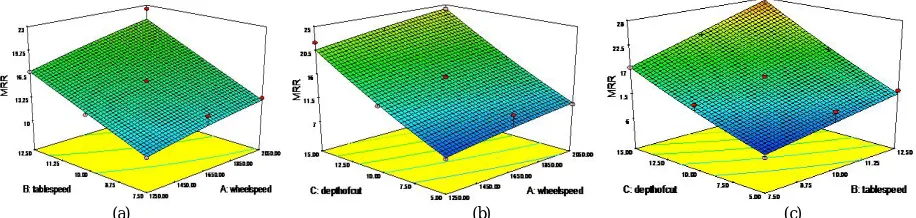
Interaction effects of material removal rate
(a) (b) (c)
Fig.6. Interaction effects on surface roughness (a) wheel speed and table speed,(b) wheel speed and depth of cut, and(c)table speed and depth of cut
VII. FORMULATION OF PROBLEM
In the process parameter optimization process, the main objective is to reduce the surface roughness and increase the material removal rate, which forms the multi objective optimization. The generated empirical model equations as given below are used.
Minimize
Surface roughness = -0.43936 +4.52743E-004 * wheelspeed +0.12451 * tablespeed +0.096960 * depthofcut- 1.90000E-005 * wheelspeed * tablespeed-1.25417E-005 * wheelspeed * depthofcut
+5.33333E-005 * tablespeed * depthofcut +5.90278E-009 * wheelspeed 2-2.27556E-003 * tablespeed 2-1.70222E-003 * depthofcut2
Maximize
MRR = -2.70909 +3.52274E-003 * wheelspeed-0.18759 * tablespeed-0.21802 * depthofcut +3.56250E-004 * wheelspeed * tablespeed +6.81250E-005 * wheelspeed * depthofcut +0.10063 * tablespeed * depthofcut-1.11632E-006 * wheelspeed 2 +2.35556E-003 * tablespeed 2 +0.021522 * depthofcut 2
Subject to
1250 RPM≤A≤2050 RPM
7.5 m/min≤B≤12.5m/min
5µm≤C≤15µm
Once the optimization of problem generated, then it was solved by using the response surface methodology.
VIII. OPTIMIZATION OF PROBLEM
Optimization of process parameters increases the effectiveness of the machining finances, a RSM is attempted using DESIGN EXPERT V7.1.3 software. The optimum results are show in the Table6.
TABLE VI
RSM OPTIMIZATION FOR OUTPUT RESPONSES
RESPONSES Objective
function Optimum values
Predicted response
Expected value
% of error
A B C
Surface
roughness RS Min 1250 7.5 5 1.1293 1.034 8.4
IX.RESULTS
The optimum results for the output responses namely surface roughness and Metal removal rate interms of machining parameters namely wheel speed, table speed and depth of cut on EN 8 steel on CNC surface grinding machine using DESIGN OF EXPERT V7.1.3 software were determined and presented in Table 6. From the results it can be observed that there is not much error between the experimental values and predicted values and that error is about 4 to 8 %. Thus the response optimization predicts the optimum conditions fairly well.
X. CONCLUSION
In this work an experimental investigation is carried out to predict the surface roughness and MRR parameters of EN 8 steel in surface grinding operation. The output responses considered for evaluating the results which are influenced by input parameters such as cutting speed, feed rate and depth of cut were obtained from the experiments and these were optimized using Response surface methodology. The empirical models of output parameters are established and tested through the analysis of variance to validate the adequacy of the models. It is found that the surface roughness and MRR parameters greatly depend on work piece materials. A response surface optimization is attempted using DESIGN OF EXPERT V7.1.3 software for output responses in surface grinding.
REFERENCES
[1] E.-S Lee*, Baek A study on optimum grinding factors for aspheric convex Surface micro-lens using design of experiments, International
Journal of Machine Tools & ManufactureVol.47,PP.509-520,2007.
[2] Sanjay Agarwal, P.Venkateswara Rao* Experimental investigation of surface subsurface damage formation and material removal
mechanisms in SiC grinding. International Journal of Machine Tools & Manufacture,Vol.48, PP.698-710,2008.
[3] Paulo R.Aguiar, Carlos E.D.Cruz, Wallace C.F.Paulaand Eduardo C. Binanch Predicting surface Roughness in Grinding using Neural
Networks ISBN 78-953- 7619-16-9, pp.472, October 2008.
[4] J.Xie* Y.W.Zhuo, T.W. Tan Experimental study on fabrication and evaluations of micro pyramid–structured silicon surface using a V-tip of
diamond grinding Wheel. science direct Vol., 35 pp.173-182,2011.
[5] Deepak Pal, Ajay Bangar, Rajan Sharma, Ashish Yadav Optimization of Grinding parameters for Minimum Surface Roughness by Taguchi
Parameteric Optimization Technique International Journal of Mechanical and Industrial Engineering (IJMIE), ISSN No. 2231 –6477, Volume-1, Issue-3, 2012
[6] M.Janardhan1 and A.Gopala Krishna2 Multi-Objective Optimize of Cutting Parameters for surface Roughness And Metal Removal Rate in
surface Grinding Using Response Surface Methodology ,IJAET,Vol.3,Issue 1,PP.270-283, ISSN:2231-1963, March 2012
[7] C.Vilaa*,H.R.SillerbC.A. Rodriguezb, G.M.Bruscasa,J.Serranoa have studied About economical and technological study of the surface grinding
versus face Milling in hardened AISI D3 steel machining operations.,precision engineering Vol.138 pp.,273-283, apr-2012.
[8] Mustafa Kernal Kiilekcy Analysis of process parameters for a surface-grinding Process based on the taguchi method. MTAEC9 ISSN 1580 –
2949 MTAEC9, Vol.47(1)PP. 105,2012.
[9] Foeckerer*,M.F.Zaeh, O.B.Zhang, O.B.Zhang have studied a three-dimensional Analytical model to predict the thermo-metallurgical effects
within the surface Layers during grinding and grind-hardening Vol.,56, pp.223-237,2012.
[10] Chen Haifeng, Tang Jinyuan*, Zhou Wei Modeling and predicting of surface Roughness for generating gear Journal of Materials Processing
Technology Vol.,213 ,pp.717-721 DEC 2012.
[11] Lijohn P George*, K Varughese Job**, I M Chandran** study of surface Roughness and it prediction in cylindrical grinding process based on
tagauchi Method of optimization. International Journal of Machine Tools & Manufactur, Volume 3, Issue 5, ISSN 2250-3153,2013
[12] 1Pawan Kumar,2Anish Kumar, 3Balinder Singh Optimization of process Parameters in surface Grinding using Response Surface Methodology,
IJRMET Vol.3, Issue 2, ISSN : 2249-5770, May –Oct 2013.
[13] J.l.Jiang a,P.Q Gea.b*, W.B.Bia,L.Zhanga, D.X. Wangaa Y.Zhanga have been Focued on the 2D/3D ground surface topography modeling.,
International Journal of Machine Tools & Manufacture Vol74, Pp29-40,2013.
[14] G.Manimarana,*,M.Pradeep Kumarb, R.Venkatasamya have studied the effects of cryogenic cooling on surface grinding of stainless steel 316
International Journal of Machine Tools & ManufactureVol., 59, PP -76-83, Dec 2013.
[15] T.Siebrecht*,S.Rausch,P.Kersting, D.Biermann have studied the grinding Process simulation of free-formed WC-C0 hard material coated