Evolution
of Multilocus Genetic Structure in
Avena hirtula and
Avena barbata
R. W. Allard,**'
P.Garcia,? L. E. Saenz-de"ierat and M. Perez de la Vega?
*Department of Genetics, University of Calqornia, Davis, Calqornia 95616, and TDepartamento de Genitica, Facultad de Biologia, Universidad de Ledn, 24071 Ledn, Spain
Manuscript received May 17, 1993
Accepted for publication August 26, 1993
ABSTRACT
Avena barbata, an autotetraploid grass, is much more widely adapted than Avena hirtula, its diploid
ancestor. We have determined the 14-locus genotype of 754 diploid and 4751 tetraploid plants from
10 and 50 Spanish sites, respectively. Allelic diversity is much greater in the tetraploid (52 alleles)
than in the diploid (38 alleles): the extra alleles of the tetraploid were present in nonsegregating
heteroallelic quadriplexes. Seven loci were monomorphic for the same allele (genotypically 11) in all
populations of the diploid: five of these loci were also monomorphic for the same allele (genotypically
11 1 I ) in all populations of the tetraploid whereas two loci each formed a heteroallelic quadriplex ( I 122) that was monomorphic or predominant in the tetraploid. Seven of the 14 loci formed one or
more highly successful homoallelic and/or heteroallelic quadriplexes in the tetraploid. We attribute
much of the greater heterosis and wider adaptedness of the tetraploid to favorable within-locus
interactions and interlocus (epistatic) interactions among alleles of the loci that form heteroallelic
quadriplexes. It is difficult to account for the observed patterns in which genotypes are distributed
ecogeographically except in terms of natural selection favoring particular alleles and genotypes in
specific habitats. We conclude that natural selection was the predominant integrating force in shaping
the specific genetic structure of different local populations as well as the adaptive landscape of both
the diploid and tetraploid.
A
VENA barbata Pott ex Link ( A b ) is an annual, predominantly self-fertilizing tetraploid grass (2n= 4x = 28 chromosomes) derived by polyploidization
from the diploid (2n = 2x = 14 chromosomes) Avena
hirtula Lag.-Avena wiestii Steud. complex (LADIZINSKY and ZOHARY 1968; RAJHATHY and THOMAS 1974). A . hirtuEa ( A h ) and A. wiestii ( A w ) are, respectively, the
Mediterranean and desert ecotypes of a single biolog-
ical species; the two ecotypes sometimes occur in
mixed stands with each other and/or with Ab. Plants
of Aw are typically small and slender whereas plants
of Ah and especially Ab are usually larger and more
robust. However, the three taxa are so similar mor-
phologically that it is difficult to assign individuals unambiguously to a single group on morphological
grounds alone. F, hybrids between Ah and Aw have
regular meiosis (seven bivalents) and they are fully fertile. Meiosis is chaotic, however, in the rare triploid
F1 hybrids that result from natural intercrosses be-
tween the diploids and the tetraploid and the F1
hybrid plants are nearly completely sterile; it therefore
seems likely that Ab has been largely isolated repro-
ductively from the two diploid taxa since it originated
by polyploidization.
Cytogenetic studies have shown that Ab forms 14
bivalents at meiosis with greatest regularity which
versity of California, Davis, California 95616. Genetics 135: 1125-1 139 (December, 1993)
' Present address: Department of Agronomy and Range Sciences, Uni-
indicates that homoeologous pairing is suppressed in
this near autotetraploid. LADIZINSKY (1973) has pre-
sented evidence suggesting that the suppression of
pairing is due to a simple genetic mechanism that limits pairing to homologs of the same genome. Re-
cent genetic studies of segregation patterns of allo-
zyme variants (e.g., HUTCHINSON et al. 1983a, 1983b;
HAKIM-ELAHI and ALLARD 1983) have established
that Ab behaves genetically as a fully diploidized tetra-
ploid, i.e., pairing is fully preferential within each of
the two sets of seven pairs of homologous chromo- somes and that no exchange of genetic materials oc- curs between corresponding chromosomes of the two homoeologous sets.
Ah and Aw are indigenous over the Mediterranean
Basin, where they typically form small, sparse, disjunct
stands. Ah is more common in coastal regions adjacent
to the Mediterranean Sea and Aw is more common on
the fringes of the North African and Middle Eastern
deserts (Aw has not been observed in Spain). Ab is
ubiquitous throughout the Mediterranean Basin and across the Middle East to Nepal. It thrives over a wide
range of environmental conditions encompassing arid
sites with shallow soils to well-watered sites with deep fertile soils. It often occurs in massive stands of mil- lions of plants in undisturbed sites as well as in dis-
turbed sites, e.g., along roadsides and in cultivated
Mediterranean-like climates throughout the world. Ab is thus much more widely adapted, vigorous and suc- cessful in covering vast regions more or less continu- ously than its diploid progenitor.
Historical records indicate that Ab was introduced
unintentionally to California from southwestern Spain (ROBBINS 1940; GARCIA et al. 1989) during the periods
of exploration and colonization and that it spread
rapidly, soon becoming a major component of the
vegetation and a prized range grazing and wild hay species in all areas with Mediterranean-like climates
(ROBBINS 1940). Studies of the population biology of
Ab in California and Oregon (e.g., CLECG and ALLARD
1972, 1973; HAMRICK and ALLARD 1972; ALLARD et
al. 1972; MILLER 1977; HAMRICK and HOLDEN 1979;
HAKIM-ELAHI 1980; HUTCHINSON 1982; PIAERO
1982; P. D. CLUSTER and R. W. ALLARD, unpublished
data), in Israel (KAHLER et al. 1980), in Spain (GARCIA
et al. 1989; PEREZ DE LA VEGA, GARCIA and ALLARD
199 1 ; GARCIA et al. 199 1) and in the Mediterranean
Basin and the Middle East (PETERS 1989;
R.
W. AL-LARD, unpublished data) have established that this
species is presently differentiated into a number of
ecotypes, each marked by a specific combination of alleles of 15 or more Mendelian loci that code for discretely recognizable morphological, allozyme and rDNA variants. These multiallelic configurations are distributed ecogeographically in patchwork patterns that are precise overlays of environmental heteroge- neity, especially heterogeneity for available moisture
and for temperature. In California each multilocus
allelic configuration is monomorphic, or very nearly
so, within its favored habitat. However, in boundary
areas where two or more different habitats form areas
of interface with each other (e.g., along the margins
of steams or in low areas that receive runoff water),
polymorphism is the rule for the majority of loci. T h e
genotypes of most individuals found within such pol- ymorphic zones are identical to those of plants in the
two (sometimes more) adjacent interfacing areas; how-
ever, some individuals in the polymorphic zones have
genotypes made up of mixtures of alleles characteristic
of adjacent monomorphic areas: gametic disequili-
brium values are near maximal in such areas (e.g.,
ALLARD et al. 1972; HAMRICK and HOLDEN 1979).
T h e extent of the polymorphic zones expands and
contracts from year to year with fluctuations in various environmental factors, especially available moisture.
Also, the frequencies of different multilocus geno-
types often shift strikingly within the polymorphic zones in step with year-to-year fluctuations in environ-
mental factors, e.g., shifts from near fixation of geno-
types favored in arid habitats to near fixation of
genotypes favored in mesic habitats, and vice versa, often take place in a single generation when a year of abundant rainfall follows a year of severe drought. Overall, the evidence is compelling that particular
alleles of single loci, and more particularly specific
multilocus genotypes, are under very strong selection and that selection is capable of rapidly reorganizing the multilocus structure of local populations to meet
stresses imposed by short-term environmental
changes.
Comparisons of present day Spanish and Califor- nian gene pools on a locus-by-locus basis have shown that the two gene pools are closely similar to each other in allelic composition and in allelic frequencies
(GARCIA et al. 1989). However, multivariate analyses
have established that the two gene pools are very
differently structured on a multilocus basis and that both rainfall and temperature have statistically signif- icant effects on multilocus genetic structure in Spain
(PEREZ DE LA VEGA, GARCIA and ALLARD 1991), as in
California. Spanish rainfall-temperature combinations are, however, very numerous and they often inter-
grade over short distances so that patterns of associa-
tion between habitats and genotypes are often difficult
to identify. In the present study we determined the
14-locus allozyme genotypes of A h and Ab plants col-
lected in 10 and 50 Spanish sites, respectively, repre-
senting a number of distinctive ecogeographical re- gions extending from the northern plateau to south- ern Spain. The observed population genotype of each
region differed from that of each other region and
that of each site from that of each other site. The intricate patchwork patterns in which genotypes are
associated with different regions and with different
sites within regions lead us to the conclusion that natural selection favoring particular genotypes in dif- ferent environments was the primary determinant of the ecogeographical distribution of genetic variability
in both A h and A b as well as the internal genetic
structure of each population. Earlier studies have established that several evolutionary factors in addi- tion to selection, including mutation, diploidized te-
traploidy (in A b ) , the mating system of predominant
self-fertilization, and frequent short- and long-dis-
tance migrations among populations, have also played
significant roles in shaping genetic structure on both micro- and macrogeographical scales in these widely distributed species. However, among these evolution- ary factors only natural selection favoring different
genotypes in different environments acts direction-
ally. We therefore conclude that natural selection has
been the primary guiding force in shaping the internal
multilocus genetic structure of populations and the
adaptive landscape of both A h and Ab throughout the
range of both species. The arrays of 14-locus geno- types found in recently established colonial popula-
tions of A b in California and Oregon are, however,
completely different from those of the ancestral Span-
ish populations. This leads us to the further conclusion
FIGURE 1 .-Geographical locations of 10 populations of A. hirtula (A-I) and 50 populations ofA. barbata (1-50). A , Alcob- endas; B, Bilmez; C, Plasencia; D, Km 56; E, La Tabla; F, Mirida; G , Ciceres; H, Punta Umbria; I, Universidad; J, Valverde; 1 , Agricolas 83; 2, Agricolas 84; 3, Agrico- las 85; 4, AndGjar; 5, Arcos de la Frontera; 6 , Astorga; 7, Bailin; 8, Bijar; 9, Bilmez;
10, Benavente; 1 1, Berja; 12, Carmona; 13, C-323; 14, Ecija; 15, Huelva; 16, Isla Cris- tina; 17, Jain; 18, Jerez de la Frontera; 19, Km 56; 20, La Baiieza; 21, La Encina; 22, La Palma del Condado 84; 23, La Palma del Condado 85; 24, Las Cabezas de San Juan; 25, L e h ; 26, Marchena; 27, Medina- Azahara; 28, Montilla; 29, Mor6n de la Frontera; 30, N-342A; 31, N-342B; 32,
Ponferrada; 33, Sahaghn; 34, Salamanca; 35, Santa Ollala: 36, Sevilla A; 37, Sevilla B; 38, Ubeda 84; 39, Ubeda 85; 40, Villa- maiiin; 41, Zafra; 42, Zamora; 43, Saldaiia; 44, Herrera de Pisuerga; 45, Alar del Rey; 46, Osorno; 47, Calzada de Los Molinos; 48, Monz6n de Campos; 49, Lerma; 50, Aranda de Duero. C.N.P., Central North- ern Plateau; P.N.P., Peripheral Northern Plateau.
genetic structures into novel structures that improve adaptedness.
MATERIALS AND METHODS
The materials of this study were 754 plants of A h and 4751 plants of Ab collected in the sites shown in Figure 1. Most sites were occupied by thousands to tens of thousands of plants; hence, it is unlikely that random genetic drift had significant effects in shaping genetic structure within sites. Sampling was confined to a fairly central area about 100 m2, containing -3000 plants, that appeared to be most typical of each site. A single panicle was taken from about
100 randomly chosen plants located about 1 m apart on a grid pattern within the sampling area. A single seed was sown from each panicle and the resulting seedlings were assayed for 14 allozyme loci following electrophoretic pro- cedures described in GARCIA et al. (1989). Designations of loci and alleles follow those of HUTCHINSON et al. (1 983a) and GARCIA et al. (1989). However, to simplify discussion and to reduce the size of tables we have abbreviated the code for each allele to a single digit, e.g., the code for allele
100 of each locus (the relative migration distance in mm of the first allele to be discovered at each locus) is 1, the code for the second allele to be discovered is 2, and so forth. Genotypes of Ah and Ab reflect their allelic composition, e.g., 11 denotes the 100 100 homoallelic (homozygous) du- plex of the diploid whereas l l l l and 1122 denote, respec- tively, the homoallelic (homozygous) 100 100 100 100 and the heteroallelic but homozygous 100 100 101 101 quadri- plexes of the tetraploid. In Tables 5 and 6 the genotypes of the tetraploid have been further abbreviated to two digits, e.g., 11 1 1 and 1122 are denoted by 11 and 12. Previous studies have shown that all populations of Ah and Ab are heavily self fertilizing and that all individuals are homozy- gous at a great majority of loci. Heterozygotes of all of the
loci of this study are either two-banded or three-banded in the diploid and hence each allele can be distinguished un- ambiguously; we accordingly included the 13 heterozygotes in our sample of 754 diploid plants in estimating allelic frequencies but excluded these 13 individuals in estimating frequencies of homozygous diploid genotypes. In contrast three types of heteroallelic quadriplexes of the tetraploid have such closely similar electrophoretic phenotypes that progeny testing is required to distinguish among the types. As an example, the electrophoretic phenotype of the non- segregating 100 100 104 104 double homozygote of the dimeric locus Prxl cannot be distinguished with certainty from the electrophoretic phenotypes of the 100 104 100 100 or 100 100 100 104 single heterozygotes, or from the
100 104 100 104 double heterozygote (ALLARD, MILLER and KAHLER 1978). However, it is known from previous studies that the combined frequencies of the three segregat- ing genotypes is of an order of 50-fold to 100-fold smaller than that of the true-breeding homozygote. We conse- quently did not attempt to identify the segregating geno- types by progeny testing but scored all heteroallelic quadri- plexes as double homozygotes; our estimates of the frequen- cies of nonsegregating heteroallelic quadriplexes given in Tables 1-3, 5 and 6 may thus be slightly biased on the high side.
RESULTS AND DISCUSSION
Allard et al.
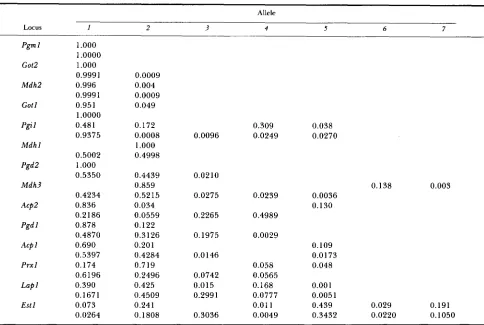
TABLE 1
Allelic frequencies" in diploid and tetraploid Spanish wild oats
Allele
Locus I 2 3 4 5 6 7
Pgm I
Got2
Mdh2
Got 1
Pgi 1
M d h l
Pgd 2
M d h 3
Acp2
Pgd I
Acp 1
Prxl
Lap 1
E s t l
1
.ooo
1.oooo
1.ooo
0.9991 0.996 0.999 1 0.951 1.oooo
0.481 0.93750.5002 1.000 0.5350
0.4234 0.836 0.2186 0.878 0.4870 0.690 0.5397 0.174 0.6196 0.390 0.1671 0.073 0.0264
0.0009 0.004 0.0009 0.049
0.172
0.0008 0.0096 1.000
0.4998
0.4439 0.0210
0.859 0.5215 0.034 0.0559 0.122 0.3 126 0.201 0.4284 0.719 0.2496 0.425 0.4509 0.241
0.309 0.038
0.0249 0.0270
0.138 0.003 0.0275 0.0239
0.2265 0.4989
0.1975 0.0029
0.0 146
0.058 0.0742 0.0565
0.015 0.168
0.2991 0.0777 0.01 1
0.0036 0.130
0.109 0.0173 0.048
0.001 0.0051
0.439 0.029 0. 19 '1
0.1808 0.3036 0.0049 0.3432 0.0220 0.1050
The top number in pairs of numbers in each row gives the allelic frequency in A h for one of the 14 allozyme loci whereas the bottom number in each pair gives the allelic frequency in Ab. Allelic frequencies for alleles 8 , 9 and 1 0 of Estl (not given in the body of the table) are 0.0073, 0.0048 and 0.0017, respectively, in Ab. Allele 8 of E s t l was present in Ah in frequency 0.007, but alleles 9 and 10 were not present. Allele frequencies are based on assays of 754 plants (1,508 alleles) A h and 4,751 plants (19,004 alleles) in Ab.
ish sites. Locus M d h 2 differed slightly: the genotype
was 11 for 75 1 plants and 22 for three plants (allelic
frequencies 0.996:0.004 overall in Spain); nine sites
were monomorphic for duplex 11 and one site was
polymorphic for duplexes 11 and 22 (allelic and gen-
otypic frequencies 0.96:0.04 at this site). T h e above five loci have been either completely monomorphic,
or very nearly so, in all other diploid populations that
have been sampled in the Mediterranean Basin and
Middle East (PETERS 1989; GARCIA et al. 199 1 ; R. W.
ALLARD, unpublished data). T h e predominant alleles
of each of these five loci apparently code for some
essential function such that they confer superior sur- vival ability relative to all other alleles that have arisen
during the evolutionary history of the Ah-Aw complex.
Evidently, none of the other alleles that have arisen in the diploid at these loci have been competitive with
the predominant allele and none has survived except
in inconsequential frequencies (e.g., allele 2 of M d h 2 ) .
Present frequencies of alleles thus appear to provide
a biologically meaningful measure of long-term sur- vival values in the diploid of all alleles of these five
loci. We consequently take the long-term survival
values of the predominant alleles of loci P g m l , G o t 2 ,
P g d 2 , M d h l and M d h 2 to be effectively 1.00 and the long-term survival values of all other alleles that have arisen at these loci through mutation to be very close to zero in each of the 10 Spanish populations sampled, as well as throughout the range of distribution of the diploid. T h e selective values of the mutants are, how- ever, not necessarily close to zero although they are almost certainly lower on average than those of the surviving alleles.
T h e pattern of allelic variability differs for G o t l .
Although allele 1 of this locus is present in high
frequency (f = 0.951) overall in Spain (Table l), a
second electrophoretically detectable allele (allele 2 )
is present in one site and it was in fact more frequent
at that site (f = 0.712) than allele 1 (f = 0.288). Thus,
present frequencies indicate that the long-term overall
survival values of alleles 1 and 2 of Gotl are approxi-
mately 0.95 and 0.05, respectively, in the environ- ment of Spain and that the long-term survival values of all other alleles than have arisen at this locus over
the centuries are close to zero. Allele 2 and less
Multilocus Evolution in Avena 1129
found in occasional populations throughout of range
of distribution of the Ah-Aw complex, always in poly-
morphic association with allele 1 . Thus, alleles 2 and
3 are apparently not always mere morbid transients
on their way to elimination by selection but they may contribute to overall population adaptedness in some habitats.
Patterns of within-site allelic variability in Spain and elsewhere in the Mediterranean Basin and Middle East
are similar to that of G o t l for four additional loci,
Mdh3, Acp2, Pgdl and A c p l . In Spain (Table 1) one allele of each of these four loci was present in high
frequency (0.6
<
f<
0.9) and this most frequent alleleoverall was predominant or fixed in most sites. How-
ever, some sites were polymorphic for a second and
sometimes for a third or fourth allele and one or
another of these additional alleles was sometimes pre-
dominant or even fixed in occasional sites. This pat-
tern of allelic variability suggests that a single allele of each of these four loci is nearly universally superior
but that environments exist in which the long-term
survival values of other alleles are superior to the
usually predominant allele. T h e presence of two or
more alleles of a single locus at some sites suggests that polymorphism may improve overall population fitness at those sites.
The four remaining loci, P g i l , P r x l , L a p 1 and E s t l ,
are extensively polymorphic (four to seven electro-
phoretically distinct alleles) in the diploid in Spain
(Table 1). Three or more alleles of each of these loci
were present in at least intermediate frequency in
about half of the Spanish sites, as well as elsewhere
throughout the range of the diploids. Evidently, the
population genotypes that lead to optimum popula-
tion fitness in most sites feature mixtures of alleles of these four loci.
Turning to Ab, it is apparent from Table 1 that
allelic diversity is much greater in the tetraploid (52
alleles) than in its diploid progenitor (38 alleles).
Thirty-four of the 38 alleles present in Ah were also
present in Ab but 18 alleles not present in the Ah were
present in Ab. Each of these 18 alleles appeared in the
tetraploid as one of the pair of alleles present in
nonsegregating heteroallelic quadriplexes; thus, the increased allelic diversity in the tetraploid relative to the diploid was consistently associated with formation of heteroallelic quadriplexes made up of at least one allele not present in the diploid. It is not possible for alleles that d o not exist in the diploid to be incorpo-
rated into the tetraploid during episodes of polyploid-
ization of diploid plants. Hence, contrary to widely
held supposition, it seems likely that most heteroallelic
quadriplexes stem from mutations that occurred in
tetraploid Ab subsequent to its formation from Ah by
chromosome doubling. Locus P g d 2 serves as a model
for the sequence of events that may have led to greater
allelic diversity in Ab than Ah. T h e diploid Ah-Aw
complex is monomorphic for allele 1 of Pgd2; conse-
quently, the original quadriplex of P g d 2 formed by
chromosome doubling of a 11 duplex plant was almost
certainly genotypically 11 11. Theory indicates that
the chance that any mutant, including adaptively ben- eficial mutants, will become established in either a
diploid or autotetraploid population is very small,
especially in small populations (FISHER 1930; HAL-
DANE 1936; LI 1955). However, population sizes are
usually much larger in Ab than in Ah and it is likely
that large numbers of novel mutants have appeared
over time in one or the other of the two genomes of
Ab, including individuals with genotype 11 12 or 121 1
for locus P g d 2 . One-fourth of the selfed progeny of
such singly heterozygous individuals are expected to
be the highly heterotic nonsegregating 1 1 2 2 quadri-
plex. T h e probability is thus much higher that such mutants would be incorporated into the tetraploid than the diploid and that this highly heterotic quad- riplex would quickly sweep through the species, soon
achieving its modern frequency o f f = 0.84 (Table 2).
Subsequent mutations in the near-ubiquitous 1 1 2 2
quadriplex might, in similar manner, have produced the 2233 and 2222 quadriplexes of P g d 2 , both of which found relatively small niches in which they were
able to survive (Table 2).
Patterns of quadriplex formation differed for most
of the 14 loci of this study (Tables 1 and 2). Three of
the completely or nearly completely monomorphic
loci of the diploid ( P g m l , G o t 2 , M d h 2 ) formed only
homoallelic quadriplexes that were completely or very nearly completely monomorphic for the same alleles
as the diploid. G o t l , which is monomorphic for duplex
11 in most populations of the diploid, but polymorphic
for duplexes 11 and 22 in occasional populations, is
monomorphic for homoallelic quadriplex 11 11 in Ab;
evidently allele 2 does not contribute to adaptedness
of the tetraploid under any environmental conditions.
In contrast, locus M d h l , which is completely mono-
morphic in Ah, formed a single heteroallelic quadri-
plex ( 1 1 2 2 ) , that is monomorphic in all populations
of Ab; clearly favorable interactions between alleles I
and 2 of M d h l contribute to the superior adaptedness
of Ab in all environments. Locus Pgd2, which is also
completely monomorphic in Ah, is similar to MdhI in
that it formed a highly successful heteroallelic quad-
riplex ( 1 1 2 2 , f = 0.84) but differs from M d h l in that
it also formed two homoallelic quadriplexes in the
tetraploid, one ( 1 1 1 1 ) moderately successful (f = 0.12)
and the other (2222) much less successful (f = 0.004).
T h e most successful quadriplexes of loci P g d l , M d h 3
and Acpl are also heteroallelic but one of the alleles involved is infrequent in the diploid (not absent as
with M d h l and P g d 2 ) . T h e pattern for Acp2 was still
different in that this locus formed a highly successful
heteroallelic quadriplex ( 3 3 4 4 ) from two alleles, nei-
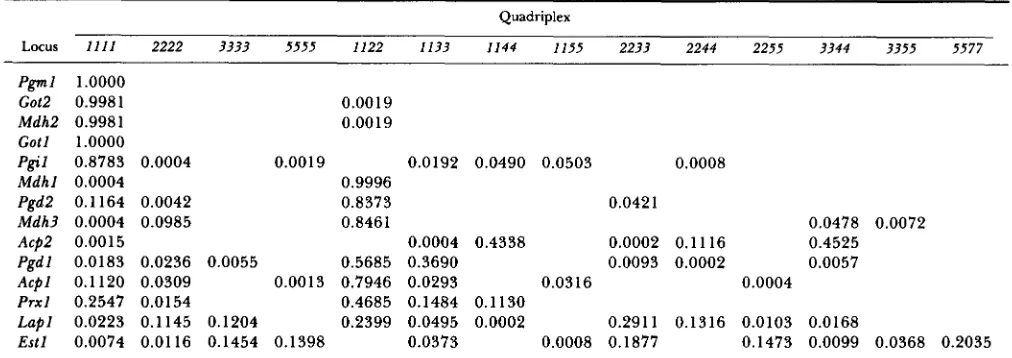
TABLE 2
Quadriplex frequenciesa in Spanish A. barbata
Quadriplex
LOCUS 1111 2222 3333 5555 1122 1133 1144 1155 2233 2244 2255 3344 3355 5577
Pgml 1.0000
Got2 0.9981 0.0019 Mdh2 0.9981 0.0019 Got1 1.0000 Pgil 0.8783 0.0004 0.0019 0.0192 0.0490 0.0503 0.0008
Mdhl 0.0004 0.9996 Pgd2 0.1 164 0.0042 0.8373 0.0421 Mdh3 0.0004 0.0985 0.8461 0.0478 0.0072 Acp2 0.001 5 0.0004 0.4338 0.0002 0.1 116 0.4525 Pgdl 0.0183 0.0236 0.0055 0.5685 0.3690 0.0093 0.0002 0.0057 Acpl 0.1120 0.0309 0.001 3 0.7946 0.0293 0.0316 0.0004 Prxl 0.2547 0.0154 0.4685 0.1484 0.1 130
Lapl 0.0223 0.1145 0.1204 0.2399 0.0495 0.0002 0.2911 0.1316 0.0103 0.0168
Estl 0.0074 0.0116 0.1454 0.1398 0.0373 0.0008 0.1877 0.1473 0.0099 0.0368 0.2035
Quadriplex frequencies not reported in the body of the table are: Lapl 4444 (0.0034), Estl 6666 (0.0017), 7777 (0.0025), 10101010 (0.0017), 2266 (0.0034), 3366 (0.0335), 3377 (0.0015), 3399 (0.0097), 5566 (0.0038), 5588 (0.0147).
alleles of this heteroallelic quadriplex evidently arose
by mutation in Ab. The patterns for loci P r x l , L a p l
and Estl were all similar in that each locus formed several moderately successful homoallelic as well as several heteroallelic quadriplexes from alleles that were generally moderately successful in the diploid.
The pattern for P g i l was unique: allele 1 , the most
frequent in the diploid (f = 0.481), formed a homoal-
lelic quadriplex ( 1 11 1 ) that was much more successful
(f = 0.88) in Spain (also throughout the range of
distribution of A b ) than its homoallelic duplex ( 1 1 )
counterpart in the diploid. Alleles 2 and 5 formed less
successful homoallelic quadriplexes and allele 1 com-
bined with alleles 2, 3 and 5 to form heteroallelic
quadriplexes in Ab; however, these heteroallelic quad-
riplexes were highly successful only locally (one site
each).
The above results show that homoallelic (homozy-
gous) duplexes are the primary unit of allelic function in the diploid: heteroallelic (heterozygous) duplexes
are too infrequent (f
=
0.01) to have much effect onimmediate population fitness and selfing evidently reduces even the most heterotic heteroallelic (heter- ozygous) duplexes to very low frequency within a few generations. However, nonsegregating quadriplexes stabilized by fully preferential chromosome pairing within each of the two genomes are the primary unit of allelic function in the tetraploid. The majority of successful quadriplexes are heteroallelic: heteroallel- ism clearly increases the number of alleles of single loci that can be deployed simultaneously in adaptive
diversifications within single individuals. Increased
allelic diversity also has secondary implications involv-
ing two types of interactions that have potentially
large effects on adaptedness and survivability: (1) in- teractions in the tetraploid among alleles of the same
locus (intralocus interactions) completely stabilized
through diploidized tetraploidy (ALLARD, MILLER and
KAHLER 1978);
(2)
interlocus (epistatic) interactions in both diploid and tetraploid among alleles of differ-ent loci stabilized in various degrees by the mating
system of nearly complete selfing (ALLARD 1975). We
now examine geographical distributions for evidence concerning the direct and indirect effects of specific duplexes and quadriplexes on adaptedness under dif- ferent environmental conditions in Spain.
Geographical distribution of allozyme duplexes and quadriplexes: In examining associations between genotypes and environments it is convenient to rep-
resent long-term survival values, which are correlated
with present frequencies, in the form of topographic
maps (WRIGHT 1932, 1951, 1965). In constructing
topographies we plotted all duplexes or quadriplexes
of a single locus as points on a plane Cartesian coor- dinate system. The ordinate erected at each point within a given site was the observed frequency of the duplex or quadriplex at that site. Thus, the locus was represented on a surface above the base plane by one or more points reflecting the present frequency (long- term survival value) of the duplexes or quadriplexes
of the locus in each site. Fourteen single-locus topo-
graphies (one per locus) were constructed for A h and
also for Ab; 10 collection sites were represented on
each topography for the diploid and 50 for the tetra-
ploid. The topographies are too extensive to report in full; consequently, we have prepared a summary of
the distribution data in tabular form (Table 3) from
which the main features of the topographies can be inferred (duplexes and quadriplexes present in fre-
quencies c 0 . 0 2 are omitted from this table).
The topographies fall into five groups. Group I
Multilocus Evolution
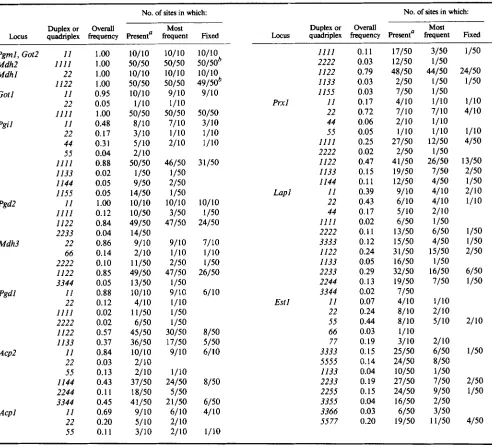
TABLE 3
Geographical distribution of allozyme duplexes and quadriplexes
No. of sites in which Locus quadriplex Frequency Present" Frequent Duplex or Overall Most Fixed
Pgml, Got2 Mdh2
Mdh 1
Got I
Pgil Pgd2 Mdh3 Pgdl Acp2 Acpl I 1
1 1 1 1 22 1122 I 1 22 1111 1 1 22 44 55 1111 1133 1144 I155 I 1 1111 1122 2233 22 66 2222 1122 3344 11 22 1111 2222 I122 1133 11 22 55 1144 2244 3344 I 1 22 55
1 .oo
1 .oo
1
.oo
1 .oo 0.95 0.051
.oo
0.48 0.17 0.3 1
0.04 0.88 0.02 0.05 0.05 1 .oo 0.12 0.84 0.04 0.86 0.14 0.10 0.85 0.05 0.88 0.12 0.02 0.02 0.57 0.37 0.84 0.03 0.13 0.43 0.1 1
0.45 0.69 0.20 0.1 1
10/10 50/50 10/10 50/50 10/10 1/10 50/50 8/10 3/10 5/10 2/ 10
50/50 1 /50 9/50 14/50 10/10 10/50 49/50 14/50 9/10 2/10 11/50 49/50 13/50 lO/lO 4/10
1 1 /50 6/50 45/50 36/50 10/10 2/10 2/10 37/50 18/50 41/50 9/10 5/10 3/10 10/10 50/50 10/10 50/50 9/10 1/10 50/50 7/10 1/10 2/10 46/50 1/50 2/50 1/50 lop0 3/50 47/50 9/10 1/10 2/50 47/50 1 /50 9/10
1/10
1 /50 1 /50 30/50 17/50 9/10 1/10 24/50 5/50 2 1/50 6/10 2/10 2/ 10
10/10 50/50b 10/10 49/50b 9/10 50/50 3/10 1/10 1/10
3 1/50
10/10 1 /50 24/50 7/10 1/10 1/50 26/50 6/10 8/50 5/50 6/10 8/50 6/50 4/10 1/10
No. of sites in which
Locus quadriplex frequency Present" Frequent Duplex or Overall Most Fixed
Prxl
Lap1
Est 1
1 1 1 1 2222 I122 1133 1155 I 1 22 44 55 1 1 1 1 2222 1122 1133 1144 1 1 22 44 1 1 1 1 2222 3333 I122 1133 2233 2244 3344 1 1 22 55 66 77 3333 5555 1133 2233 2255 3355 3366 5577
0.1 1 0.03 0.79 0.03 0.03 0.17 0.72 0.06 0.05 0.25 0.02 0.47 0.15 0.1 1 0.39 0.43 0.17 0.02 0.1 1 0.12 0.24 0.05 0.29 0.13 0.02 0.07 0.24 0.44 0.03 0.19 0.15 0.14 0.04 0.19 0.15 0.04 0.03 0.20
17/50 3/50 12/50 1/50 48/50 44/50 2/50 1/50 7/50 1/50 4/10 1/10 7/10 7/10 2/10 1/10 1/10 1/10 27/50 12/50
2/50 1/50 41/50 26/50
19/50 7/50 12/50 4/50 9/10 4/10 6/10 4/10
5/10 2/10 6/50 1/50 13/50 6/50
15/50 4/50 31/50 15/50
16/50 1/50 32/50 16/50 19/50 7/50
1/50 4/10 1/10
8/10 2/10 8/10 5/10 1/10
3/10 2/10 25/50 6/50 24/50 8/50
10/50 1/50 27/50 7/50
24/50 9/50 16/50 2/50
6/50 3/50 19/50 1 1/50
1/50 24/50 1/50 1/10 4/10 1/10 4/50 13/50 2/50 1 /50 2/10 1/10 1/50 1/50 2/50 6/50 1/50 2/10 1/50 2/50 1/50 4/50
a Present in frequency 2 0 . 0 2 .
*
Population 15 of Ab included nine plants (f = 0.09) with quadriplexes Got2 1122 and Mdh2 1122 and population 9 of Ab included two plants (f = 0.04) with quadriplex M d h l 1 I 1 1.monomorphic for the I 1 duplexes and I I I I quadri-
plexes in all 10 diploid and all 50 tetraploid sites. The single-locus topography of each of the three loci of
group I features a single monolithic column (relative
height 1.00) located at sites A-I and 1-50, respec-
tively. Two-locus and three-locus topographies for
P g m l , Got2 and Mdh2 feature identical two-element
or three-element columns at each site. This result
indicates that these three loci, whether considered
singly or jointly, have identical survival values in all
Spanish sites sampled and that no epistatic interactions
occur among loci in either the diploid or tetraploid
genetic backgrounds. Group I1 includes the I I and
22 duplexes of Pgd2 and M d h l whereas group 111
includes the 1 I I I and I122 quadriplexes of Got1 and
M d h l , respectively. All of these duplexes and quadri-
plexes are monomorphic at all sites (A-I, 1-50); thus,
each single-locus topography features an identical monolithic column at each site, indicating that the survival values are identical at all Spanish sites sam- pled. However, the topographies of these duplexes
and quadriplexes, unlike those of group I, differ in
the diploid and tetraploid: the I
I
duplex of Pgd2 ismonomorphic in the diploid but this locus is polymor-
phic for its quadriplexes in the tetraploid, the I122
quadriplex of Mdhl is heteroallelic, and duplex
I I
ofduplexes and quadriplexes, it does so identically in all 10 diploid and all 50 tetraploid sites. This is surprising because most of the sites differ widely respecting
various environmental factors (e.g., rainfall, tempera-
ture, slope, edaphic features) that have large differ- ential effects on the survival values of most of the
duplexes of the group IV and the quadriplexes of
group V loci.
Group IV is made up of the 27 duplexes of the nine loci that are polymorphic in at least one of the 10 diploid sites (Table 3; only duplexes present in overall
frequency 20.02 are listed in this table). Locus G o t l
is monomorphic for duplex I 1 in nine sites but poly-
morphic for duplexes I 1 and 22 (f = 0.288:0.712) in
one site (site B). T h e topography for G o t l thus fea-
tures a single monolithic column (height 1 .OO) at nine
sites and one two-element column (heights 0.288 and
0.712) at site B. Survival of duplexes
I I
and 22 inpolymorphic association at this site implies that a mixture of the two duplexes, rather than fixation of
either duplex I
I
or 22, gives optimum fitness, i.e.,that mixture increases the carrying capacity of the site above levels that would prevail if the site were occu-
pied by either duplex I 1 or 22 alone. Mechanisms
that have been proposed for such enhancement of
fitness include: (1) site patchiness, including patches
that favor duplex I I and patches that favor genotype
22; (2) that different genotypes (say
I
I
and 2 2 ) makedifferent and/or nonsimultaneous demands on limit-
ing resources (e.g., water) such that each genotype
obtains more resources when it grows in intimate
association with other genotypes than it would in pure
stand. ALLARD and ADAMS (1969) have presented experimental evidence that supports hypothesis 1 in some cases and hypothesis 2 in other cases.
T h e topography of locus Pgil is more typical of the
nine loci of group IV than that of Gotl (the topogra-
phy of G o t l is by far the least complex topography of
the group IV loci). T h e topography of Pgil is char-
acterized by single monolithic columns in five sites
(duplex I 1 fixed in sites B, D, E, duplex 44 fixed in
site F, and duplex 22 fixed in site J), two two-element
columns (duplexes I
I
and 22 polymorphic in site Hand duplexes I I and 44 in site A), and three three-
element columns (duplexes 11,55 and 44 polymorphic
in sites G and I; duplexes
I I ,
22 and 44 polymorphicin site C ) . T h e topographies of the nine loci of group
IV thus indicate, in contrast to those of the loci of
groups I, I1 and 111, that the survival abilities of
specific duplexes as well as those of mixtures of du-
plexes differ from site to site, i e . , that interactions
among genotypes and environments have complex
effects on fitness. Among the 90 (9 X 10) locus-by-site
combinations of the Group IV loci, 49/90 (54%) were
monomorphic and 41/90 (46%) were polymorphic,
suggesting that monomorphism for a single duplex
led to optimum fitness slightly more frequently than mixtures of two more duplexes.
Group V is made up of 43 quadriplexes of the nine loci that are polymorphic in at least one of the 50
tetraploid sites (Table 3). T h e numbers of sites in
which the various quadriplexes appeared and their
frequencies in the 50 sites varied widely. A few of the quadriplexes were found in only one of the 50 sites (e.g., quadriplexes I133 of Pgil and 2222 of P r x l ) whereas other quadriplexes were widely distributed (e.g., quadriplex I
I I I
of Pgil was present in all 50 sites, most-frequent in 46/50 and fixed in 3 1/50 sites).In contrast, quadriplex 1133 of Pgil was found only
in site 8 (f = 0.97, polymorphic with quadriplexes
2222 and 111
I
in f = 0.02 and 0.01, respectively).This suggests that site 8 is unique regarding some
environmental factor or factors that affect long-term survival ability. T h e sites in which a given quadriplex was found were often clustered within given regions.
As an example quadriplex 5577 of Est1 was found in
only two regions, the northern plateau and south-
western Spain. In the northern plateau quadriplex
5577 was fixed or most frequent in eleven sites (43-
48, 33, 1, 2, 25, 50) and it was in intermediate
frequency (f = 0.26) in site 3. It was present in low
frequencies in five sites in Southwestern Spain clus-
tered in the Provinces of Ciidiz (site 5 , f = 0.01),
Sevilla (site 26, f = 0.06), C6rdoba (site 28, f = 0.03;
site 27, f = 0.14) and Jakn (site 4, f = 0.01). T h e many
cases in which quadriplexes were associated nonran-
domly with sites located within environmentally simi-
lar regions provide evidence that particular quadri-
plexes are well adapted in some regions and in some specific sites within regions whereas other quadri- plexes are better adapted in other regions and sites.
T h e nine-locus topographies of the loci of group V differ from those of loci of groups I-IV in two major ways: (1) they are consistently much more complex,
indicating that interactions among genotypes within
sites are more intricate than in groups I-IV; and (2) the topographies differ more from site to site, indicat-
ing that genotype-environment interactions are also
much more complex. Among the 450 (9 X 50) locus
X site combinations, 175 (39%) were monomorphic
and 275 (61 %) were polymorphic (Table 3); evidently,
monomorphism for a single quadriplex led to opti-
mum fitness in about 1/3 and polymorphism in about 2/3 of cases. As in the diploid, within-site environ- mental patchiness and/or favorable interactions among genetically different plants may have been responsible for enhancement of fitness in the poly-
morphic populations. However, a different type of
interaction, not available in the diploid, is possible in the tetraploid, namely heterotic within-cell or within-
tissue interactions among different molecular prod-
Multilocus Evolution in Avena
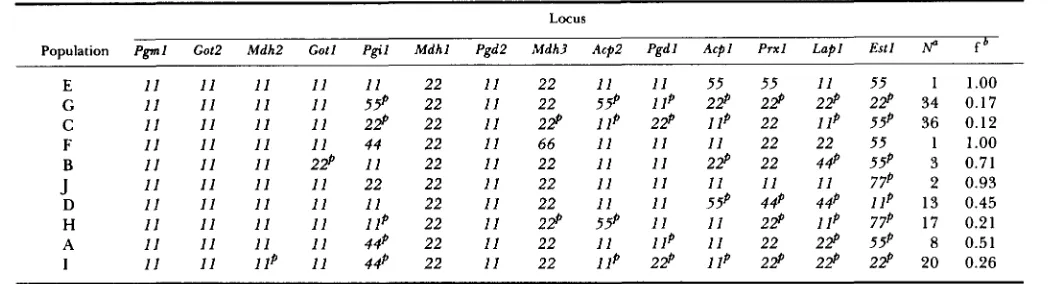
TABLE 4
Most-frequent 14-locus genotypes in 10 populations of Ah
Locus
Population Pgml Got2 M d h 2 Gofl Pgil M d h l M d h 3 P g d P Acp2 P g d l Acpl P r x l Lapl Estl N" f b
E 1 1 1 1 1 1 1 1
1 1 22 1 1 22 1 1 1 1 55 55 I 1
G 1 1 1 1 1 1 1 1 5 5 p 22 I 1 22 5 5 p 1 I P 2 9 2 9 2 9 C 1 1 I 1 1 1 1 1 2 9 22 1 1 2 9 11P 22p 11P 22 I l P
B 1 1 1 1 1 1 2 9 1 1 22 1 1 22 1 1 1 1 2 9 22 4 4 p
J
1 1 1 1 1 1 1 1 22 22 1 1 22 1 1 1 1 I 1 I 1 I 1D I 1 1 1 1 1 1 1 1 1 22 1 1 22 1 1 1 1 5 5 p 4 4 p 44Q
H 1 1 1 1 1 1 1 1 P 1 1 22 1 1 2 9 5 4 1 1 I 1 2 9 1 l Q
A 1 1 1 1 1 1 4 4 p 1 1 22 1 1 22 1 1 11P 1 1 22 2 9 I 1 1 1 1 11P 1 1 44Q 22 1 1 22 1 I P 2 9 1 I P 2 9 2 9
F 1 1 1 1 1 1
1 1 44 22 1 1 I 1 66 1 1 I 1 22 22
a Number of 14-locus genotypes observed at each site. Frequency within site of the most frequent 14-locus genotype.
Site polymorphic for 14-locus genotypes due to polymorphism at loci indicated.
55 1 1.00 2 9 34 0.17
55p 36 0.12
55 1 1.00
55p 3 0.71
77p 2 0.93
1 l P 13 0.45
55p 8 0.51 2 9 20 0.26
7 7 p 17 0.21
sity stabilized by diploidization in the tetraploid ap- parently not only allows for increased exploitation of
favorable intralocus interactions but also increases
opportunities for increased exploitation of epistatic
interactions among alleles of different loci. In the
diploid, e.g., in a plant genotypically 1 1 for L a p l and
55 for E s t l , no heteroallelic intralocus interactions are
possible (excluding rare heterozygotes, e.g., L a p l 12,
resulting from rare outcrosses) and only one epistatic
interaction is possible, 1 1 X 55. However, in the
tetraploid, e.g., in a plant genotypically 2 2 3 3 for L a p l
and 5577 for E s t l , two intralocus interactions (22 X
33 and 55 X 77) and four pairwise interlocus (epistatic)
interactions are possible ( 2 2 X 55, 2 2 X 77, 33 X 55
and 33 X 77); four of the six combinations were present in the Spanish populations in significant fre-
quencies (Tables 2 and 3), indicating that these four
interactions were favorable. Many higher-order inter- actions are also possible. In the next two sections we examine the frequencies of the 14-locus genotypes in different diploid and tetraploid sites to identify inter- locus combinations that have been successful in Spain and intralocus and interlocus combinations that have
been successful in Ab in Spain and in California.
Geographical distribution of 14-locus genotypes in Ah: In total, 107 14-locus genotypes were observed
in the 10 populations of Ah. Comparisons of the arrays
of 14-locus genotypes present in the 10 sites showed
that the population genotype at each site differed
from that at each other site. T h e data are too extensive
to be reported in full; however, the main features of
within-population as well as interpopulational differ-
entiation can be deduced from Table 4, which lists
the single most-frequent 14-locus genotype (presum- ably the best adapted genotype at each site) and also identifies the monomorphic and polymorphic loci in each population. Two populations (E, F) were mono-
morphic at all 14 loci, i e . , only one 14-locus genotype
was present (f = 1.00) in each population. T h e 14-
locus genotype of these two populations differed at
five loci ( P g i l , M d h 3 , A c p l , P r x l , L a p l ) . Obviously,
all of the genetic differences between populations E
and F were interpopulational and none were intrapo-
pulational. Within-population 14-locus genotypic di-
versity varied from very small for population J (only
two 14-locus genotypes present in f = 0.93 and 0.07,
respectively) to substantial for populations G, C, H
and I (several 14-locus genotypes present, the most
frequent in f 2 0.26). However, among-population
variability was larger than within-population variabil- ity even in these most variable diploid populations. T h e within-population genetic structure of each of the 10 diploid populations differed from that of each other population and each population was sharply differentiated from each other populations, evidently
due to different selective pressures imposed by differ-
ences in environment at the several sites. Taking into account the very large population sizes at each site,
and the frequent and extensive migrations among
sites, it seems likely that very little of the observed genetic differences within or among populations re- sulted from genetic drift.
Multivariate log-linear analyses (FIENBERG 1980;
ZHANG, SAGHAI MAROOF and ALLARD 1990) of the
full diploid data set (SAENZ DE MIERA 1989) showed
that disequilibrium values are high in all 10 popula- tions and that all loci of this study are tied together through complex networks of overlapping two-locus,
three-locus and higher-order epistatic interactions. Al-
ternatively, the lower-order interactions may be a
consequence of the full 14-locus structure or the
structure of the entire genome. T h e mating system of
Ah is favorable for the development and maintenance
to heterozygosity, segregation and recombination that produces novel interlocus allelic combinations upon which continued evolutionary change depends; it also allows migrant alleles and new mutants to be inte-
grated quickly into the population genotype. The 99%
of selfing causes all loci, whether located on the same or different chromosomes, to behave as if they are linked with crossover values 1 0 . 0 1 , thus restricting recombination sufficiently to protect favorable inter-
locus combinations from being broken up by segre-
gation before they can be integrated into the popula-
tions (ALLARD 1975). Populations E and F provide
examples of populations in which disequilibrium val- ues are maximal for all 14 loci (only one 14-locus genotype present but a different one in each popula- tion). Disequilibrium is near maximal in three popu-
lations (A, B, D) and high in the five remaining
populations.
Geographical distribution of 14-locus genotypes in Spanish and Californian populations of
A b
Ap- plications of discrete log-linear techniques to analysesof associations among the allozyme loci with each
other and with environmental factors ( P ~ R E Z DE LA
VEGA, GARC~A and ALLARD 1991) have shown: (1)
that disequilibrium values are high among the 14
allozyme loci in Ab; (2) that the 14 loci are tied
together through overlapping two-locus, three-locus and higher-order interactions or as a consequence of
the full 14-locus structure or the structure of the
entire genome; (3) that differences in rainfall and
temperature affect multilocus genetic structure at
two-locus and higher-order levels. Comparisons of the arrays of 14-locus genotypes show that the population
genotype of each of the 50 populations of Ab differed
from that of all other sites. T h e number of 14-locus
genotypes observed in Ab (>440) is much larger than
in Ah and the data are far too extensive to be reported
in full. However, the main features of intrapopula-
tional genetic diversity can be deduced from Table 5
in which are given the most-frequent 14-locus geno-
type and its frequency in each site; Table 5 also lists
the 14-locus genotypes that are monomorphic within
each of the five principal habitats in which Ab occurs
in California and Oregon.
T h e most clear-cut regional pattern in Spain is that of the cold high-elevation (850-950 m) central north-
ern plateau region. It can be seen from Table 5 that
the same 14-locus genotype was most-frequent in each of the seven sites (43-48, 33) of that region (Figure 1). This regionally most-frequent 14-locus genotype was monomorphic in population 43 and nearly mon- omorphic in population 45; these two populations occupy some of the highest and/or most exposed among the seven sites of the region. T h e frequency of this regionally most-frequent genotype dropped off at lower elevations and in less-exposed sites and its frequency fell to 0.68 in site 46. In areas peripheral
to this central region in the northern part of the
Spanish Meseta (plateau) the frequency of this 14-
locus genotype fell to 0.56 in site 25, located to the
westward of the central region, and it was entirely
absent in sites 1, 2 and 3 located a few km to the west
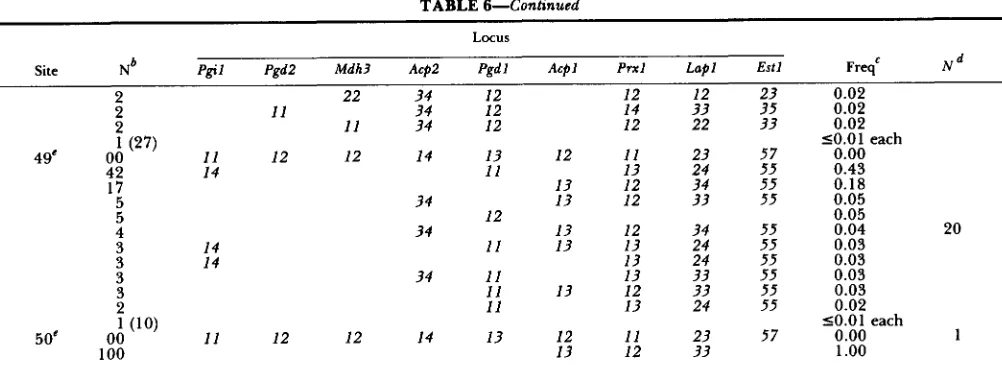
of site 25, and in sites 49 and 50 located to the
southeast of the central region at slightly lower ele- vation (-800 m). This pattern suggests that this par- ticular 14-locus genotype confers superior adapted- ness under the coldest conditions but that it is a less effective competitor under the more temperate con-
ditions of peripheral areas. In sites 1 and 2 the pre-
dominant 14-locus genotype of the central northern plateau was replaced as the most-frequent genotype by a 14-locus genotype (Tables 5 and 6) that differed
from the “cold-tolerant” genotype only at locus Acp2
(quadriplex 3344 replaced quadriplex 1144); this gen-
otype was also third most-frequent (f = 0.24) in site 3
(Table 6). However, several other 14-locus genotypes differing from the “cold tolerant” genotype at five to seven loci were also present in populations 1, 2 and 3
(Table 6); thus, the apparently slight changes in envi-
ronment that occurred in the transition from site 25 to sites 1, 2 and 3 were evidently responsible for the major restructuring of the 14-locus population geno- type in the latter sites. Environmental conditions at the sites occupied by populations 6 and 32, located in west-central and extreme western Le6n province, re-
spectively, are very different from each other and also
from those of sites 1, 2 and 3: population 6 occupies
a cold infertile site (elevation
=
870 m) whereas thesite occupied by population 32 (elevation z 540 m)
lies in a fertile well-watered valley in which Ab occurs
in dense lush stands. Population 6 is monomorphic
for a single 14-locus genotype (f = 1 .OO); however, 39
different 14-locus genotypes are present in population
32 in f
>
0.01 (the single most-frequent genotype ispresent in f = 0.20). Evidently, natural selection sorted
out a particular 14-locus genotype that is uniquely
adapted under the harsh environmental conditions of
site 6 and also integrated many different 14-locus
genotypes into a complex unified entity that provides optimum adaptedness in the more benign environ-
ment of site 32.
Each of the 14 populations extending from site 40 (Province of Le6n) southward along the western bor- der of Spain to population 16 (Province of Huelva) occupies a site that is very different environmentally
from each other site (elevation varies from 960 to 7
m; rainfall, temperature, edaphic and other charac-
teristics also vary widely from site to site). Within-site 14-locus genotypic variability was small in nearly all of these 14 populations: only one 14-locus genotype
(f = 1 .OO) was present in site 2 1 and a single 14-locus
genotype was predominant (f 2 0.50) in nine popula-
tions (8, 20, 19, 34, 23, 10, 40, 41, 22). Only popu-