Research Article
CODEN: IJPNL6
FORMULATION AND
IN-VITRO
EVALUATION OF SUSTAINED RELEASE MATRIX
TABLETS OF LEVOFLOXACIN
Satyabrata Bhanja*
1, Parthasarathi Mishra
1, Sudhakar Muvvala
1, Arun Kumar Das
2*
1Malla Reddy College of Pharmacy, Maisammaguda, Dhulapally (Post-ViaHakimpet),
Secunderabad-500014
2
Malla Reddy Pharmacy College, Maisammaguda, Dhulapally (Post-ViaHakimpet),
Secunderabad-500014
*Corresponding author e-mail:
[email protected]
ABSTRACT
The present study aimed to formulate and evaluate sustained release matrix tablets of
levofloxacin to achieve sustained drug release with reduced side effects and improved patient
compliance. Different batches of sustained release matrix tablets of levofloxacin were prepared
by direct compression method using HPMC, sodium CMC and sodium alginate as polymers,
Avicel PH 102 (MCC) as filler and starch as binder. The prepared tablets were evaluated for
hardness, weight variation, friability, drug content uniformity,
in vitro
drug release,
in vitro
drug
release kinetics and Acceralerated stability studies.
It was found average hardness of the tablets
to be in range 6.7± 0.04 to 7.7 ± 0.35 kg/cm2. The friability of the prepared tablets was found in
the range
of 0.005±0.034 to 0.6±0.035 %. The uniformity of drug levofloxacin present in tablets
formulation ranged from 96.84 ± 0.16 to 98.87 ± 0.34%. The
in vitro
drug release was studied by
using pH 1.2 acidic buffer for 24 hours. Among all twelve formulations F1 to F12, the best
formulation F4 was found to be 99.5% drug release in 24 hours which showed the sustained
action drug release. The formulations F1 to F12 followed first order release kinetics with non
fickian diffusion mechanism.
Keywords:
Sustained release, matrix tablets, levofloxacin and
in vitro
drug release.
INTRODUCTION
The controlled release drug delivery systems are aimed at controlling the rate of drug delivery, sustaining the duration of therapeutic activity and/ or targeting the delivery of the drug to a tissue[1] .Such dosage form not only increase patient compliance due to reduction in frequency of dosing, but they also reduce the severity and frequency of side effects, as they maintain substantially constant blood levels and avoid fluctuations associated with the conventional immediate release formulations. [2,3]
Levofloxacin is the L-isomer of the racemate ofloxacin, a quinolone antimicrobial agent. Chemically, levofloxacin, a chiral fluorinated carboxyquinolone, is the pure (S)-enantiomer of the racemic drug substance ofloxacin. The chemical name is (-)-(S)-9fluoro-2,3-dihydro-3-methyl-10-(4- methyl-1-piperazinyl)-7-oxo-7Hpyrido[1,2,3-de]-1,4-benzoxazine-6-carboxyliacid hemihydrate. The mean terminal plasma elimination half-life of levofloxacin ranges from approximately 6 to 8 h following single or multiple doses of levofloxacin given orally or intravenously. Designing a sustained release
International Journal of Pharmacy
formulation for the drug levofloxacin may prolong therapeutic concentration of drug in the blood and decrease the frequency of dosing and also improve the efficacy of drug and patient compliance. Hence, an attempt was made to formulate sustained release matrix tablets for the broad spectrum antibacterial agent levofloxacin.
MATERIALS AND METHODS
Levofloxacin was a gift sample from Dr Reddys Laboratories, Hyderabad. Sodium CMC was purchased from Nitika chemicals, Nagpur, India. HPMCK4M was purchased from Otto chemical biochemical reagents, Mumbai. Sodium alginate was purchased from Patel industries, Ahmedabad, India. All other reagents used were of analytical grade.
FT-Infrared spectroscopy to find out the compatibility of drug with polymer: This was carried out to find out the compatibility between the drug levofloxacin and the polymers such as hydroxylpropyl methylcellulose (HPMC), sodium alginate, sodium CMC. 10 mg of the sample and 400 mg of KBr were taken in a mortar and triturated. A small amount of the triturated sample was taken into a pellet maker and was compressed at10 kg/cm2 using a hydraulic press. The pellet was kept onto the sample holder and scanned from 4000 cm-1 to 400 cm-1 in Shimadzu FT-IR spectrophotometer. Samples were prepared for drug levofloxacin, polymer HPMC, sodium alginate, sodium CMC and physical mixture of drug and polymers. The spectra obtained were compared and interpreted for the functional group peaks.
Characterization of levofloxacin compressed tablets:
Pre compression parameters
Bulk density (Db) [4]: The bulk density of the formulated granules was evaluated using a bulk density apparatus. It is the ratio of total mass of powder to the bulk volume of powder. It was measured by pouring the weighed powder into a graduated measuring cylinder and the volume was noted. It is expressed in gm/ml and is given by
Where, M =Mass of the powder Vb = Bulk volume of the powder.
Tapped density (Dt)[5]: It is the ratio of total mass of powder to the tapped volume of powder. The tapped volume was measured by tapping the powder to constant volume. It is expressed in gram/ml and is given by
Where, M = Mass of the powder Vt = Tapped volume of the powder.
Carr’s index (I) and Hausner’s ratio [6]
: Carr’s
index and Hausner’s ratio measure the propensity of granule to be compressed and the flow ability of granule. Carr’s index and Hausner’s ratio were calculated using following formula.
Carr’s index ,
Where, Dt = Tapped density of the powder Db = Bulk density of the powder
Hausner’s ratio,
Where, Dt = Tapped density of the powder Db = Bulk density of the powder
Angle of repose [7]: The frictional forces in a loose powder can be measured by the angle of repose. This is the maximum angle possible between the surface of a pile of powder and the horizontal plane. Sufficient quantities of levofloxacin granules were passed through a funnel from a particular height (2 cm) onto a flat surface until it formed a heap, which touched the tip of the funnel. The height and radius of the heap were measured. The angle of repose was calculated using the formula.
Angle of repose,
Where, h = Height of the pile in cm r = Radius of the pile
Preparation of levofloxacin tablets: Levofloxacin tablets were prepared by a direct compression method. Before going to direct compression all the ingredients were screened through sieve no.100. Except lubricant all the ingredients were thoroughly blended in a glass mortar with pestle for 15 min. After sufficient mixing lubricant was added and again mixed for additional 2-3 min. The mixture is compressed using 8 mm flat faced punch on 8 stages rotary tablet compress machine (Rimek Minipress Karnavati Eng. Ltd, Ahmadabad, India).The formulations are mentioned in Table 01.
Post compression parameters [8&9]
Hardness: The prepared tablets were subjected to hardness test. It was carried out by using Monsanto hardness tester and expressed in kg/cm2.
Weight variation test: 20 tablets were selected at random from the lot, weighed individually and the average weight was determined. The percent deviation of each tablets weight against the average weight was calculated. The test requirements are met; if not more than, two of the individual weights deviate from the average weight by not more than existing 7.5%.
Uniformity of drug content: The prepared levofloxacin tablets were tested for their drug content. Three tablets of each formulation were finely powdered. 100 mg of powder was accurately weighed and the drug levofloxacin was completely extracted with pH 1.2 acidic buffer and the solution was filtered. 1 ml of the filtrate was suitably diluted and analyzed for levofloxacin content by UV spectrophotometer at 293 nm.
In-vitro drug release studies [10]: The in-vitro
dissolution studies were carried out for the formulations using USP apparatus type II (LabIndia, Mumbai, India). The dissolution medium used was 900 ml of acidic buffer of pH 1.2 for 24 hours. The temperature was maintained at 37oC ± 0.5oC and the stirring rate was 100 rpm. Samples were withdrawn at regular time intervals and the same volume was replaced with fresh dissolution medium. The samples were measured by UV Spectrophotometer at 293 nm against a blank. The release studies were conducted in triplicate and the mean values were plotted versus time.
Kinetics of Drug Release [11&12]: To study the mechanism of drug release from the matrix tablets, the drug release data were fitted to various kinetic models like zero order, first order, higuchi’s and Korsmeyer-peppa’s equation and coefficient of correlation values were calculated for linear curves by regression analysis of the above plot. These models used to explain drug release mechanism due to swelling along with gradual erosion of the matrix.
Release profiles comparison: In the development of oral controlled release preparations an ethical or proprietary product, which has been available in the market, and an established its efficacy clinically, is usually selected as a reference. The generic preparation is always formulated with its dissolution profile as similar as possible to that of proprietary product. In-vitro dissolution can be considered as a surrogate tool for the assessment of bioequivalence.
There are several methods to compare the dissolution profiles of test with reference.
Those methods are classified into several categories, such as:
Model Dependent methods
Model Independent methods
Model dependent methods
These model dependent methods all rely upon a curve fitting procedure. Different mathematical functions have been used to model the observed data. Both the linear and non linear models are being used in practice for dissolution modeling. Linear models include Zero order, Higuchi, Hixson-Crowell where as the non linear models include First order, Korsemeyer-peppas, etc. The kind of drug, its polymorphic form, crystalline, particle size, solubility and amount in the pharmaceutical dosage form can influence the release kinetics. A water soluble drug incorporated in a matrix is mainly released by diffusion, while for a low water soluble drug the self erosion of the matrix will be the principal release mechanism.
Mathematical Models
Zero order kinetics (cumulative % drug release vs. time)
Drug dissolution from pharmaceutical dosage forms that do not disaggregate and release the drug slowly (assuming that the area does not change and no equilibrium conditions are obtained) can be represented by following equation.
Where Wo is the initial amount of the drug in the
pharmaceutical dosage form, Wt is the amount of
drug in the pharmaceutical dosage form at the time t and K is the proportionality constant. The following relation can in a simple way, express the Zero order kinetic model:
Where Q1 is the amount of drug dissolved in time t,
Qo is the initial amount of drug in the solution and Ko
is the zero order release rate constant.
First order kinetics: (Log cumulative % drug release vs. time)
The following equation can express this model
Where Q1 is the amount of drug released in time t, Qo
is the initial amount of drug in solution and K1 is the
release the drug in a way proportional to the amount of drug remaining in its interior.
Higuchi model: (Cumulative %drug release vs. square root of time)
Where Ft = amount of drug released at time t KH = the Higuchi release rate.
This is the most widely used model to describe drug release from pharmaceutical matrices. A linear relationship of square root of time versus concentration indicates that the drug release follows Fickain diffusion.
Korsmeyer Peppas model: (Log cumulative % drug release vs. Log time)
This model relates exponentially the drug release to the elapsed time (t)
where a is a constant incorporating structural and geometric characteristics of the drug dosage form, n
is the release exponent, indicative of the drug release mechanism, and the function of t is Mt/M∞
(fractional release of drug) Thus, equation can be rewritten as:
A modified equation was developed to accommodate the lag time (l) in the beginning of the drug release from dosage form:
When there is possibility of burst effect, b, the equation becomes:
Characterization drug release mechanism Diffusion
exponent (n)
Overall solute diffusion mechanism
0.45 Fickian Diffusion
0.45<n<0.89 Anomalous(fickian) diffusion
0.89 Case II transport
n>0.89 Super case II transport
Model independent methods:
Similarity factor: Among several methods investigated for dissolution profile comparison, f2 is the simplest.
Where Rt and Tt are the cumulative percentage
dissolved at each of the selected n time point of the reference and the test product respectively. Factor f2 is inversely proportional to the average squared difference between the two points, the emphasis on the larger difference among all the time points. The factor f2 measures the closeness between the profiles.
In dissolution profile comparisons, especially to assure similarity in product performance, regulatory interest is in knowing how similar the two curves are, and to have a measure which is no more sensitive to large differences at any particular time point. When the two profiles are identical, f2=100. An average difference of 10 % at all measured time point’s results in a f2 value of 50. FDA has set a public standard of f2 value between 50-100 to indicate similarity between two dissolution profiles.
Acceralerated stability study [13]: The purpose of stability testing is to provide evidence on how the quality of a drug substance product varies with time under the influence of a variety of environmental factors such as temperature, humidity and light and to establish are testing for the drug substance or a shelf life for the drug product and recommended storage conditions. The storage conditions used for stability studies were accelerated condition (40°C± 2° C/75% ± 5% RH). Stability study was carried out for the optimized formulation. Tablets of optimized formulation were stripped packed and kept in stability chamber for 3 months on above mention temperature.
RESULTS AND DISCUSSION
The levofloxacin drug was evaluated for angle of repose, bulk density, tapped density, compressibility index, and the results are shown in Table 02. The bulk densities of the granules were found to be in the range of 0.400±0.06 to 0.480±0.03 gm/ml. The tapped densities were ranged 0.444±0.05 to 0.545±0.03 gm/ml, the cars indexes were in the range of 9.2±0.23 to 13.53±0.24. The result indicates that all above parameters are within the limits. The hausner’s ratios were found to be in the range 1.07±0.04 to 1.15±0.09. The angle of repose varied from 27.51 ± 0.18o to 30.76 ± 0.36o
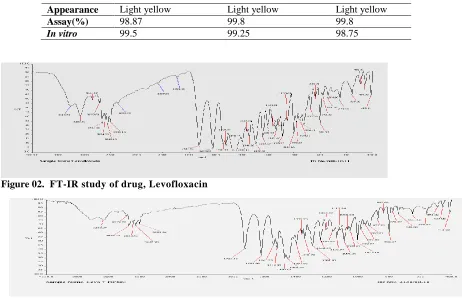
spectroscopy studies at wavelength from 4000 cm-1 to 400 cm-1 are shown in Figures 02& 03 and the characteristic peaks obtained are shown. From the results it indicates that there is no interaction between the drug and polymers.
The levofloxacin tablets were prepared by direct compression method. The tablets were evaluated for its hardness, weight variation, content uniformity and friability. Tablet hardness test is a measure of the cohesiveness of tablets and it plays a vital role for drug release. It is one of the official methods of the determination of tablets strength. The other essential requirements of tablets are to have an acceptable friability to withstand shocks during packing and shifting. Hardness must be controlled to ensure that the product is firm enough to with hand handling without breaking or crumbling and not so hard that the disintegration time is unduly prolonged. The hardness was found to be from 6.7 ± 0.04 to 8.2 ± 0.24 (kg/cm2).The weight variations were found to be between 545±0.015 to 551±0.007 mg. The friability was found to be between 0.005±0.034 to 0.6±0.035 %. The uniformity of drug levofloxacin present in tablets formulation ranged from 96.84 ± 0.16 to 98.87 ± 0.34%. The above results were within the limit of I.P.
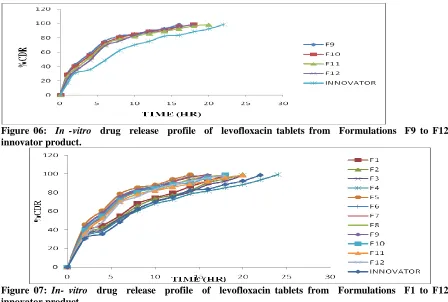
In -vitro dissolution study of sustained release tablets from each batch (F1 toF12) was carried out in pH 1.2 buffer for 24 hours. The formulation F1 shows 98.5% drug release after 18 hours, F2 shows 99.5% drug release after 20 hours.F3 shows 98.5% drug release after 20 hours, F4 shows 99.5 % drug release after 24 hours. Among the four formulations, F4 shows the sustained action and maximum amount of drug release that is 99.5% after 24 hours. The results indicate that the drug was found to be sustained action with increase concentration of polymer that is HPMC. Similarly the formulation, F5 shows 99.5% after 14 hours, F6 shows 99.2% after 16 hours, F7 shows 99.1% after 16 hours and F8 shows 99.2% after 18 hours. From the results it indicates F8 shows maximum drug release and showing sustained action with increase in the concentration of polymer that is Na CMC. Similarly the formulations F9 shows 98.5% after 16 hours, F10 shows 98.7% after 18 hours, F 11 shows 98.5% after 20 hours and F12 shows 98.3 % after 18 hours. Among the four formulations, F11 shows maximum drug release and sustained action with increase in concentration of polymers that is sodium alginate. The marketed tablet levoflox (750 mg) Cipla was conducted for in-vitro drug release studies and it was found that 98.8% drug release in 22 hours and showing the sustained action. The comparative drug release of all formulations showed
the improvement in sustaining property of drug release increasing the polymer concentration. F4 shows more sustained action and optimum release with compare to other formulation and marketed tablet, which indicates that the concentration of polymer control the drug release. The similarity factor (f2) was calculated and results are shown in Table 05. The comparative drug release of all formulations results are shown in Figures 04,05, 06 &07.
Mechanism of drug release:
In order to understand the complex mechanism of drug release from the matrix system, the in vitro
release rate were fitted to Korsmeyer-peppas model and interpretation of release exponent value (n) enlighten in understanding the release mechanism from the dosage form. The F4 formulation exhibited anomalous (non Fickain) diffusion mechanism.
The formulation F4 was chosen as optimised formulation because it showed more sustained action and optimum drug release and suitable with other evaluation parameters. The value of regression correlation coefficient (R2) was calculated for all formulations F1 to F12, which values were close to 1. Korsmeyer-peppas equation R2 values of Korsmeyer-peppas equation was found to be higher and the n values was found to be (0.45<n<0.89) release mechanism. Similarly among First order equation, R2 values of first order equation was found to be higher. Hence the drug release followed first order release kinetics with Non fickian diffusion mechanism. The results are shown in Table 04.
The optimized formulation F4 was evaluated for accelerated stability studies. The formulation were stored at 40°C at 75% RH for 3 months and analyzed for their physical parameters and drug content at every one-month interval. The physico-chemical parameters showed that there was a significant change observed. So indicates that product was found to be stable. The results are shown in Table 06.
CONCLUSION
drug from the tablets was observed first order with non-Fickian diffusion mechanism. Based on the observations, it can be concluded that the formulated sustained release matrix tablets of levofloxacin using widely accepted and
physiologically safe polymers and other excipients was capable of exhibiting sustained release properties.
Table 01: Formula for the preparation of levofloxacin tablets
Ingrediants F1 F2 F3 F4 F5 F6 F7 F8 F9 F10 F11 F12
Levofloxacin (mg)
250 250 250 250 250 250 250 250 250 250 250 250
Carbopol 940 (mg)
50 50 50 50 50 50 50 50 50 50 50 50
HPMC 15PV
(mg)
70 90 110 130 _ _ _ _ _ _ _ _
NaCMC (mg) _ _ _ _ 70 90 110 130 _ _ _ _
Sodium Alginate (mg)
_ _ _ _ _ _ _ _ 70 90 110 130
MCC (mg) 170 150 130 110 170 150 130 110 170 150 130 110
Magnesium stearate (mg)
5 5 5 5 5 5 5 5 5 5 5 5
Talc (mg) 5 5 5 5 5 5 5 5 5 5 5 5
TOTAL WEIGHT
550 550 550 550 550 550 550 550 550 550 550 550
Table 02: Physicochemical evaluations of levofloxacin
Batch Code Parameter Yield (%) Mean particle size (mm) Bulk density (gm/ml) Tapped density (gm/ml) Carr’s Index (%) Hausner’s ratio
Angle of repose (θ)
F1 97.65 0.660
±0.25 0.400 ±0.06 0.444 ±0.05 10.01 ±0.14 1.11 ±0.06 29.05 ±0.25
F2 97.45 0.683
±0.15 0.480 ±0.03 0.545 ±0.03 11.92 ±0.12 1.13 ±0.02 29.74 ±0.24
F3 95.85 0.575
±0.12 0.440 ±0.04 0.500 ±0.02 12 ±0.15 1.13 ±0.05 27.75 ±0.15
F4 96.38 0.570
±0.16 0.432 ±0.05 0.490 ±0.04 11.83 ±0.13 1.13 ±0.03 29.74 ±0.17
F5 95.10 0.520
±0.05 0.416 ±0.03 0.476 ±0.05 12.60 ±0.09 1.14 ±0.04 29.05 ±0.26
F6 94.44 0.530
±0.21 0.409 ±0.04 0.473 ±0.03 13.53 ±0. 24 1.15 ±0.09 29.3 ±0.14
F7 98.68 0.539
±0.06 0.412 ±0.04 0.460 ±0.05 10.43 ±0.20 1.11 ±0.07 29.60 ±0.34
F8 94.20 0.612
±0.04 0.420 ±0.03 0.466 ±0.06 9.87 ±0.14 1.10 ±0.06 28.52 ±0.14
F9 95.90 0.448
±0.11 0.421 ±0.05 0.476 ±0.04 11.55 ±0.07 1.13 ±0.03 29.05 ±0.26
F10 96.14 0.536
±0.05 0.408 ±0.03 0.450 ±0.05 9.3 ±0.17 1.10 ±0.08 27.51 ±0.18
F11 95.42 0.659
±0.20 0.412 ±0.05 0.454 ±0.03 9.2 ±0.23 1.07 ±0.04 30.76 ±0.21
F12 96.57 0.538
Table: 03: Physicochemical evaluations of levofloxacin tablets
Batch Code
Parameter
Hardness
(kg/cm2 )*
Friability (%)**
Weight variation (%)**
Drug content (%)***
F1 6.7±0.4 0.012±0.03 548±0.05 98.23±0.05
F2 7.4 ± 0.002 0.015±0.021 546±0.02 97.5±0.21
F3 7.7 ± 0.12 0.010±0.015 548±0.012 98.52±0.15
F4 7.7 ± 0.35 0.018±0.025 549±0.009 98.87±0.34
F5 6.87 ± 0.21 0.005±0.034 546±0.024 98.5±0.42
F6 7.9 ± 0.15 0.020±0.015 548±0.031 96.84±0.16
F7 7.73 ± 0.42 0.10±0.017 545±0.015 98.93±0.09
F8 8.1 ± 0.17 0.12±0.026 549±0.019 97.87±0.48
F9 7.4 ± 0.16 0.6±0.035 550±0.008 96.97±0.26
F10 8.2 ± 0.24 0.40±0.018 551±0.007 98.36±0.35
F11 7.9 ± 0.25 0.16±0.016 548±0.014 96.9±0.42
F12 8.1 ± 0.34 0.27±0.026 549±0.016 97.15±0.13
*(n=5 ± S.D), ** (n=20 ± S.D), *** (n=3 ± S.D)
Table 04: Correlation coefficients (R2) Values of different kinetic models Formulation
code
Zero order R2
First order R2
Higuchi R2
Korsmeyer-peppas R2
Korsmeyer-peppas n
F1 0.905 0.990 0.971 0.985 0.60
F2 0.892 0.938 0.962 0.978 0.476
F3 0.876 0.993 0.956 0.977 0.598
F4 0.971 0.972 0.955 0.995 0.748
F5 0.945 0.946 0.98 0.984 0.801
F6 0.968 0.988 0.960 0.974 0.578
F7 0.962 0.997 0.99 0.994 0.722
F8 0.950 0.971 0.992 0.979 0.547
F9 0.810 0.990 0.916 0.946 0.701
F10 0.987 0.982 0.98 0.99 0.596
F11 0.842 0.959 0.9778 0.970 0495
F12 0.851 0.968 0.963 0.918 0639
Table 05: Similarity factor (f2) of all formulations Formulatio
ncodes
F1 F2 F3 F4 F5 F6 F7 F8 F9 F10 F11 F12
Values 40.8 45.15 55.76 66.56 87.79 60.78 30.71 47.71 93.54 27.84 41.48 54.87
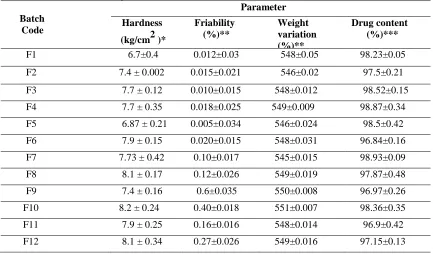
Table 06: Accelerated stability studies
Tests Observations
Initial 40°C/75%RH 40°C/75%RH
Time of
storage
Appearance Light yellow Light yellow Light yellow
Assay(%) 98.87 99.8 99.8
In vitro 99.5 99.25 98.75
Figure 02. FT-IR study of drug, Levofloxacin
Figure 03. FT-IR study of drug, Levofloxacin and polymers
Figure 04. In-vitro release of levofloxacin tablets from tablet Formulation F1 toF4 and innovator product.
Figure 05. In- vitro drug release profile of levofloxacin tablets from F ormulations F5 to F8 and
Figure 06: In -vitro drug release profile of levofloxacin tablets from Formulations F9 to F12 and innovator product.
Figure 07: In- vitro drug release profile of levofloxacin tablets from Formulations F1 to F12 and innovator product.
REFERENCES
1. Thombre, A.G, Denoto, A.R, Gibbes, D.C, J Control Rel 1999; 60: 333-341.
2. Merkus, F, Rate-Controlled Drug Administration and Action, CRCPress, Boca Raton, FL, USA 1986. 3. Ansel HC, Allen LV, Popvich NG. Pharmaceutical dosage forms and drug delivery system. 7th ed.,
Lippincott, Williams and Wilkins; 2000, pp. 229-243
4. Patrick JS. Martin’s Physical Pharmacy andPharmaceutical Sciences, 3rd ed., Varghese Publishing House, Bombay; 1991,pp.512-519.
5. D. Shah, Y. Shah, M. Rampradhan, Drug Dev. Ind. Pharm, 1997; 23: 567-574.
6. C. C. Gunn, Powder flow and compaction, In: Carter, S.J., ed. Tutorial Pharmacy, CBS Publishers and Distributors: 1986, pp.211-233.
7. Indian Pharmacopoeia, The Controller of Publications, Vol. II, 1996, pp. 734-736.
8. Kar RK, Mohapatra S, Barik BB. Designand characterization of controlledrelease matrix tablets of Zidovudine. Asian JPharm Cli Res, 2009;2:54-61.
9. Lachman L. Liberman A., King, JL.The Theory and practice of industrial pharmacy.. Varghese publishing house, 3rd ed., 1987,pp.296-300.
10. Edmund J. Preparation, characterization and scale of ketoconazole with enhanced dissolution and bioavailability. Drug Dev Ind Pharm, 2007; 33:755-765.
11. Higuchi T. Mechanism of sustained-actionmedication: theoretical analysis of rate of release of solid drugs dispersed in solidmatrices. J Pharm Sci, 1963;52:1145-1149.
12. Bhavani Boddeda, P.V. Kamala Kumari, K.P.R. Chowdary Formulation and evaluation of glipizide sustained release tablets Int J Pharm Biomed Res, 2012; 3(1): 44-48.