1
THREE DIMENSIONAL MODELLING OF BUILDING USING
FARO LASER SCANNER AND AUTOCAD 2011 SOFTWARE
Nik ‘Azim Hazman Bin Nik Ab Hadi, Zulkepli Majid and Halim Setan
Faculty of Geoinformation and Real Estate, Universiti Teknologi Malaysia, Malaysia Email: [email protected]
ABSTRACT
The development of increasingly sophisticated technology in the field of survey has resulted in more terrestrial laser scanners were being used to generate 3D models such as buildings, slope, landslide and others. This is because laser scanners are capable of making measurements in a short period of time but still provides good accuracy of the millimeter level. However, the laser scan data is static and cannot be applied for other 3D uses. In this project, a building located at Kolej Rahman Putra has been selected to produce 3D CAD model from laser scanned data. FARO Photon 120/20 laser scanner was used to scan G24 building to produce 3D point clouds of the building. This FARO laser scanner is the world fastest 3D phase shift and capable to scan more than 900, 000 points per second. FARO Scene software was used for data filtering and registration. Then, the scanned data was imported into AutoCAD 2011 for processing. 3D point cloud data is then processed into a 3D CAD model of the building. Dimensions of the building were measured using Leica Distometer for quality checking. Furthermore, this laser scanning technique was compared with close range photogrammetry to produce the same 3D building model. A Nikon D3100 DSLR camera with 14 Megapixel resolutions and a Photomodeler Pro 5 software was used for this purpose. Both 3D models were assessed in term of visualization and accuracy to determine the results.
Key words: Terrestrial Laser Scanner, Point clouds, 3D Model, Close Range Photogrammetry
1.0
INTRODUCTION
Currently, new technologies were being introduced to the field of survey from time to time due to the rapid development in computer and electronics. Among them was the introduction of laser scanning equipment in the field of survey. According to Fröhlich & Mettennleiter (2004), laser scanners are used more as an instrument of measurement for various applications. With the advancement of high precision systems, laser scanner can work in real world environments under various conditions. Although it is a new technology but it has been widely used all over the world in various fields such as industrial design, medical, reverse engineering, prototyping, quality control, artifacts documentation and others.
Now, the demand for three-dimensional model of buildings is increasing for usage of urban planning, environment, transportation and tourism industry. Normally the process of making buildings three dimensional models began with generating a 2D baseline of the building from GIS data, and then the two dimensional baseline is lift to a certain height to form a rough 3D model. The speed of this process is very dependent on building design and processing skills (Shi Pu, 2008).
2
Therefore, the laser scanning device has been chosen to generate a 3D model for building. This mainly because the laser scanning technique is capable of measuring very fast and accurately. This tool is capable of capturing thousands of points in just a few seconds. Thus it is a most suitable method to obtain 3D models of large objects such as the building.
There are two types of technology that can produce 3D models which are laser scanning technology and digital close range photogrammetry. The main differences between the two technologies are photogrammetry is an indirect method of data acquisition and for laser scanning, it directly produces 3D points. 3D laser scanner also called an active remote sensing system because no individual is required to hold a pole or a target to measure the surface (Lemmens, 2001).
Measurements using laser scanners will produce 3D point clouds. According to Rusinkiewics & Levoy (2000), the point cloud is the set of vertices in 3D coordinate system. These vertices are usually determined by the coordinates X, Y and Z and are usually intended to be the external surface of the object. In addition, the use of AutoCAD software is required to change the point cloud to CAD model which can be applied for other uses. There are other software packages available, but they are not directly related to the modeling of point clouds. There are many CAD packages available to import directly the point clouds from laser scanner that allows direct modeling CAD software’s for example AutoCAD, MicroStation and etc. (Fröhlich & Mettennleiter 2004).
The majority of the data from laser scanner is composed of 3D point clouds. Among the weaknesses of these data is that it is static data and cannot be used in most 3D applications. This data must be processed prior to use certain software and will usually be converted to a polygon or a triangle mesh model, Non-uniform rational B-spline (NURBS) surface model or a CAD model through a process generally referred to as surface reconstruction.
This study was performed to generate 3D model of building that had been scanned to be used for other 3D applications using AutoCAD 2011 software. This latest AutoCAD software was produced by the Autodesk, Inc. is able to support direct entry of 3D point clouds data from the laser scanner. Thus, the process of generating CAD model for the selected building which is G24 building can be done.
1.1
Terrestrial Laser Scanner
Laser scanning is a measuring method that does not involve the physical touch. The laser scanner observes the position of an object surface using a beam of light or a radiation. Laser scanning is also a remote sensing technique because there is no individual required to hold the sign of the target in the measurement process (Fangi et al., 2001). Terrestrial laser scanner now was used for large-scale surveying, complex entities, such as entire buildings, factories, power plants, roads, bridges, landscapes, and other structures and locations. The scanned data can be used to create universally usable, dimensionally accurate 3D CAD models or conventional 2D line drawings such as blueprints.
According to Smith & Harvey (2006), laser scanner functioning by observing actual objects and the surrounding area for data collection work and it is also capable of observing an object in a short time with high accuracy. Data generated by the laser scanner is a form of point group or also known as a point clouds. These points represent the positions of 3D objects and surfaces used to generate the 3D digital model in the computer.
3
of the laser scanning device whether it uses the concept of triangulation, phase measurement or time of flight. Laser scanner type of FARO Photon 120/20 used for this study and it applies the principle of phase measurement. Thus, only the principle of this measurement is to be emphasized in this study. This principle of measurement was used to produce the harmonic waves of laser radiation. Laser scanners that use this kind of principle can give better results but is limited to medium distance observations of up to 100 meters. The principle of measurement is also the point of producing more than the time of flight system. Phase measuring laser scanner capable of scanning 360° to the horizontal plane and 320° in the vertical plane (Böehler & Marbs 2002).
2.0
METHODOLOGY
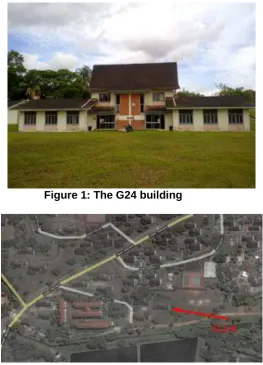
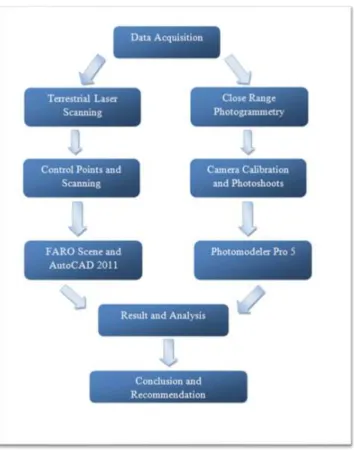
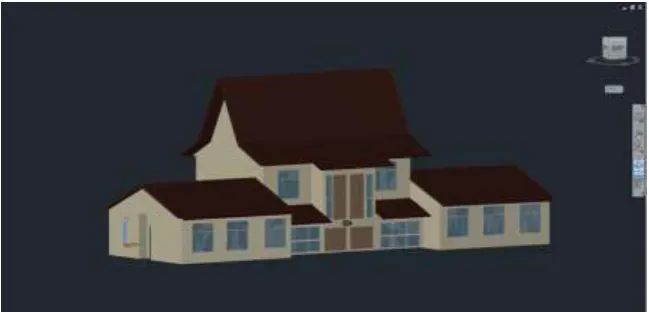
This research was done for the purpose to build a three dimensional modeling of building from 3D point clouds data. The building involved in this research was a G24 building as shown in Figure 1, located at Kolej Rahman Putra, Universiti Teknologi Malaysia, Skudai (Figure 2). The fieldwork of the project comprised of two categories which were the terrestrial laser scanning and close range photogrammetry. After that, a verification measurement by Leica Distometer was done for standard measurement. Only the exterior part of the building was laser scanned to obtain a complete model of the building.
For the laser scanning technique, the FARO Photon 120/20 laser scanner was used for data collection and the software used for preprocessing was FARO Scene 4.5. Next, the data were exported to AutoCAD 2011 software for 3D modeling of the building. Figure 3 shows the details of this research workflow.
4
Figure 2: The location of the building at Kolej Rahman Putra,UTM
This research focused more on the laser scanning technique and AutoCAD 2011 software in order to generate 3D model. Then, after it was completed, another technique which was close range photogrammetry was conducted. This was done as a control for the primary technique and comparison then was made to 3D models generated from both techniques.
Figure 3: The Flow chart of research
Before the laser scanning was done, a reconnaissance work must be carried out first at the field. This was done by moving around the building to make sure there are no obstacles that would block laser scanning process later on and also to determine the best laser scan station’s position. Furthermore, the placement of the laser scan station was very crucial to ensure full coverage of the building with a minimum number of stations can be done. If the planning not done correctly, the data obtained later maybe incomplete and rendered useless.
5
Figure 4: The layout of scan stations around the building
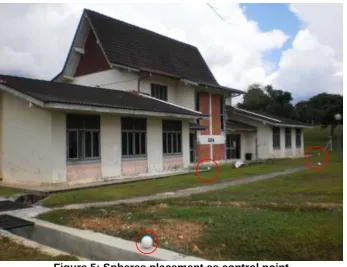
The spheres (Figure 5) were used as an artificial target in this scanning process. It works as the control point for the laser scan station. A total of 15 spheres were placed scattered around the building. The placements of this sphere need a careful planning so that no problem wills occurred during data registration later. It must meet few requirements which were at least 3 corresponding spheres in two different dataset and spheres must fairly distributed surrounding the building with minimum distance of 1.5m to 7m from the scanner to obtain a good geometry network.
Figure 5: Spheres placement as control point 2.1
Laser scanning
6
depending on ambient light. It also offer the best in class field of view that cover 360º in horizontal direction and 320 º in vertical direction which is the largest field of view available for a laser scanner.
Before scanning process was done, the laser scanner instrument was installed on the carbon fiber tripod. During the installation, make sure the tripod adjustment arrangements have been locked and that the legs are of even length. Next, a laptop and power base battery was connected to the laser scanner through special connecting cable. This laptop acts as controlling device for the scanning process via FARO Scene software.
Figure 6: The FARO Photon 120/20 laser scanner
When instrument setup was completed, there were few settings need to be adjusted according to user requirements. Settings for scanner parameter including scan area and storage had to be defined first before scanning process began. The scan resolution can be chosen among 1/1, 1/2, 1/3, 1/4, 1/5, 1/8, 1/10, or 1/16. This resolution will determine the size and duration time of scanning. The higher resolution selected would result bigger data size and longer scanning duration. But, for this project only 1/5 resolution was selected because it suitable for scanning large objects.
After that, scanning process was started and a total of six stations were required to cover all the exterior of the building. There were two types of scanning, rough scan and fine scan. The first scan which was rough scan intended to get full 360º × 320 º panaromic views with much lower scan resolution. Then, only required building was selected from the first scan using the FARO Scene software and new scan with better resolution was done. It took almost 15-20 minutes to do the scanning at each station. As a result, a total of 900 megabytes of file size was produced as each scan station consumed about 150 megabytes for the scanning data.
2.2 Point Clouds Processing
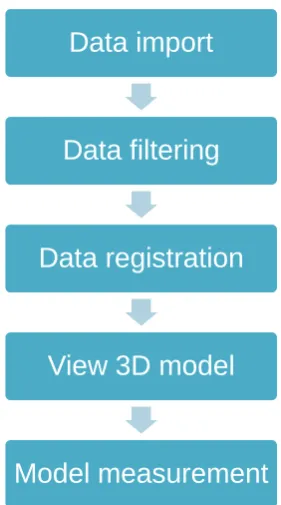
The FARO Scene software was used both for data collection and also data processing. In the data processing, there were few steps involved including data checking, data filtering, data registration and data viewing. The steps of point clouds data processing was shown in
7
unwanted noise and bad point clouds. By using a filter, selected scan points are corrected or removed from the scans. However, there were different filters according to which technique they identify an inaccurate scan point and which solution was then taken. For this project, only the stray and smooth filters were used.
The stray filter function ate to remove scan points resulting from hitting two objects with the laser spot or by hitting no object at all, for example the sky. While the smooth filter was used to reduce noise on surfaces. Furthermore, this smooth filter will never remove scan points but rather alters their original position. But, it should not be applied to edges or highly detailed objects as the filtering will have a smoothing effect, causing some features to be blended into surrounding points.
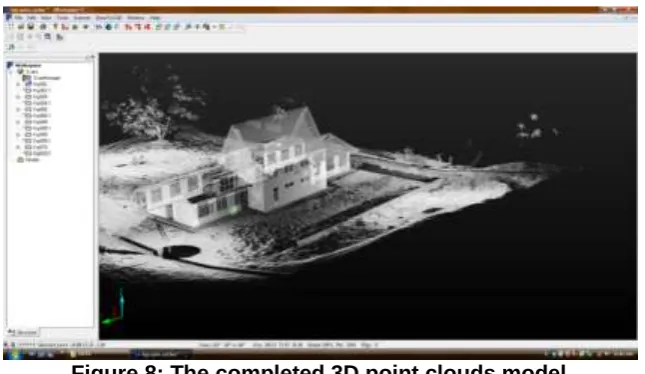
Next, after all scans data were already filtered, it needs to be registered to produce a complete 3D point clouds model (Figure 8) of the building. For registration process, a minimum of 3 reference target or more must available in two different datasets. Then, the sphere and plane selector were used to select a common reference point between these two scan datasets. The scan manager was used to displays current status of the registration and what quality was achieved. The traffic light next to scan managers indicates whether they contain good or failed scan fits. If a traffic light next to a scan manager is red, this means that this scan manger contains scan bad fit. While green means that all the quality criteria are met.
Figure 7: Procedure on point clouds processing
Data import
Data filtering
Data registration
View 3D model
8
Figure 8: The completed 3D point clouds model 2.3 3D modeling using AutoCAD 2011
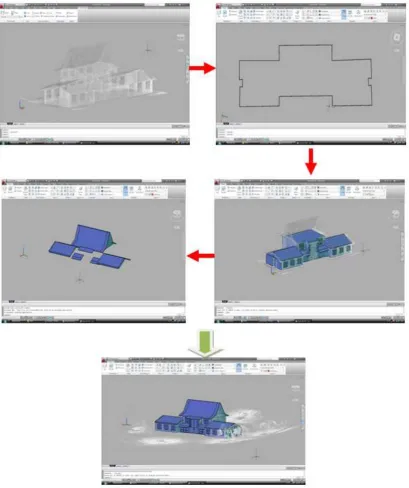
AutoCAD 2011 software was used to model the completely registered point clouds of the building. A 3D model can be created based on the useful information contained in point cloud data. The CAD model will be obtained after the 3D model was successfully generated. After the scan data were completely registered, it was imported to AutoCAD 2011 software. The imported data were in the form of *.fws format and were automatically converted to *.pcg format so that it can be used in AutoCAD 2011. *.pcg is the format for Autodesk point clouds. Because this point clouds data were a little bit crowded, the data then need to be cropped so the modeling process can be done easier and faster. Furthermore, the advantages of cropping the data will make this software runs faster as it use less memory, so rotating and panning the data are faster than usual. Crop function was used to temporarily hide/isolate some point clouds when the point clouds data is complex for interpretation. Only the desired buildings were left after cropping the data. The summary of procedures of 3D modeling was shown in Figure 9 below.
9
Figure 9: Summary of 3D modeling Steps in AutoCAD 2011
10
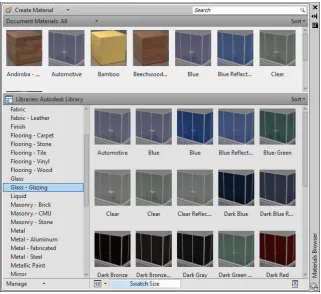
Figure 10: The AutoCAD 2011 material browser
3.0
RESULTS AND ANALYSIS
A 3D model (see Figure 11) was generated as an output from a terrestrial laser scanner data. In this project, a building was selected and scanned by laser scanner to capture its details. The fieldwork took more than 2 hours to be completed and there were 6 scan station established around the building to cover a complete building structure. The data filtering and registration was done using FARO Scene. The point clouds were consisted about 16, 624, 822 points from a total of 6 scan stations. Then, the combined point clouds data was imported into AutoCAD 2011 for 3D modeling process.
In addition, there also other visual styles supported by AutoCAD 2011 software such as 2D wireframe, conceptual, hidden, realistic, shaded, shaded with edges, shades of gray, sketchy, wireframe and x-ray. For the photogrammetric technique, a DSLR camera which is a Nikon D3100 was used to take photographs of the building. The camera was calibrated first before the photographs were taken. This photo shoots session only take less than half an hour to be completed and a total of 23 pictures were taken to cover the overall building structure. Then, these photos were imported to Photomodeler Pro 5 software for modeling process. From that, only 13 stereopairs were processed to create a 3D model of that building. The result of 3D model generated from close range photogrammetric technique is shown in Figure 12.
11
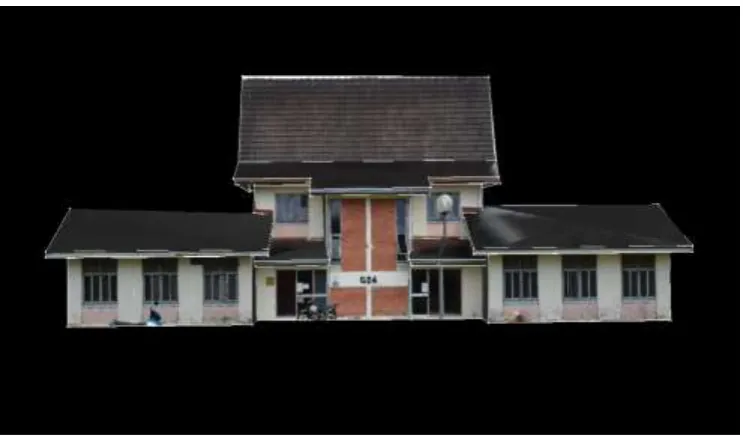
Figure 11: Completed 3D model of the G24 building
Figure 12: 3D model of the building using Photomodeler Pro 5
From this research, several comparisons were made. In general, a laser scanning technique is quite expensive than a close range photogrammetry. The laser scanner cost about RM500000 excluding the DSLR camera and lens for colored point clouds. Besides that, the cost for laptop and software also need to be included in that cost. But for photogrammetry, the cost is much cheaper because it only need a DSLR camera and processing software which only cost about tens of thousands ringgits depending on resolution of the camera.
In terms of data acquisition, a laser scanner take more time for scanning the whole building compared to photogrammetry technique. A laser scanner need about 20 minutes to do scanning for a single scan station while photo based technique take only few seconds to snap a single photo. These results a very dense point clouds that will help modeling process later on. But, for the photogrammetry technique, a careful photo shoots planning need to be done to make sure all photos taken fulfill the specified requirements. If not, it will create problem later in processing those photos.
12
processing including camera calibration, selection of best photos, photos referencing, process and texturing. This data processing will take days to complete a model of the building where most of time used at referencing the photos. If photos were not referenced correctly, an error will be indicated after the process and the step will be repeated all over again until the error is gone and picture residual is at acceptable limit. The process is very much dependent on the experience of the processor.
The analysis was conducted to compare 3D model generated using laser scanning and photo based technique will be done. The AutoCAD 2011 and Photomodeler Pro 5 were used in both methods. Figure 13 and Figure 14 shows the visual comparison between both techniques used.
By looking on these figures, it is clear that 3D model generated by Photomodeler Pro has a photorealistic texture compared to AutoCAD 2011 3D model which resemble the actual building used. However, the 3D model produced by AutoCAD 2011 also looks similar to real building by applying a new material browser features for texturing the model surface. What more important is the model itself which is dimensionally similar to the real one. Moreover, some measurements were done earlier to the building dimension by using Leica Distometer that will be used as standard for accuracy evaluation. A total of 12 measurements (Figure 15) were made to cover the building floor dimension.
Figure 13: 3D model generated by AutoCAD 2011
13
Figure 15: Building dimension’s measurement
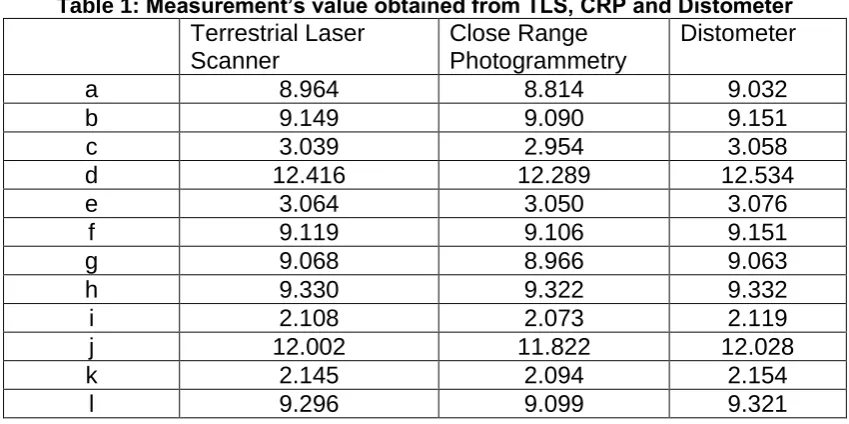
The measurement values obtained from terrestrial laser scanner, close range photogrammetry and distometer are shown in Table 1. The results of the comparison between terrestrial laser scanner and close range photogrammetry are presented in Table 2
and Table 3.
Table 1: Measurement’s value obtained from TLS, CRP and Distometer
Terrestrial Laser
Scanner
Close Range
Photogrammetry
Distometer
a
8.964
8.814
9.032
b
9.149
9.090
9.151
c
3.039
2.954
3.058
d
12.416
12.289
12.534
e
3.064
3.050
3.076
f
9.119
9.106
9.151
g
9.068
8.966
9.063
h
9.330
9.322
9.332
i
2.108
2.073
2.119
j
12.002
11.822
12.028
k
2.145
2.094
2.154
l
9.296
9.099
9.321
a
c
b
d
e
k
h
g
i
j
f
14
Table 2: Differences between TLS and Distometer
Terrestrial Laser
Scanner
Distometer
Difference
a
8.964
9.032
-0.068
b
9.149
9.151
-0.002
c
3.039
3.058
-0.019
d
12.416
12.534
-0.118
e
3.064
3.076
-0.012
f
9.119
9.151
-0.032
g
9.068
9.063
0.005
h
9.330
9.332
-0.002
i
2.108
2.119
-0.011
j
12.002
12.028
-0.026
k
2.145
2.154
-0.009
l
9.296
9.321
-0.025
Standard deviation
0.0330
Table 3: Differences between CRP and Distometer
Close Range
Photogrammetry
Distometer
Difference
a
8.814
9.032
-0.218
b
9.090
9.151
-0.061
c
2.954
3.058
-0.104
d
12.289
12.534
-0.245
e
3.050
3.076
-0.026
f
9.106
9.151
-0.045
g
8.966
9.063
-0.097
h
9.322
9.332
-0.010
i
2.073
2.119
-0.046
j
11.822
12.028
-0.206
k
2.094
2.154
-0.060
l
9.099
9.321
-0.222
Standard deviation
0.0827
From Table 2, it is shown that differences between terrestrial laser scanners against distometer were small which is in centimeter level and the standard deviation is ± 0.0330 meters. Whereas, for the close range photogrammetry against distometer as shown in Table 3 has a slightly higher differences though still in centimeters level and has a standard deviation of ± 0.0827 meters. This proved that terrestrial laser scanner method give better accuracy than photogrammetric. The accuracy of laser scanning was very close to the value obtained from the distometer.
4.0
CONCLUSION
15
A terrestrial laser scanner was used for data collection in field and point clouds acquired were modeled using AutoCAD 2011. Based on this research, the AutoCAD 2011 software is able to generate 3D CAD model from laser point clouds data. A comparison was made with 3D model generated from Photomodeler Pro software in term of visualization and accuracy. Accuracy obtained for the 3D model produced is only in centimeter level compared to standard value and the difference with model generated from photogrammetry.
Each technique has it own advantages and disadvantages. So, decision on the best method in producing 3D model is more depending on user and work requirement. In some cases, the combination of both methods might give the best solution.
REFERENCES
Böehler, W. & Marbs, A. (2002). 3D Scanning Instruments. CIPA WG6 Int. Workshop on scanning for cultural heritage recording.
Fangi, G., Fiori, F., Gagliardini, G. & Malinverni, E. S. (2001). Fast and Accurate Close Range 3D Modelling By Laser Scanning System. XVIII International Symposium of CIPA 2001.
Fröhlich, C. & Mettenleiter, M. (2004). Terrestrial Laser Scanning– New Perspectives in 3D Surveying. International Archives of Photogrammetry, Remote Sensing and Spatial
Information Sciences, XXXVI - 8/W2.
Lemmens. M, V.D Huevel. 3D Close Range Laser Mapping Systems. GIM International, January. 2001.
Sequeira, V., Ng, K., Wolfart, E., Goncalves, J.G.M., and Hogg, D.(1999).Automated reconstruction of 3d model from real environments.ISPRS Journal of Phogrammetry & Remote Sensing,54,pp1-22.
Shi Pu, The International Archives of the Photogrammetry, Remote Sensing and Spatial Information Sciences. Vol. XXXVII. Part B5. Beijing 2008.
Rusinkiewicz, S. and Levoy, M. 2000. QSplat: a multiresolution point rendering system for large meshes. In Siggraph 2000. ACM , New York, NY, 343-352.
16
AUTHORS
Nik ‘Azim Hazman Bin Nik Ab Hadi is a B.Sc. student at the Dept of Geomatic Engineering, Faculty of Geoinformation & Real Estate, Universiti Teknologi Malaysia (UTM).
Dr. Zulkepli Majid is a senior lecturer at the Faculty of Geoinformation and Real Estate, Universiti Teknologi Malaysia. Currently, he is the head of Photogrammetry and Laser Scanning Research Group. He holds B.Sc.(Land Surveying) degree, M.Sc (Photogrammetry) degree and a Ph.D (Medical Photogrammetry) degree from Universiti Teknologi Malaysia, Malaysia. His research interests lie in the areas of Photogrammetry and Laser Scanning for various applications.