Among various energy storage technologies, rechargeable lithium-ion batteries have been
considered as effective solution to the increasing need for high-energy density
electrochemical power sources. Rechargeable lithium-ion batteries offer energy densities 2 -
3 times and power densities 5 - 6 times higher than conventional Ni-Cd and Ni-MH batteries,
and as a result, they weigh less and take less space for a given energy delivery. However, the
use of lithium-ion batteries in many large applications such as electric vehicles and storage
devices for future power grids is hindered by the poor thermal stability, relatively high
toxicity, and high cost of lithium cobalt oxide (LiCoO2) powders, which are currently used as
the cathode material in commercial lithium-ion batteries. Recently, lithium iron phosphate
(LiFePO4) powders have become a favorable cathode material for lithium-ion batteries
because of their low cost, high discharge potential (around 3.4 V versus Li/Li+), large
specific capacity (170 mAh g-1), good thermal stability, and high abundance with the
environmentally benign and safe nature. As a result, there is a huge demand for the
production of high-performance LiFePO4. However, LiFePO4 also has its own limitation
such as low conductivity (~10-9 S cm-1), which results in poor rate capability. To address this
problem, various approaches can be used such as decreasing particle size of LiFePO4, doping
LiFePO4 with metal ions or coating LiFePO4 surface with carboneous materials. Formation
of conductive layer on LiFePO4 and decreasing particle size are promising approaches due to
their superior contribution to electrical conductivity and electrochemical performance of
of sol-gel and electrospinning. During the material preparation, polyacrylonitrile (PAN) was
used as an electrospinning media and a carbon source. LiFePO4 precursor materials and/or
conductive materials (carbon nanotubes and graphene) and PAN were dissolved in
N,N-dimethylformamide separately and they were mixed before electrospinning.
LiFePO4 precursor/PAN fibers were heat treated, during which LiFePO4 precursor
transformed to energy-storage LiFePO4 material and PAN was converted to carbon. The
surface morphology, microstructure and electrochemical performance of the materials were
analyzed. Compared with conventional powder based positive electrodes, the novel
LiFePO4/C composite nanofiber cathodes possess better electrochemical performance.
Furthermore, the newly developed LiFePO4/C composite nanofibers are easy to fabricate,
highly controllable, and can be used in practical Lithium-ion battery applications.
In addition to LiFePO4, more recent efforts have been directed to mixed form of layered
lithiummetal oxides (Li-Ni-Mn-Co). Nickel and manganese are of importance because of
their lower cost, safety and higher abundance in nature. These new cathodes offer noticeable
improvement in the capacity and cycling behavior. In these cathodes, LiNi1/3Co1/3Mn1/3O2
attracted significant interest because of its good electrochemical properties such as high
capacity, prolonged cycling life, and so on. On the other hand, it has some disadvantages
such as instability at high voltages and high current densities. To overcome these problems,
synthesis of layered Li-rich composite materials such as xLi2MnO3·(1-x)LiCo1/3Ni1/3Mn1/3O2
Relatively low cost and simple preparation route make new xLi2MnO3
·(1-x)LiMn1/3Ni1/3Co1/3O2 composite materials possible to use as potential cathode candidate for
© Copyright 2012 by Ozan Toprakci
by Ozan Toprakci
A dissertation submitted to the Graduate Faculty of North Carolina State University
in partial fulfillment of the requirements for the Degree of
Doctor of Philosophy
Fiber and Polymer Science
Raleigh, North Carolina
2012
APPROVED BY:
_______________________________ ______________________________
Prof. Xiangwu Zhang Prof. Peter S. Fedkiw
Chair of Advisory Committee Co-Chair of Advisory Committee
________________________________ ________________________________
Ozan Toprakci was born on June 28th, 1982 to Zaide and Ibrahim Toprakci of Denizli,
Turkey. He graduated from Denizli Science High School in July of 1999. He attended Ege
University in September 1999, and graduated with a Bachelor of Science in Textile
Engineering in July 2004. After graduation, he obtained a shift manager position in
Abalioglu Spinning Mill Co., Ltd., where he did two years of work as a shift manager.
In January 2006, he went to the Pamukkale University as a research assistant and graduate
student majoring in Textile Engineering and obtained his Master Degree in July 2008. During
that time, he investigated the effects of fiber properties on the yarn properties.
In August 2008, Ozan Toprakci started working toward his Ph.D. degree majoring in Fiber
and Polymer Science in the Department of Textile Engineering, Chemistry and Science at
North Carolina State University. His research activities ranged from the preparation and
characterization of organic/inorganic electrospun fibers and their application in energy
conversion and storage systems, to the fabrication and functionlization of polymer or
The author would like to offer his sincerest appreciation to respected advisors: Professors
Xiangwu Zhang and Peter S. Fedkiw, for supervising, and supporting, during his Ph.D.
studies; to his other committee members: Professors Saad Khan and Ahmed Mohamed
El-Shafei, for their wise counsel, advice, and support.
Also, the author would like to thank Dr. Liwen Ji, Dr. Zhan Lin, Mr. Guanjie Xu, Ms. Ying
Li, Dr. Yinfang Yao, Dr. Shu Zhang, Dr. Narendiran Vitchuli, Dr. Christopher A. Bonino,
Ms. Shuli Li, Dr. Quan Shi, Dr. Bingkun Guo, Dr. Mataz Alcoutlabi, Dr. Kyung-Hye Jung,
Dr. Xin Wang, Dr. Yinzheng Liang, Dr. Bohyung Kim, Mr. Yao Lu, Dr. Leigang Xue, Mr.
Chen Chen and Mr. Kun Fu at North Carolina State University for their earnest cooperation
and warmhearted help during his Ph.D. study.
The author also deeply appreciates Mr. Chuck Mooney a.k.a “SEM whisperer”, Mr. Roberto
Garcia and Mr. Fred Stevie in the Analytical Instrumentation Facility, Mrs. Lisa Lentz in the
Analytical Services Lab at Department of Soil Science, Mr. Dzung Nguyen and Ms. Birgit
Andersen in the College of Textiles at North Carolina State University for their help in
sample characterization.
The author also thanks to Zack de la Rocha, M.C.U.D., N. Chomsky, J. Hendrix, T. Waits, J.
White for inspiration during his hard times.
The author also acknowledges funding supports from the Ministry of National Education of
LIST OF TABLES ... xii
LIST OF FIGURES ... xiv
CHAPTER 1. INTRODUCTION ... 1
1.1. Overview of electrospinning ... 1
1.2. Applications of electrospun nanofibers ... 4
1.3. Overview of batteries ... 6
1.3.1. Classification of batteries ... 9
1.3.1.1. Primary batteries ... 9
1.3.1.2. Secondary batteries ... 9
1.4.1. Anode materials for lithium-ion batteries ... 14
1.4.1.1. Carbonaceous anodes ... 15
1.4.1.2. Novel graphite varieties ... 15
1.4.1.3. Carbon nanotubes (CNTs) ... 16
1.4.1.4. Silicon ... 17
1.4.1.5. Alloy anodes ... 20
1.4.2. Cathode materials for lithium-ion batteries ... 25
1.4.2.1. Layered lithium-metal oxides ... 26
1.4.2.2. Lithium-manganese spinels ... 28
1.4.2.3. Olivines ... 29
1.5.2. Solid-state methods for LiFePO4 production ... 34
1.5.2.1. Solid-state synthesis ... 35
1.5.2.2. Mechanochemical activation ... 39
1.5.2.3. Carbothermal reduction ... 44
1.5.2.4. Microwave heating... 50
1.5.3. Solution-based methods for LiFePO4 production ... 55
1.5.3.1. Hydrothermal synthesis ... 56
1.5.3.2. Sol-gel synthesis ... 62
1.5.3.3. Spray pyrolysis... 69
1.5.3.4. Co-precipitation ... 73
1.5.3.5. Microemulsion drying ... 76
1.5.4. Other methods ... 78
CHAPTER 2. OBJECTIVES ... 80
CHAPTER 3. OVERALL EXPERIMENTAL SECTION ... 83
3.1. Chemicals and reagents... 83
3.2. Nanofiber preparation ... 84
3.3. Nanopowder preparation ... 85
3.4. Morphological and structural characterization ... 85
ELECTROSPUN LiFePO4/CARBON COMPOSITE NANOFIBERS FOR LITHIUM-ION
BATTERIES ... 88
Abstract ... 88
4.1. Introduction ... 89
4.2. Experimental ... 90
4.2.1. Sample preparation ... 90
4.2.2. Structure characterization ... 93
4.2.3. Electrochemical measurements ... 94
4.3. Results and discussion ... 95
4.3.1. Morphology of LiFePO4 precursor/PAN and LiFePO4/C composite nanofibers . 95 4.3.2. Structure characteristics of LiFePO4/C composite nanofibers... 100
4.3.3. Electrochemical performance of LiFePO4/C composite nanofibers ... 103
4.3.4. Effect of heat-treatment conditions ... 105
4.4. Summary ... 110
CHAPTER 5. CARBON NANOTUBE-LOADED ELECTROSPUN LiFePO4/CARBON COMPOSITE NANOFIBERS AS STABLE AND BINDER-FREE CATHODES FOR RECHARGEABLE LITHIUM-ION BATTERIES ... 112
Abstract ... 112
5.1. Introduction ... 113
5.2.2. Preparation of composite nanofibers ... 118
5.2.3. Structural and morphological characterization ... 119
5.2.4. Electrochemical measurements ... 120
5.3. Results and discussion ... 121
5.3.1. Structural and morphological characterization of pristine LiFePO4 powder, and LiFePO4/C and LiFePO4/CNT/C composite nanofibers ... 121
5.3.2. Electrochemical performance of pristine LiFePO4 powder, and LiFePO4/C and LiFePO4/CNT/C composite nanofibers ... 128
5.4. Summary ... 133
CHAPTER 6. LiFePO4 NANOPARTICLES ENCAPSULATED IN GRAPHENE-CONTAINING CARBON NANOFIBERS FOR USE AS ENERGY STORAGE MATERIALS ... 134
Abstract ... 134
6.1. Introduction ... 135
6.2. Experimental ... 137
6.2.1. Preparation of composite nanofibers ... 137
6.2.2. Structural and morphological characterization ... 138
6.2.3. Cathode preparation ... 139
6.2.4. Electrochemical measurements ... 140
LiFePO4/graphene/C composite nanofibers ... 140
6.3.2. Electrochemical performance of pristine LiFePO4 powder, LiFePO4/C and LiFePO4/graphene/C composite nanofibers ... 148
6.4. Summary ... 153
CHAPTER 7. SYNTHESIS AND CHARACTERIZATION OF xLi2MnO3 ·(1-x)LiMn1/3Ni1/3Co1/3O2 COMPOSITE CATHODE MATERIALS FOR RECHARGEABLE LITHIUM-ION BATTERIES ... 154
Abstract ... 154
7.1. Introduction ... 155
7.2. Experimental ... 157
7.2.1. Preparation of cathode materials ... 157
7.2.2. Structural and morphological characterization ... 159
7.2.3. Electrochemical measurements ... 159
7.3. Results and discussion ... 160
7.3.1. Structure of xLi2MnO3·(1-x)LiNi1/3Co1/3Mn1/3O2 composites ... 160
7.3.3. Electrochemical performance of xLi2MnO3·(1-x)LiNi1/3Co1/3Mn1/3O2 composites ... 165
7.4. Summary ... 172
CHAPTER 8. CONCLUSIONS ... 173
Table 1.1. Theoretical irreversible and reversible capacities calculated for some metal oxides.
... 22
Table 1.2. Precursors used in the solid-state synthesis method, and particle size and
electrochemical performance of the resultant LiFePO4 powders. ... 37
Table 1.3. Precursors used in the mechanochemical activation method, and particle size and
electrochemical performance of the resultant LiFePO4 powders. ... 43
Table 1.4. Precursors used in the carbothermal reduction method, and particle size and
electrochemical performance of the resultant LiFePO4 powders. ... 49
Table 1.5. Precursors, microwave absorbers, power, and time used in the microwave heating
method, and particle size and electrochemical performance of the resultant LiFePO4 powders.
... 54
Table 1.6. Precursors used in the hydrothermal synthesis method, and particle size and
electrochemical performance of the resultant LiFePO4 powders. ... 61
Table 1.7. Precursors used in the sol-gel synthesis method, and particle size and
electrochemical performance of the resultant LiFePO4 powders. ... 67
Table 1.8. Precursors used in the spray pyrolysis method, and particle size and
electrochemical performance of the resultant LiFePO4 powders. ... 72
Table 1.9. Precursors used in the co-precipitation and microemulsion drying methods, and
solutions. ... 90
Table 5.1.Concentrations of LiFePO4 precursor, PAN, and CNT in electrospinning solutions.
... 118
Table 5.2. Characteristic Raman bands of LiFePO4/C and LiFePO4/CNT/C composite
nanofibers. ... 123
Table 6.1. Concentrations of LiFePO4 precursor, PAN, and graphene in electrospinning
solutions. ... 138
Table 6.2. Structural lattice parameters and unit cell volumes of pristine LiFePO4 powder,
LiFePO4/C composite nanofibers, and LiFePO4/graphene/C composite nanofibers. ... 142
Table 6.3. Characteristic Raman bands of LiFePO4/C and LiFePO4/graphene/C composite
nanofibers. ... 144
Table 7.1 Stoichiometric precursor ratios and the corresponding theoretical capacities of
Figure 1.1. Common nanofiber production techniques: (a) drawing, (b) self-assembly, (c)
template synthesis, and (d) phase separation. ... 2
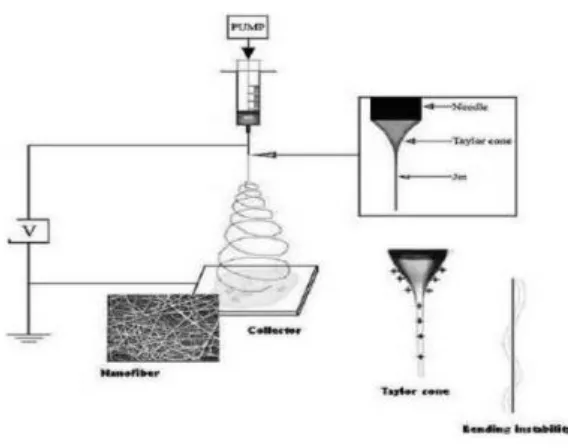
Figure 1.2. Schematic illustration of the conventional set-up for electrospinning. ... 3
Figure 1.3. The schematic diagrams of (a) active material, (b) active material-carbon complex, and (c) electron transfer pathway of active material/carbon nanofiber ... 5
Figure 1.4. (a) SEM and (b) TEM image of LiCoO2/C nanofibers. ... 6
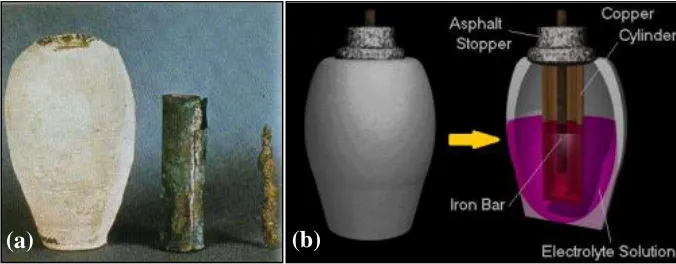
Figure 1.5 (a) Ancient “Baghdad Battery”, and (b) its schematic presentation. ... 7
Figure 1.6.Electrochemical operation and internal construction of a typical cell. ... 8
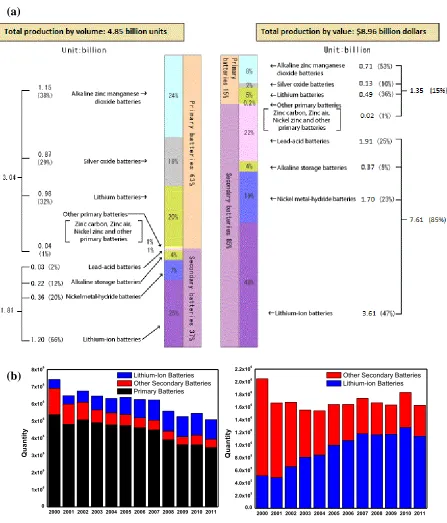
Figure 1.7. (a) Total battery production statistics in 2010 and (b) growth of lithium-ion battery industry since 2000 (Original data supplied by the Battery Association of Japan) .... 11
Figure 1.8. (a) Comparison of different energy storage systems and (b) applications of lithium-ion batteries. ... 13
Figure 1.9. (a) Charging and (b) discharging processes of a typical lithium-ion battery. ... 14
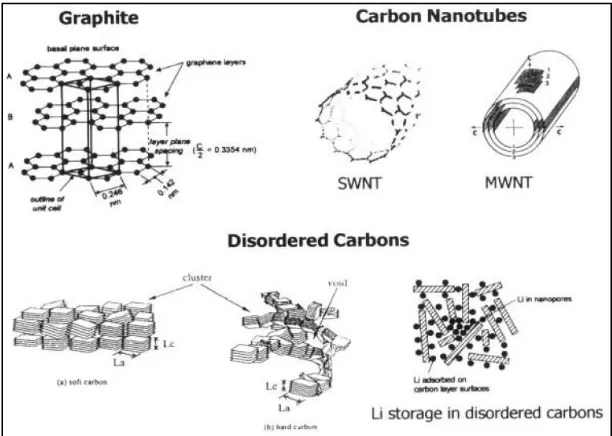
Figure 1.10. Schematic representation of various types of carbons. ... 16
Figure 1.11. Comparison of capacity versus cycle life for Si-based nanocomposite anodes produced by high impact ball milling. ... 18
Figure 1.12. SEM-images of three carbon/silicon composites, prepared with different coating time. Coating time: (a) 1 min, (b) 2.5 min, and (c) 5 min... 19
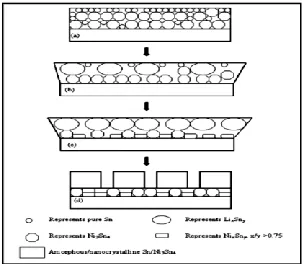
structure, (b) lithiation of excess Sn in the surface causing some plastic deformation of the
substrate, (c) decomposition of Ni3Sn4 and further lithiation of the Sn and plastic deformation
of the copper and (d) fracture on delithiation. ... 21
Figure 1.15. Discharge capacity of melt-spun Al/Si/Mn alloys depending on cycle number. 22 Figure 1.16. Capacity vs. cycle number plots for Li/Cu6Sn5 and Li/Sn cells in the range of 0.0-1.2 V. ... 23
Figure 1.17. Cycle performances of Mg and Mg0.75Ni0.25 electrodes. ... 24
Figure 1.18. Cycle performances and schematic diagrams of Si/carbon composites/Li cell: (a) discharge capacity; (b) efficiency; (c) MC (microsize) and (d) NC (nanosize). ... 25
Figure 1.19. Comparison of different cathode materials in terms of their crystal structures. 26 Figure 1.20. Crystal structures of (a) layered lithiated transition metal oxides, LiMO2 (M = Ni, Co, Mn), and (b) the cubic spinel LiMn2O4. ... 27
Figure 1.21. Cycling stability of LiNiO2 cathode at 0.5 mA cm-2. ... 28
Figure 1.22. The structure of (a) cubic spinel and (b) orthorhombic LiMn2O4. ... 29
Figure 1.23. Crystal structures of (a) LiFePO4 and (b) a layer of the LiO6 along the b–c plan shows the two lithium diffuse passes along b-axis and c-axis. ... 30
Figure 1.24. Sony’s original synthetic route for LiMPO4-type cathode composites. ... 31
Figure 1.25. Crystal structure of LiFePO4. ... 33
Figure 1.26. Typical routes for producing LiFePO4 powders using solid-state methods. ... 34
Figure 1.29. (a) Model image of the triaxial nanowire with a MWCNT core column, and the
two layer shells and corresponding (b) SEM and (c) TEM images. ... 79
Figure 4.1.Schematic diagram of experimental procedure. ... 91
Figure 4.2. (a) Heat treatment of LiFePO4 precursor/PAN nanofibers, and (b) stabilization
and (c) carbonization of PAN. ... 93
Figure 4.3. SEM images of LiFePO4 precursor/PAN nanofibers electrospun from (a) S1, (b)
S2, and (c) S3, and (d) their diameter distributions. ... 96
Figure 4.4. SEM images of LiFePO4/C composite nanofibers prepared from (a) S1, (b) S2,
and (c) S3, and (d) their diameter distributions. ... 97
Figure 4.5 (a) SEM image and corresponding EDS maps of (b) phosphorus, (c) iron, (d)
carbon, and (e) oxygen in LiFePO4/C composite nanofibers prepared from S2. ... 99
Figure 4.6. TEM images of LiFePO4/C composite nanofibers prepared from (a) S1, (b) S2,
and (c) S3. ... 100
Figure 4.7. X-Ray diffraction patterns of (a) LiFePO4/C composite nanofibers obtained from
S1, S2, S3 and pristine LiFePO4, (b) LiFePO4/C composite nanofibers obtained from S2
using different stabilization temperatures, (c) LiFePO4/C composite nanofibers obtained from
S2 using different calcination/carbonization temperatures, and (d) LiFePO4/C composite
nanofibers obtained from S2 using different calcination/carbonization times. The reflections
from S1, S2, and S3. Charge-discharge rate: 0.1C. ... 104
Figure 4.9. Cycling performance curves of LiFePO4/C composite fiber cathodes prepared
from S1, S2, and S3. Charge-discharge rate: 0.1C. ... 105
Figure 4.10. Effect of stabilization temperature on the discharge capacity of LiFePO4/C
composite nanofibers. Charge-discharge rate: 0.2C. ... 106
Figure 4.11. Effect of calcination/carbonization temperature on the discharge capacity of
LiFePO4/C composite nanofibers. Charge-discharge rate: 0.1C. ... 107
Figure 4.12.Effect of calcination/carbonization time on the discharge capacity of LiFePO4/C
composite nanofibers. Charge-discharge rate: 0.05C. ... 108
Figure 4.13.Rate capability of LiFePO4/C composite nanofibers. Charge rate: 0.05C. ... 109
Figure 5.1. Schematic diagram of LiFePO4/CNT/C composite nanofibers as cathodes for
lithium-ion batteries. ... 115
Figure 5.2. (a) SEM image of as-received CNTs, and (b) FT-IR spectra of unfunctionalized
and functionalized CNTs. ... 116
Figure 5.3. (a) X-ray diffraction patterns and (b) Raman spectra of (i) pristine LiFePO4
powder, (ii) LiFePO4/C composite nanofibers, and (iii) LiFePO4/CNT/C composite
nanofibers. #: The reflections of LiFePO4 (ICDD No. 96-110-1112) are shown for
comparison. ... 124
Figure 5.4. SEM images and diameter distributions of (a, d) pristine LiFePO4 powder, (b, e)
(a) 80,000 , (b) 200,000 , and (c) 400,000 . All arrows indicate CNTs. ... 127
Figure 5.6. (a) Electrochemical impedance curves of pristine LiFePO4 powder, LiFePO4/C
composite nanofibers, and LiFePO4/CNT/C composite nanofibers, and (b) amplification of
medium and high frequency regions. ... 129
Figure 5.7. (a) Cycling performance, (b) initial voltage vs. capacity curves, and (c) rate
capabilities of pristine LiFePO4 powder, LiFePO4/C composite nanofibers, and
LiFePO4/CNT/C composite nanofibers. Charge–discharge rate used in (a, b) was 0.05 C. . 131
Figure 6.1. XRD patterns of (a) LiFePO4/graphene/C composite nanofibers, (b) LiFePO4/C
composite nanofibers, and (c) pristine LiFePO4 powder. (d) The reflections of LiFePO4
(ICDD No. 01-081-1173) are shown for comparison. ... 141
Figure 6.2. Raman spectra of (a) LiFePO4/C, and (b) LiFePO4/graphene/C composite
nanofibers. ... 143
Figure 6.3. SEM images and diameter distributions of (a, d) pristine LiFePO4 powder (b, e)
LiFePO4/C composite nanofibers and (c, f) LiFePO4/graphene/C composite nanofibers. ... 146
Figure 6.4. TEM images of (a, b) LiFePO4/C composite nanofibers and (c, d)
LiFePO4/graphene/C composite nanofibers. All arrows indicate graphene. ... 147
Figure 6.5. Initial voltage vs. capacity curves of pristine LiFePO4 powder, LiFePO4/C composite nanofibers, and LiFePO4/graphene/C composite nanofibers. Charge–discharge
nanofibers, and LiFePO4/graphene/C composite nanofibers. Charge–discharge rate: 0.05 C.
... 150
Figure 6.7. Rate capabilities of pristine LiFePO4 powder, LiFePO4/C composite nanofibers,
and LiFePO4/graphene/C composite nanofibers. Charge rate: 0.05 C. ... 153
Figure 7.1. Schematic diagram of preparation xLi2MnO3·(1-x)LiMn1/3Ni1/3Co1/3O2 composite
cathode materials for lithium-ion batteries. ... 157
Figure 7.2. X-ray diffraction patterns of xLi2MnO3·(1-x)LiNi1/3Co1/3Mn1/3O2 composites
where (a) x = 0.1, (b) x = 0.2, (c) x = 0.3, (d) x = 0.4, and (e) x = 0.5. #: The reflections of
LiMn1/3Ni1/3Co1/3O2 (ICDD No. 98-016-2294) are shown for comparison. ... 162
Figure 7.3 SEM images and particle size distributions of xLi2MnO3·(1-x)LiNi1/3Co1/3Mn1/3O2
composites where (a, f) x = 0.1, (b, g) x = 0.2, (c, h) x = 0.3, (d, i) x = 0.4, and (e, j) x = 0.5.
... 164
Figure 7.4. TEM image of 0.3Li2MnO3·0.7LiMn1/3Ni1/3Co1/3O2 powder. ... 165
Figure 7.5. Galvanostatic charge/discharge curves of xLi2MnO3·(1-x)LiNi1/3Co1/3Mn1/3O2
composites where (a) x = 0.1, (b) x = 0.2, (c) x = 0.3, (d) x = 0.4, and (e) x = 0.5 at 0.1C.. 166
Figure 7.6. Cycling performances of xLi2MnO3·(1-x)LiNi1/3Co1/3Mn1/3O2 composites. (a)
Discharge capacity, and (b) coulombic efficiency. ... 168
Figure 7.7. Initial discharge curves of 0.3Li2MnO3·0.7LiMn1/3Ni1/3Co1/3O2 under different
C-rates. ... 170
CHAPTER 1. INTRODUCTION
1.1. Overview of electrospinning
The synthesis and fabrication of one-dimensional (1D) nanostructures with a variety of
forms, such as nanotubes, nanowires, nanobelts, and nanofibers, have gain intensive attention
in recent years due to their extraordinary properties and intriguing applications in many areas
including tissue engineering, catalysis, sensors, biomedicine, filtration, reaction materials,
electrochemical electrodes, affinity membranes, nano-composites, etc. There are various ways to produce nanofibers such as, drawing,1 template synthesis,2, 3 phase separation,4
self-assembly,5, 6 or electrospinning (Figure 1.1). Among these techniques, continuous and long
nanofibers can be produced effectively via electrospinning.
Electrospinning is a simple process that creates nanofibers from polymer solution or
polymer melt by using electrostatic force. By this process, a nonwoven web with ultrafine
fibers having diameters in the range of a few nanometers to a few microns can be produced.
Electrospinning is an old technique which is firstly observed by Rayleigh in 1897. Although,
the first setup using the electrospinning technology was patented by Formhals7 in 1934, it has
come into prominence in last 15 years.
Figure 1.1. Common nanofiber production techniques: (a) drawing,1 (b) self-assembly,5 (c)
template synthesis,3 and (d) phase separation.4
Electrospinning process (Figure 1.2) usually consists of a syringe fitted in a metered
pump, a high voltage (10-60 kV) power supply to charge the polymer solution, and a
(a) (b)
grounded collector plate separated by certain distance to deposit the fiber web. In the process,
electrical potential is applied between a capillary tube and a collector plate. By the effect of
electrical force, hemispherical shape of the droplet at the end of the capillary tube turns into a
conical shape, known as Taylor cone.8 When the applied electrical force overcomes to the
surface tension of the droplet, charged jet of polymer solution is ejected from the tip of
Taylor cone. As this jet travels in the air, it is accelerated by the electrical force, partially or
fully solidified through solvent evaporation and then collected as nanofiber mats on the metal
collector (Figure 1.2 inset). Fiber formation is extremely rapid process (in 10-3 s) and fiber
elongation ratio is extremely huge (around 105-106). These values are not accessible with
conventional fiber production methods, such as fiber extrusion followed by mechanical
stretching.9
1.2. Applications of electrospun nanofibers
In recent years, there has been a strong interest in developing new applications for
electrospun nanofibers due to their unique properties including long length, high porosity,
and high surface area. As proposed by Reneker et al.,9 electrospun nanofibers can be used as reinforcing fibers in composite materials, wound dressing materials, non-wetting surface
layer on ordinary textiles, or polymeric separation membranes.
Electrospun nanofibers can be used as supporting materials for catalysts. Electrospun
TiO2, ZnO2, and SnO2 nanofiber mats are strong substrates for loading many metal
nanostructures (such as Pt, Rh, or Pd) used in catalytic applications.11 Due to their large
surface area, metal-coated electrospun nanofibers exhibits enhanced catalytic ability for a
number of reactions. Therefore, electrospun TiO2 nanofibers can be directly used as
photocatalyst for hydrogen evoluation due to their semi-conductive nature.12
Electrospun nanofiber membranes have superior capability to remove small particules
from air or aqueous solutions. They are widely used as filters due to their macroporous
structures.13 Fe2O3, SnO2, TiO2, and ZnO loaded nanofibers or metal-oxide ceramic
nanofibers can also be used as gas sensors to detect NO2, CO, O2, H2, CH3OH, etc.14-16
One-dimensional characteristics of electrospun nanofibers make them attractive
candidates for energy conversion/storage devices including solar cells. Electrospun carbon
nanoparticles supported by CNFs are used in direct methanol fuel cells and show improved
electrocatalytic ability.17 Electrospun TiO2 nanofiber membranes are used in dye-synthesized
solar cells as photoelectrodes.18, 19
Electrospun nanofibers have also been explored as anodes, cathodes or separators in
lithium-ion batteries.20 Ji et al. used CNFs, metal oxide/carbon and metal/carbon composite nanofibers as binder-free anodes for rechargeable lithium-ion batteries (LIBs).21-29
Electrospun polyvinylidene fluoride nanofibers are used as polymer electrolyte membranes30,
31
or separators32 for LIBs.31 Electrospun LiCoO2,33 LiNiO2,34 and LiFePO4/C35, 36
composite nanofibers were also produced as positive electrodes for rechargeable LIBs
(Figure 1.3). As shown in Figure 1.4, Chen et al.37 produced LiCoO2/C nanofibers from electrospun LiCoO2 precursor/polyvinylpyrrolidone (PVP) composite nanofibers.
Figure 1.3. The schematic diagrams of (a) active material, (b) active material-carbon
Figure 1.4. (a) SEM and (b) TEM image of LiCoO2/C nanofibers.37
1.3. Overview of batteries
A battery is a device that converts the chemical energy contained in its active materials
directly into electric energy by means of an electrochemical oxidation-reduction (redox)
reaction. Today, it is believed that the first modern electric battery was invented by
Alessandro Volta in 1800. According to archeological findings of Wilhelm König in 1938
(near Baghdad, Iraq), battery has a possible history goes back to 248 BC.38, 39 These findings
and their schematic presentation is shown in Figure 1.5.
Figure 1.5 (a) Ancient “Baghdad Battery”, and (b) its schematic presentation.40
While the term “battery” is often used, the basic electrochemical unit being referred to is
the “cell”. A cell is the basic electrochemical unit providing a source of electrical energy by
direct conversion of chemical energy. The cell consists of an assembly of electrodes,
separator, electrolyte, container and terminals. A battery consists of one or more
electrochemical cells, electrically connected in an appropriate series/parallel arrangement to
provide the required operating voltage and current levels, including, if any, monitors,
controls and other ancillary components (i.e. fuses, diodes), case, terminals and markings. The cell consists of three major components41:
- The anode or negative electrode, i.e. the reducing or fuel electrode, which gives up electrons to the external circuit and is oxidized during the charging.
- The cathode or positive electrode, i.e. the oxidizing electrode, which accepts electrons from the external circuit and is reduced during charging.
- The electrolyte, the ionic conductor, which provides the medium for transfer of charge, as ions, inside the cell between the anode and cathode. The electrolyte is typically a
liquid, such as water or other solvents, with dissolved salts, acids, or alkalis to impart
ionic conductivity. Some batteries use solid electrolytes, which are ionic conductors at
the operating temperature.
In most batteries, porous structure is of great importance. A sponge-like electrode will
have high discharge current and capacity, and a porous separator between the electrodes can
effectively stop the short circuit, but allow the exchange of ions freely.42 Electrochemical
operation of a cell is shown in Figure 1.6.
Figure 1.6.Electrochemical operation and internal construction of a typical cell.41, 43
1.3.1. Classification of batteries
Batteries available in the market are usually classified as primary and secondary batteries
in terms of their reusabilities.
1.3.1.1. Primary batteries
Primary batteries, irreversibly (within limits of practicality), transform chemical energy
to electrical energy. When the initial supply of reactants is exhausted, energy cannot be
readily restored to the battery by electrical means. The following are some common primary
lithium batteries44:
- Lithium/sulfur dioxide (Li/SO2) batteries
- Lithium/thionyl chloride (Li/SOCl2) batteries
- Lithium/manganese ioxide (Li/MnO2) batteries
- Lithium/carbon monofluoride (Li/CFx) batteries
1.3.1.2. Secondary batteries
Secondary batteries can have their chemical reactions reversed by supplying electrical
lithium-ion, lithium-ion polymer, lithium-sulfur, molten salt, nickel-cadmium, nickel-iron,
nickel hydrogen, nickel-zinc, sodium-sulfur, zinc-bromine flow batteries are some of
secondary batteries. As shown in Figure 1.7, lithium-ion batteries have the 40% share of the
battery market. In the last decade, production volume of lithium-ion batteries increased more
than 2 times. According to energy experts, the production will increase 10 times more in the
following 20 years to accommodate energy necessities of next generation.
1.4. Overview of lithium-ion batteries
Lithiumis an alkali metal with silver-white appearance, soft handle, low density (0.534 g
cm-3), large specific capacity (3860 Ah kg-1), low electrochemical potential, high
electro-negativity, and high energy density.46, 47 As an alkali metal, lithium is highly reactive, and
hence it is found in nature as compounds that can be used for different applications, such as
pharmacology, aerospace, construction, and energy storage. Lithium-ion batteries get their
name from the lithium ion that moves from the anode to the cathode during discharging and
Figure 1.7. (a) Total battery production statistics in 2010 45 and (b) growth of lithium-ion
battery industry since 2000 (Original data supplied by the Battery Association of Japan)
2000 2001 2002 2003 2004 2005 2006 2007 2008 2009 2010 2011 0 1x10⁶ 2x10⁶ 3x10⁶ 4x10⁶ 5x10⁶ 6x10⁶ 7x10⁶ 8x10⁶ Q u a n ti ty Lithium-Ion Batteries Other Secondary Batteries Primary Batteries
2000 2001 2002 2003 2004 2005 2006 2007 2008 2009 2010 2011 0.0 2.0x10⁵ 4.0x10⁵ 6.0x10⁵ 8.0x10⁵ 1.0x10⁶ 1.2x10⁶ 1.4x10⁶ 1.6x10⁶ 1.8x10⁶ 2.0x10⁶ 2.2x10⁶ Q u a n ti ty
Other Secondary Batteries Lithium-ion Batteries
(a)
Rechargeable lithium-ion batteries, which are based on lithium chemistry and were first
commercialized by Sony in 1992,48 are of importance as new generation power sources
because they are lighter and have higher energy density, lower self discharge, no memory
effect, prolonged service-life, larger number of charge/discharge cycles, better environmental
friendliness, and higher safety when compared to many other battery systems.44 Hence,
lithium-ion batteries are being widely used for portable electronics from digital cameras to
notebooks and music players to cell phones (Figure 1.8). They are also potential systems for
large-scale applications, such as electric vehicles and storage devices for future power grids,
if they can be produced with lower cost, smaller sizes, lighter weights, and higher energy
storage capacities.
A standard lithium-ion battery consists of anode, cathode and electrolyte, as shown in
Figure 1.9. When the battery is charged, lithium ions deintercalate from the cathode and
intercalate into the anode through the electrolyte; while on the discharging process, lithium
ions deintercalate from the anode and intercalate into the cathode. During charge/discharge
cycles, electrons flow between the anode and the cathode, enabling the conversion of
chemical energy and also the storage of electrochemical energy within the battery. Therefore,
the performance of a rechargeable lithium-ion battery strongly depends on the active
Figure 1.8. (a) Comparison of different energy storage systems and (b) applications of
lithium-ion batteries.
The common materials for anodes are carbon, lithium-alloying metals, graphite varieties
(such as modified natural graphite or kish graphite), and carbon nanotubes/nanofibers. The
most used cathode material is LiCoO2, which is currently being used in commercial
lithium-ion batteries found in portable electronic devices such as laptops and cell phones. However,
the high cost, poor thermal stability at elevated temperatures and high toxicity of LiCoO2
make it an unsuitable material for larger-scale applications. Therefore, battery manufacturers
have turned to find other alternative materials to replace LiCoO2, and examples of such
materials include layered lithium nickel oxide (LiNiO2), lithium manganese spinels
(LiMn2O4), vanadium oxides (LiV3O8), and olivines (LiMPO4, M = Fe, Co, Mn or Ni).49
Common anode and cathode materials used in lithium-ion batteries are briefly given in
Chapter 1.4 and 1.5, respectively.
Figure 1.9. (a) Charging and (b) discharging processes of a typical lithium-ion battery.50
1.4.1. Anode materials for lithium-ion batteries
Shukla et al.49 reported that most common anode materials were carbon-based materials, lithium-alloying metals, and their composites. Carbon-based anodes exhibit good chemical
and thermal stability, excellent mechanical stress tolerance (ductility), good electronic and
ionic conductivities, and also considerable Li-storage ability. Carbon matrix is used as the
host for Li-alloying metals and some transition metal oxides, to buffer the large volume
change resulting from repeated lithium insertion and extraction. These materials are given in
the following chapter, briefly.
e -e -e -e -e -e
-A
e- e
-Cathode Anode Li+ Li+ Li+ Li+ Li+
Li(1-x)FePO4
S ep a ra to r
LixC6
A) Charging Process
Electrolyte e -e -e -e -e -e
-A
e- e
-Cathode Anode Li+ Li+ Li+ Li+ Li+
LixFePO4
S ep a ra to r
Li(1-x)C6
B) Discharging Process
1.4.1.1. Carbonaceous anodes
The carbon materials have demonstrated lower initial irreversible capacities, higher
cycle-ability and faster mobility of Li in the solid phase. The carbon-based electrodes were
developed to eliminate problems of lithium metal deposition. On charge, lithium metal
electrodes deposit “moss-like” or “dendrite-like” metallic lithium on the surface of the anode.
Once such metallic lithium is deposited, the battery is vulnerable to internal shorting, which
may cause dangerous thermal run away. The use of carbonaceous material as the anode
active material can prevent such dangerous phenomenon. There are various types of carbon
materials which can be used as anodes in Li-ion batteries including highly oriented pyrolytic
graphite (HOPG), natural graphite, artificial graphite, hard carbons, mesophase low
temperature fibers and mesocarbon microbeads (MCMB).51 Figure 1.10 presents a scheme of
major classes of carbons, which are currently studied in connection with Li-ion battery
systems.
1.4.1.2. Novel graphite varieties
Shukla et al.49 reported about new modified natural graphites and other graphitic carbons such as kish graphites. The air oxidation of natural graphites results in kish graphites with
well above 372 mAh g-1 and their production costs are inexpensive compared with other
synthetic graphitic anodes.
Figure 1.10. Schematic representation of various types of carbons.43
1.4.1.3. Carbon nanotubes (CNTs)
There are several classifications of CNTs. According to configuration, they can be
divided into armchair, zigzag, and chiral; according to degree of graphitization, they can be
divided into amorphous and graphitic. Or according to structure, they can be divided into
classification can be seen in Figure 1.10. As reported by Shukla et al.49 MWCNTs are high-capacity anodes for lithium storage but their irreversible capacities are too large. CNTs also
have high charge-discharge rates, high electrical and thermal conductivities, and high tensile
and shear strength. To minimize irreversible changes, CNT anodes can be used with
lithium-alloying metals as composites.
1.4.1.4. Silicon
While graphite is a weak material, meaning that it can only absorb a certain amount of
ions, it can be repeatedly charged and discharged without significant issues. Silicon
alternatives, on the other hand, tend to swell when charged and shrink when discharged,
resulting in stress fractures. These make traditional silicon alternatives impractical for use
after several charge/drain cycles.53 Miller et al.54 reported that Li-Si composites provide an opportunity to improve the performance and safety of these batteries while reducing cost.
Theoretical capacity of Si is more than 4000 mAh g-1, and this value is larger than the
theoretical capacity of graphite. On the other hand, one drawback of these materials is the
significant expansion that occurs in the Si host during Li alloying (>300%). The repeated
expansion/contraction of the lattice during cycling degrades the Si structure, severely limiting
cycle life. These characteristics can be seen from the Figure 1.11. The sample with low Si
capacity is limited to 125 mAh g-1. The sample containing the higher Si content shows
improved capacity (>250 mAh g-1), but the cycle life was limited to 70 cycles. In addition,
the poor electrical conductivity of silicon (only 2.5 S cm-1) leads to heat generation upon
cycling due to the high internal resistance and limits the applicable charge current. The
enhanced cyclability of these materials can be attributed to a high degree of dispersion of the
elemental Si within the nanocomposite structure.
Figure 1.11. Comparison of capacity versus cycle life for Si-based nanocomposite anodes
produced by high impact ball milling.54
Wolf et al.55 reported that the 3D-carbon fiber substrate containing graphite was coated with nanosized silicon by using atmospheric microwave plasma. As seen from Figure 1.12,
longer coating time leads to larger silicon particles. Figure 1.13 shows that the carbon–
silicon content of 34 wt%. Reversible specific capacity is more than 1200 mAh g-1 for the 34
wt% sample.55
Figure 1.12. SEM-images of three carbon/silicon composites, prepared with different coating
time. Coating time: (a) 1 min, (b) 2.5 min, and (c) 5 min.55
Figure 1.13. First cycle reversible and irreversible specific capacity in dependence of silicon
1.4.1.5. Alloy anodes
Many alloy systems have been studied as anode materials for secondary lithium
batteries.56 It has been observed that metallic anodes are able to form lithium alloys offering
capacities superior to those of the carbon based systems (370 mAh g-1 for the theoretical
LiC6); however a severe problem is usually related to the formation and decomposition of a
lithium alloy; i.e., an impressive volume change. This change leads to mechanical stresses on the anode which may induce cracks and rapidly disintegration of the electrode. The cycle life
of the lithium alloy anode is therefore severely decreased and these electrodes usually offer
only a few cycles before their capacity fades.57 This problem has been significantly improved
by synthesizing intermetallic MM’ alloys with active (M) and inactive (M’) elements or by
ultrafine alloy powder. It is aimed to produce smaller sized particles to reduce the extent of
local volume change during cycling. Chen et al.58 showed these crack formation in Ni–Sn alloy during lithiation process as Figure 1.14.
Brousse et al.57 reported that two advantages of the metal oxides as anodes can be envisioned: one is that the metal obtained after decomposition of metal oxide is embedded in
a lithium oxide matrix which seems to help the metal to accommodate the volume change
during the formation and decomposition of the alloy; and the second advantage is that the
metal particles formed from the decomposition of the oxide can be very small and thus less
thermodynamically possible metal oxides in Table 1.1. In the table, the most promising
elements for anodes were marked with “*”.
Figure 1.14. Schematic of the crack formation in Ni–Sn alloy during lithiation (a) initial film
structure, (b) lithiation of excess Sn in the surface causing some plastic deformation of the
substrate, (c) decomposition of Ni3Sn4 and further lithiation of the Sn and plastic deformation
of the copper and (d) fracture on delithiation.58
Song et al.59 produced melt-spun Al0.6-xSi0.4Mnx (x = 0, 0.01, 0.03, 0.05, 0.07 and 0.1) alloys. A high-specific capacity (more than 500mAh g-1) and a stable cycling performance
(90% capacity retention) have been achieved in melt-spun Al0.55Si0.40Mn0.05 and
Table 1.1. Theoretical irreversible and reversible capacities calculated for some metal
oxides.57
Elements Li richest alloy
Oxide Qirrev
mAh g-1
Qrev mAh g-1
Qrev / Qirrev
Al* Li9Al4 Al2O3 1577 1183 0.8
Si* Li22Si5 SiO2 1785 1963 1.1
Zn* LiZn ZnO 659 329 0.5
Ag* Li12Ag Ag2O 167 2000 12
Ga Li2Ga Ga2O3 858 572 0.7
Ge Li22Ge5 GeO2 1025 1128 1.1
As Li3As As2O3 813 813 1.0
Se Li2Se SeO2 966 483 0.5
Sr Li23Sr6 SrO 517 992 1.9
Ru LiRu3 RuO2 806 67 0.1
Rh LiRh Rh2O3 634 211 0.3
Pd Li5Pd PdO 438 1095 2.5
Cd Li3Cd CdO 418 626 1.5
Sohn et al.56 reported that the cycle performance of nanosized Cu6Sn5 electrode is significantly enhanced in comparison with that of the same material prepared by sintering or
mechanical alloying because of nanosized active material and recovery of the Cu6Sn5
intermetallic structure. The cycle performance of Li/Cu6Sn5 and Li/Sn cells in the voltage
range 0.0-1.2V is shown in Figure 1.16. Cu6Sn5 alloy has shown a better capacity-retention
characteristic than Sn.
Figure 1.16. Capacity vs. cycle number plots for Li/Cu6Sn5 and Li/Sn cells in the range of
0.0-1.2 V.56
Whittingham et al.60 produced manganese-oxide nanofibers by the electrospinning of poly-methyl methacrylate gels containing manganese salts. These nanofibers showed
reversible electrochemical activity in lithium cells. The electrospun fibers have average
organic polymer and have high specific capacity (more than 450 mAh g-1 for at least 50
cycles).
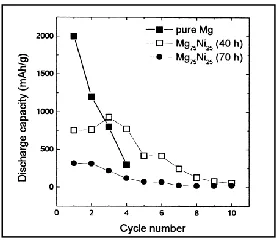
Sohn et al.61 prepared alloys of Mg0.5Ni0.5, Mg0.67Ni0.33 and Mg0.75Ni0.25 by mechanical alloying and they reported that Li was alloyed and dealloyed reversibly with Mg at very low
voltage region below 100 mV, and the initial capacity obtained was approximately 3070
mAh g-1. Mg0.5Ni0.5 was amorphous and Mg0.67Ni0.33 was crystalline, while Mg0.75Ni0.25 was a
mixture of Mg and Mg2Ni phases. It was demonstrated that only Mg0.75Ni0.25 reacted
significantly with Li at room temperature while Mg0.67Ni0.33 reacted with Li at high
temperature. Mg0.75Ni0.25 shows enhanced cycle performance compared to that of pure Mg
(Figure 1.17).
Figure 1.18. Cycle performances and schematic diagrams of Si/carbon composites/Li cell: (a)
discharge capacity; (b) efficiency; (c) MC (microsize) and (d) NC (nanosize).62
Senna et al.62 reported that the nanometer Si/carbon composite anode electrode shows better cyclability compared to conventional micron-sized Si/carbon composites. As can be
seen from Figure 1.18, the combination of composite fabrication with carbon materials in
nanosize and the downsizing of Si powder improve the cyclability of Li-ion battery.
1.4.2. Cathode materials for lithium-ion batteries
To date, many types of materials have been investigated as cathode materials for
lithium-ion batteries. Commonly used cathode materials for lithium lithium-ion batteries are LiCoO2,
LiNiO2, LiMn2O4, and LiFePO4.63 Comparison of specific capacity ranges of cathode
Figure 1.19. Comparison of different cathode materials in terms of their crystal structures.
1.4.2.1. Layered lithium-metal oxides
Shukla et al.49 reported that lithiated nickel and cobalt oxides, LiMO2 (M= Ni, Co or Ni/Co) are the most studied cathodes for lithium-ion batteries. Structure of layered LiMO2 is
shown in Figure 1.20a. Layer structured LiCoO2 is the most widely used material for
commercial production, because of its simple preparation. Its average capacity is 140 mAh g
-1
. In addition to these, LiCoO2 has various drawbacks including various cost and
environmental risks.63 LiNiO2 has same crystal structure with LiCoO2 and it is shown in
Figure 1.20. Crystal structures of (a) layered lithiated transition metal oxides, LiMO2 (M =
Ni, Co, Mn), and (b) the cubic spinel LiMn2O4.49
The LiNiO2 provides important advantages, such as less toxicity, lower price and higher
reversible capacity (200 mAh g-1) as compared to LiCoO2. However, it suffers from a few
problems, such as irreversible phase transformation, difficulty in synthesis due to its
tendency to form Ni-rich, non-stoichiometric phases, thermal instability and safety concerns.
Wan et al.64 reported the initial discharge capacity of layered structure LiNiO2 material, prepared at low temperatures, is 169.5 mAh g-1and the initial coulombic efficiency is 92.4%.
As can be seen from Figure 1.21, LiNiO2 cathode exhibits good electrochemical
Figure 1.21. Cycling stability of LiNiO2 cathode at 0.5 mA cm-2.64
1.4.2.2. Lithium-manganese spinels
Lithium-manganese oxides with the spinel structure are of interest as lithium insertion
electrodes for rechargeable lithium batteries. Structure of the cubic spinel LiMn2O4 (lithium
manganese oxide) is shown in Figure 1.20b.49 A spinel compound, LiMexMn2-xO4 (Me =
Metal element), is an attractive cathode material for replacing Co or Ni based layered
cathode materials in the next generation of Li-ion batteries. Especially, it has been
extensively studied as positive electrode materials of large-size lithium-ion batteries for
power sources of hybrid electric vehicles, because they have several advantages such as
lower cost, high-rate capability and higher thermal stability compared to those of Co or Ni
based layered materials. The main obstacle to commercialize LiMn2O4 is the significant
tetragonal phase formation provided that the materials obtained at high temperatures are
rapidly quenched in the solid CO2. On the contrary, a small amount of excess lithium can
influence the cubic orthorhombic phase transition observed for stoichiometric LiMn2O4.
65-67
Figure 1.22. The structure of (a) cubic spinel and (b) orthorhombic LiMn2O4.67
1.4.2.3. Olivines
Padhi et al.68 first demonstrated that orthorhombic LiFePO4 could be used as a cathode for rechargeable lithium-ion batteries. It has a theoretical capacity of 170 mAh g-1 and is
environmentally benign and cheaper to produce compared with LiCoO2. Furthermore, it
shows excellent cycle stability due to structural similarity between charged/discharged states.
Specially, this material exhibits very good thermal stability. These properties make it an
attractive candidate for large scale batteries, such as power sources for electric vehicles and
hybrid electrical vehicles. Crystal structures of LiFePO4 and FePO4 are shown in Figure 1.23.
Charge/discharge reactions can be written as follows:
LiFePO4 - xLi+ - xe- xFePO4 + (1 - x)LiFePO4 (charge) (1.1)
FePO4 + xLi+ + xe- xLiFePO4 + (1 - x)FePO4 (discharge) (1.2)
Figure 1.23. Crystal structures of (a) LiFePO4 and (b) a layer of the LiO6 along the b–c plan
shows the two lithium diffuse passes along b-axis and c-axis.69
Sony’s typical production route for LiMPO4-type cathode composites is given in Figure
1.24.70 Crystal structure and production methods of LiFePO4 will be analyzed in detail in the
Figure 1.24. Sony’s original synthetic route for LiMPO4-type cathode composites.70
1.5. Overview of LiFePO4
Among various alternative cathode materials, lithium iron phosphate (LiFePO4), which
was discovered by Goodenough in 199771, is gaining significant attention because of its
relatively low cost, high discharge potential (very flat voltage curve around 3.4 V versus
Li/Li+), large specific capacity (170 mAh g-1), good thermal stability, excellent cycling
performance, and high abundance with the environmentally benign and safe nature.
However, LiFePO4 also has its own limitation such as low conductivity (~10-9 S cm-1), which
leads to high impedance and low rate capability for batteries using that material.71
Approaches to solve that problem include but not limited to: doping LiFePO4 with
supervalent cations that enhance the material conductivity at the crystal level,72, 73 coating
decreasing the particle size of LiFePO4 in order to make the diffusion path of lithium
shorter.76, 77 These approaches can be realized by using novel fabrication technologies.
This chapter presents an overview of recent advances in the fabrication of
high-performance LiFePO4 powders for lithium-ion batteries. The LiFePO4 powder fabrication
methods covered include: solid-state synthesis, mechanochemical activation, carbothermal
reduction, microwave heating, hydrothermal synthesis, sol-gel synthesis, spray pyrolysis,
co-precipitation, microemulsion drying, and others. The impacts of these fabrication methods on
the structure and performance of LiFePO4 powders are discussed. In addition, the
improvement of the conductivity of LiFePO4 powders through novel powder technologies is
addressed.
1.5.1. Crystal structure of LiFePO4
LiFePO4 has an ordered olivine structure with a Pnma space group, in which P atoms
(PO4) reside within tetrahedral 4c sites, and Fe and Li cations (FeO6 and LiO6) reside within
octahedral 4c and 4a sites, respectively, as shown in Figure 1.25. Oxygen atoms show
slightly distorted hexagonal close packed arrangement48, 71. FeO6 is a corner shared
octahedron and PO4 is an edge-shared tetrahedron, and they form the zigzag skeleton by
sharing oxygen and Li ions locate in the octahedral channels. The FeO6 octahedra are
axis and a PO4 tetrahedral shares the edges with one FeO6 and two LiO6. The PO4 tetrahedral
structure is the reason for the good phase stability during lithium deintercalation.48, 68, 78-81
Figure 1.25. Crystal structure of LiFePO4.
LiFePO4 powders can be prepared by both solid-state and solution-based methods.
Solid-state techniques are carried out at high temperatures without any solvent addition. On the
other hand, solution-based methods are based on reactions that take place with the presence
of appropriate solvent systems.
Li
+FeO
6PO
41.5.2. Solid-state methods for LiFePO4 production
Solid-state synthesis, mechanochemical activation, carbothermal reduction and
microwave heating are based on solid-state chemistry and are the most common solid-state
methods for preparing LiFePO4 powders. Figure 1.26 shows typical routes used in these
solid-state methods. Solid state methods are of importance in terms of obtaining ordered
crystal structure in a simple way at elevated temperatures.
Figure 1.26. Typical routes for producing LiFePO4 powders using solid-state methods. Solid-State Synthesis: Precursors Mixing Pelletizing Precalcinating
Mechanochemical
Activation: Precursors
Mixing and Activating by
High Energy Ball-Milling
Pelletizing Precalcinating
Carbothermal Reduction:
Precursors
Calcinating* Grinding POWDERS
Reducing Agents
Mixing
Microwave Heating:
Precursors
Mixing
Pelletizing
Microwave Absorbers
1.5.2.1. Solid-state synthesis
Solid-state synthesis is a technique used to produce chemical structures by reactions
carried out at extreme conditions, such as high temperature and pressure, without any
solvent. This method is generally used for the mass production of unique, advanced
structures, such as special ceramics, scintillation crystals, and piezoelectrics. LiFePO4
powders can be fabricated using the solid-state synthesis method and Table 1.2 shows typical
precursors used in this method and the particle size and discharge capacity of the resultant
LiFePO4 powders. The most commonly used precursors are Li2CO3 or LiOH·H2O for Li,
FeC2O4·2H2O or Fe(C2O4)2 for Fe, and NH4H2PO4 for PO4, respectively.82-86 However, other
precursors can also be used. For example, Wang et al.87 used LiF to replace LiOH·H2O and Li2CO3 and obtained LiFePO4 powders with an average particle diameter of around 500 nm.
These LiFePO4 powders have good electrochemical performance, but the release of HF gas, a
byproduct of reaction, should be appropriately managed during powder production.
The solid-state synthesis of LiFePO4 powders typically starts with the mixing of
precursors by ball-milling or other techniques (Figure 1.23). For example, Fey et al.88
prepared LiFePO4/C powder by ball milling of mixed precursors for 3, 12 and 18 hours,
followed by heat treatment at 600°C. An 18 hour ball-milling time was found to produce
LiFePO4 powders that have an average particle size of 188 nm and a good discharge capacity
precursors can also be mixed by generating dispersion in a solvent such as acetone, followed
by solvent evaporation.82, 86, 89-92
Mixed precursors can be pelletized and then calcined using one-step heat treatment. For
example, Li et al.93 prepared LiFePO4 powders by one-step heat treatment under vacuum at 700°C for 10 h. The resultant LiFePO4 powders have a particle size of 1 µm with a few
aggregations, and the discharge capacity is around 111 mAh g-1. Although one-step heat
treatment is convenient84, prepared mixtures are more often heat treated in two steps. The
first step (precalcination) is carried out at 250 - 350°C, which is designed for the
decomposition of the precursors and expelling of the gases. The second step is the final
calcination of powders, which occur at relatively high temperatures (400 - 800°C). The
calcination temperature has an important effect on the structure, particle size (particle
growth), and discharge capacity of LiFePO4 powders. For example, Yamada et al.82 synthesized LiFeO4 powders by solid-state synthesis at different temperatures and found that
the highest discharge capacity of 162 mAh g-1 was obtained by calcining the homogeneously
mixed precursors at 500 - 600°C. Takahashi et al.94 also fabricated LiFePO4 powders by solid-state synthesis and found that the optimum calcination temperature for achieving the
highest discharge capacity was 675°C. In addition to the calcination temperature, it is also
important to control the calcination atmosphere for avoiding oxidized byproducts, such as
Fe2O3 and Li3Fe2(PO4)3.82, 89, 91, 92 Atmospheres that can be used include inert (Ar), slightly
Table 1.2. Precursors used in the solid-state synthesis method, and particle size and electrochemical performance of the resultant LiFePO4 powders.
Li Precursor Fe Precursor P Precursor Metal Dopant Molar Ratio Carbon Source Product Particle Size (nm)
Discharge Capacity
(mAh g-1) Ref
Li2CO3 Fe(CH3 CO2)2 NH4H2PO4 1:1:1 LiFePO4 <30 162 (C/10) 82
Li2CO3 FeC2O4·2H2O NH4H2PO4 1:1:1 LiFePO4 92 83
Li2CO3 FeC2O4·2H2O NH4H2PO4 1:1:1 Polyvinyl alcohol LiFePO4/C 200-300 156 (C/10) 84
Li2CO3 FeC2O4·2H2O NH4H2PO4 1.03:1:1 Malonic acid LiFePO4/C 100-200 149 (C/5) 85
Li2CO3 FePO4(H2O)2 1:1 Cellulose acetate/sucrose LiFePO4/C 200-300 160 (C/4) 86
LiF FeC2O4·2H2O NH4H2PO4 1:1:1 LiFePO4 500 151 (C/15) 87
Li2CO3 FeC2O4·2H2O NH4H2PO4 1.03:1:1 Malonic acid LiFePO4/C 188 161 (C/10) 88
Li2CO3 FeC2O4 (NH4)2HPO4 LiFePO4 97
LiF FeC2O4·2H2O NH4H2PO4 1:1:1 LiFePO4 300-600 149 (C/5) 92
Li2CO3 FeC2O4·2H2O NH4H2PO4 1:1:1 LiFePO4 1,000 111 (C/8) 93
Li2CO3 Fe(C2O4)2 NH4H2PO4 MnCO3 0.5:y:1:1-y LiFeyMn1-yPO4 160 (C/2) 98
Li2CO3 FeC2O4·2H2O NH4H2PO4 1:0.97:1 LiFePO4/Fe2P 99
Li2CO3 FeC2O4·2H2O NH4H2PO4 1:1:1 LiFePO4 100
Li2CO3 FeC2O4·2H2O (NH4)2HPO4 1:1:1 Chitosan gel LiFePO4/C 90 (C/5) 101
LiOH·2H2O FeC2O4·2H2O NH4H2PO4 1:1:1
Glucose, Carbon
gel LiFePO4/C 500 163 (C/10) 102
LiOH·H2O FePO4·4H2O 1:1 Polypropylene LiFePO4 103
LiOH·H2O FeC2O4·2H2O NH4H2PO4 Nb2O5 0.99:1:1:0.01 Polypropylene Li0.99FeNb0.01PO4 103
Li2CO3 FeSO4 (NH4)2HPO4 LiFePO4 104
One limitation of pure LiFePO4 powders is their low electrical conductivity, which
results in poor rate capability. In solid-state synthesis, the conductivity of LiFePO4 powders
can be improved by introducing conductive carbon, which can be obtained by directly adding
a carbon source into the precursors. Yun et al.84 prepared LiFePO4/C powders by solid-state synthesis using polyvinyl alcohol (PVA) as a carbon source. The presence of PVA prevents
the particle growth during calcination because the polymer decomposes around the same
temperature of LiFePO4 formation. As a result, these LiFePO4/C powders have small
particle sizes ranging from 200 to 300 nm. The achieved maximum capacity in that work was
156 mAh g-1, but the cycling performance was poor.
The performance of LiFePO4/C powders can be improved by using other carbon sources
to replace PVA. Fey et al.85 used malonic acid as a carbon source, and the resultant LiFePO4/C powders (100 – 200 nm) have a discharge capacity 149 mAh g-1 at 0.2 C and a
good cycling performance. In addition to malonic acid, other carbon sources that have been
studied include but not limited to chitosan, glucose, cellulose acetate, and sucrose.86, 101, 102
In addition to carbon, metal dopants can be added in solid-state synthesis to adjust the
structure and performance of LiFePO4 powders. Mi et al.103 used Nb2O5 as a metal dopant to form Nb-doped Li0.99Nb0.01FePO4 powders by solid state synthesis. MnCO3 has also been
Solid-state synthesis is of importance in terms of obtaining unique structures; however,
reactions take place in a solid phase, which requires high temperature, high energy, long
processing time, repeated grinding, and special atmosphere. As a result, the product cost of
solid-state synthesis is relatively high.
1.5.2.2. Mechanochemical activation
Mechanochemical activation is one of the most common methods for preparing metal and
alloy powders, and is mainly based on increasing the chemical reactivity of the mixtures by
high-energy ball milling. The main reasons for the enhancement of reactivity can be given as:
the formation of free valences on the outermost layer of the material and the increase in the
surface area where reactions take place. Mechanochemical activation enables the preparation
of powders with relatively low particle size and high surface area. However,
mechanochemical activation also has some drawbacks, such as higher impurity stemmed
from the milling medium and the rise of temperature during the high-energy milling
process.105 For the synthesis of LiFePO4 powders, the temperature rise during high-energy
ball milling may contribute to the decomposition of precursors, but is not sufficient for the
formation of LiFePO4 crystalline structure.105-107 Therefore, mechanochemical activation is
generally used as a preparation step prior to the classical solid-state synthesis, and the aim is
Franger et al.79 compared different synthesis methods and found that LiFePO4 powders prepared by the mechanochemical activation have pure, uniform, and well-crystallized
structure, and present higher specific capacity (150 mAh g-1 at 0.2 C) than those prepared by
conventional solid-state synthesis.
Table 1.3 shows typical precursors used in the mechanochemical activation method and
the particle size and electrochemical performance of the resultant LiFePO4 powders. As
shown in Figure 1.26, typical procedure starts with activating mixed precursors using
high-energy ball-milling for 3 - 15 hours, depending on the desired particle size, in air108 or in an
inert atmosphere.109 Mechanochemically activated mixtures are then pelletized and calcined
at elevated temperatures at 600 - 900°C in appropriate atmosphere such as 95% Ar + 5%
H2,108N2,42, 109, 110 or vacuum111 for 0.5 - 10 hours.108, 109, 111
To improve the electrical conductivity of LiFePO4 powders, carbon materials, such as
graphite, carbon black, and acetylene black, can be added to the mixtures during high-energy
ball milling.108 As reported by Shin et al.,108 among these three carbon materials, graphite gave the highest conductivity with the highest stability and capacity (141 mAh g-1 at 0.1 C)
because of its low charge transfer resistance and low ion migration resistance. The dispersion
of carbon in LiFePO4/C composite powders is important. Porcher et al.112 investigated the effect of surfactants on the dispersion of carbon black in the LiFePO4/C powders, which were
produced by using mechanochemical activation. In their work, three different types of
process. It was found that non-ionic surfactant (Triton X-100) led to more homogeneous
carbon dispersion and the resultant LiFePO4/C powders have better electrochemical
performance than those prepared using ionic surfactants.
In addition to carbon, Fe2P can be used to modify the conductivity of LiFePO4 powders.
Kim et al.111 produced pure LiFePO4 and LiFePO4/Fe2P powders by mechanochemical activation, followed by calcination at 900°C for different time intervals under 10-6 Torr
pressure. Pure LiFePO4 showed a discharge capacity of 162 mAh g-1 and good capacity
retention. As reported, Fe2P had an important effect on the conductivity of the powders,
especially at higher concentrations; however, lower capacity values were obtained mainly
because of the increase in particle size and decrease in surface area. Maximum initial
discharge capacity obtained was 113 mAh g-1 for LiFePO4/Fe2P powders (Fe2P: 8 wt%).
The particle sizes of LiFePO4 and LiFePO4/C powders prepared by mechanochemical
activation are typically in the range of 60 - 300 nm.108, 109 In addition to conventional
mechanochemical activation, modified methods can be designed to furth