Y.C. Liu
Center for Communications and Signal Processing Electrical and Computer Engineering
and H.G. Perras
Center for Communications and Signal Processing Department of Computer Scjience
North Carolina State University Raleigh, NC 27695-8206
An approximation algorithm for analyzing a closed queueing systems with a K-dimensional fork/join queue is presented. The procedure is based on Norton's
theorem. Comparisons with exact numerical data and simulation data show that the approximation procedure gives results which are an upper bound of the mean
response time of the fork/join operation and a lower bound of the system
throughput, for both homogeneous and non-homogeneous cases. JoA...modification of
this procedure, applicable only to the homogeneous case, is also presented. This
procedure was found to. give very good results for the system throughput and the
1. In troduction
In recent years, there has been a growing interest in the development of tools
for analyzing the performance of distributed and parallel processing systems. In
such systems, quite often, a job is split into two or more sub-jobs. These sub-jobs
execute independently of one another, and at the end of their execution, they
recompose to the original job. These type of operations are known as fork/join or
disassembly / assembly in production system. They occur in multiprocessor
comput-ing systems, distributed database systems, telecommunication systems and flexible
manufacturing systems;
In
this paper, we consider a closed queueing system with a K-dimensionalfork/join queue and ~f identical jobs. When a primary job finishes its service at
the fork node it is split into a fixed number K (K>2) of sub-jobs called siblings.
Each sibling executes independently of one another. A sibling upon completion of
its
service enters the synchronization queue where it waits for the other siblings ..As soon as all the siblings have been served, they merge into the original primary job. We call the time between the fork and the join operation of a job as the response time. Also, the time a sibling spends waiting for the other siblings is referred to as the synchronization delay.
most of these systems reported in the literature have been analyzed using various approximation methods.
Flatto [6,1] considered a fork/join queueing system, assuming that jobs arrive
in a poisson fashion. Upon arrival, a job is split into two siblings, each sibling is
served by a different server. The service time at each server is exponentially distri-buted with a different mean. As soon as the two siblings have been served,
they
recompose into a primary job which leaves the system immediately. Flattoobtained the stationary distribution of the response time, and for each queue he
obtained the queue length distribution and its expectation conditioned upon the
other queue. Heidelberger and Trivedi [8] considered a queueing network model of
a computing system in which jobs divide into two or more asynchronous tasks, i.e.,
synchronization between tasks is not required. They developed an algorithm which use an iterative technique for solving a sequence of product form type
queue-ing networks. In [9], they extended the model to include a join node. Two
approxi-mation methods were developed. The first one was based on a decomposition
approximation, consisting of an inner model, a product form queueing network,
and an outer mode!, a finite state markov chain. The other approximation was
based on the complementary delays method, which iteratively solves a sequence of
product form queueing networks. Nelson and Tantawi
[10}
proposed an approxi-mation technique, called the scaling approxiapproxi-mation. They assumed that the meanresponse time increases at the same rate as the number of sibling increase.
They
homogeneous fork/join queueing systems consisting of K (K~2) identical servers.
The forkfjoin queue was analyzed numerically as a closed network by Duda and Czachorski
[4].
The numerical approach is inherently limited to small problems.Also, Duda
[51
developed an approximation algorithm for analyzing the samesys-tem, by constructing an approximately equivalent queueing network with a
product-form solution. This approximation method was validated for only 3
siblings. The general model was considered by BacceIli and Makowski [2]. Their
analysis was based on renewal type of arguments. They concluded that an upper bound of the response time can be obtained using a GI/G/l mutually independent
parallel queueing system and a lower bound can be obtained using a
DIG/!
paral-lel queueing system. The tightness of these bound was not analyzed. Ammar and
Gershwin [1] presented an equivalence relation for disassembly/assembly
opera-tions in production systems. In particular, by studying the movement of holes,
they converted a 2-dimension disassembly/assembly system into an equivalent
tan-dem queueing network.
In this paper, we consider a closed queueing system with a K-dimensional
fork/ join queue. The system consists of homogeneous or non-homogeneous
exponen tial servers. The buffer size of each queue is infinite.. Using Norton'5
theorem (see Chandy, Herzog, and Woo [3]), we iteratively reduce the
K-dimensional fork/join queue into a 2-K-dimensional fork/join queue. This
approxi-mation method gives a lower bound of the system throughput and an upper bound
difference of the system throughput between the approximate solution and the exact solution proportionally increased as the number of siblings increased. Hence,
we developed a modification procedure in order to improve the accuracy of the approximation algorithm. The relative error of the system throughput and the
response time of the modified approximation algorithm was found to be less then
3%.
In the following section, we describe the fork/join model. In section 3, we
-present an approximation algorithm for analyzing a closed queueing system with a
fork! join queue. In section 4, we describe the modification procedure. Finally, the conclusions are given in section 5.
2. Model Description
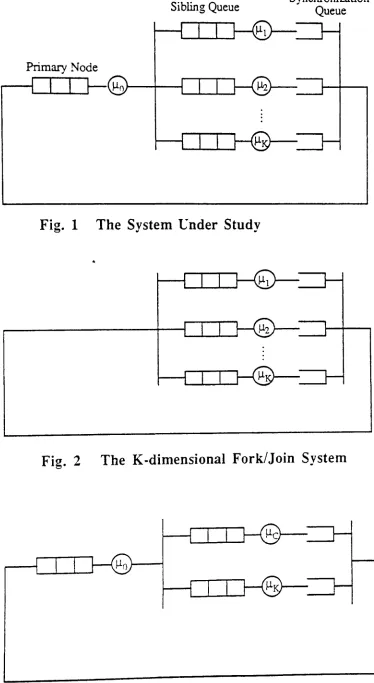
The model studied in this paper is a closed queueing system consisting of a primary node and a K-dimensional fork/join queue, as shown in figure 1. The
K-dimensional fork/join queue consists of K servers arranged in parallel. Each server
has its own queue, hereafter called the sibling queue. For each sibling queue there is a synchronization queue.. The capacity of each queue is assume to be infinite, the
service time of each server is exponentially distributed, and the service discipline is
FIFO. Let M be the number of primary jobs in the system. Each primary job is
split up into K siblings (fork operation) upon completion of its service at the
pri-mary node. Each sibling joins a different sibling queue. Upon completion of its
associated with the same job. When all siblings have completed their service, i.e.,
each sibling is in its synchronization queue, they recompose immediately to the
ori-ginal primary job which joins the primary node. At time t, let P(t) be number of primary jobs, Si(t) be number of siblings in sibling queue i, \Vi(t) be number of
siblings that have been serviced and are waiting in the ith synchronization queue, i
= 1,2 ... K. Then, at any given time
t,
M = P(t)+
Si(t)
+
Wi(t),
i=
1,2...K.The motivation behind studying this fork/join system as a closed queueing
.network, is that it allows us to incorporate approximately fork/join operations in a
BCMP type of a queueihg networks. Let us consider, for example, a queueing
net-work of the BC~lP type, and let us assume that jobs after completing service at node i, are split up into K siblings. Each sibling enters a different queue. When all
siblings complete their service, they merge into a single job which joins some other
queue in the system. Queue i along with the fork/ join queue can be replaced
approximately by an equivalent server, so that the resulting queueing network is in
the BCNfP type .. This equivalent server can be obtained by analyzing queue i and
the fork/join queue as a closed queueing network (as shown in figure 1), with yf
jobs in it, where Yl varies from 1 to the total number in the system. This paper
concentrates on the analysis of such closed queueing networks with a fork/join
queue .. The approximate substitution of this system by an equivalent server in a
In order to analyze the above model, we developed both a numerical
pro-cedure and an approximation algorithm. The numerical procedure involved the
following steps:
(1)
generation of all the states of the system; (2) generation of therate matrix Q; and
(3)
solutionof
the linear system QxT=
0 in order to obtain thesteady state probability distribution. We note that the state space increases very fast seeing that the number of states is equal to
(M+l)K.
In view of this, thenumerical procedure is only suitable for analyzing small systems. On the other
hand, the approximation procedure described below can be used for any number of
siblings.
3. The ..Approximation Procedure
In this section, we discuss an approximation procedure for analyzing the
closed queueing network with a K-dimensional fork/ join queue as described above
and shown in figure 1. The approximation procedure can be briefly summarized as
follows. We first analyze approximately the K-dimensional fork/join queue shown
in figure 2. In particular, using Norton's theorem. this system is approximately
reduced to a 2-dimensional system, which is then used to replace the
K-dimensional system in the original queueing network as shown in figure 3. This
queueing system isthen analyzed numerically, as described above.
Let us first consider the fork/join queue shown in figure 2, assuming that K
=
2. LetJ-Ll(i)
andJL2(i)
be the state-dependent service rate of sibling queue 1 and 2, isibling queue 1 and 2 respectively. It can be easily shown that this system has a product-form solution (see also Duda and Czachorski
[4]).
The stationary equations are as follows:PM,:M
(~1(M)+fJ.2(M))
=
fJ.l(M) PM,:M-l + fJ.2(M) PM-I,M
P:M,:'i
(fJ.l(~I)+fJ.2(~))
=~dNl)
PM,A'l-l + 1-L2(N+1)
P~f,~+l,
(1)
(2)
1 <: N -s M-l
PM,o
f..Ll(M)
=
P~l,l f..L~(1)PN,:M
(fJ.l(~)+fJ.2(~I))
=fJ.l(N+l)
P~+l,M
+ fJ.2(M) PN-1,M,
(3)
(4)
1
-s
~ < M-I 4PO,~
J..L2(M)
=
Pl,~{J..Ll(l)
M-l M-l
PM,M +
2:
PM,i +
2:
Pj;M
= 1i=O j=o
(5)
(6)
We can easily obtain
(7)
(8)
and
(9)
1
P'A:
~
=
M-I~
M-l~
- ,- 1
+
2:
Il
P2(j)
+
2:
n
Pl(N)
i=O j=i--l j=o N=j~l
The
systemthroughput,
T(~I),is :
M M-l
T(M)
=
L
f.Ll(i)
Pi.~1+
L
J.Ll(M)
PM,ji=l j=O
(10)
Using expression
(10)
in conjunction with Norton's theorem. we can now reduceapproximately the K-dimeosional fork/join system to a 2-dirnensional fork/join
system as follows.
Let us first number the sibling queues in figure 2 from 1 to K starting from the
top, The approximation algorithm can now be summarized as follows:
Step 1. Consider the closed queueing system consisting of sibling queues 1 and 2
(and their corresponding synchronization queues) obtained from figure 2 by
short-ing out the remaining sibling queues. Let T
(i),
i = 1,2, ..~1, be the throughput of this system, obtained using expression(10).
Replace this system by an equivalentcomposite node, call it C1, with a state-dependent service rate equal to T
(i).
Now, use composite node C1 and sibling queue 3 to form a new 2-dimensional fork/joinqueue. As above, construct an equivalent composite node, call it C
2-Proceed as above until the K-l sibling queues are replaced by an equivalent
composite node CK -2• The K-dimensional fork/join queue has now been reduced
to a 2-dirnensional queue consisting of the composite node CK - 2 and sibling queue K and their associated synchronization queues.
Step 2. In the original queueing network system substitute the Kvdimensional
figure
3).
Solve this model numerically to obtain the system throughput, the meanqueue length of the primary node, the Kth sibling queue, and its synchronization
queue. Also, by applying Little's relation one can obtain the mean waiting time in
each of these three queues, and the mean response time of the fork/join operation,
i.e., the mean time elapsing from the moment a job is split up to the moment it
joins again the primary node.
The above procedure yields performance measures for the primary node and
.the Kth sibling queue (and its synchronization queue). We can obtain performance
measures of any other sibling queue i, i
=
1,2,.. ,K-l and its associated synchroniza-tion queue, by simply exchanging sibling queue i with sibling queue K and thenapply the above algorithm.
The above algorithm was implemented on a VA...X 11/785. The approximate results were compared against exact numerical values for 3 and 4-dimensional
fork/join queues, and with simulation results for 8-dimensional fork/join queues.
The results for both homogeneous cases and non-homogeneous cases are presented
in tables 1 to 6. Each table gives the approximate and exact (or simulation) results
for the system throughput, mean queue lengths, and the mean response time of the
fork/join operation for various values of J.Lo. The relative error (expressed as a
In
general, the results obtained from the above procedure give a lower bound of the system throughput. This is due to the additional synchronization delay introduced each time a composite node is used to substitute a 2-dimensionalfork/join queue .. Obviously, this solution gives an upper bound of the mean
response time of the fork/join operation.
4. The Modified Approximation Procedure for Homogeneous Fork/Join
Queues
In this section, we.present a modification of the procedure described above that can be used to analyze the model shown in figure 1, under the assumption that all the sibling queues are served at the same rate (homogeneous system). The modified procedure aims at improving the accuracy of step 1. It is based on the
empirical observation that the difference between the exact throughput T
n(i)
of thea-dimensional fork/join queue and the approximate throughput
t
(i)
obtainedn
from step 1,proportionally increases as n increases. In particular.
Tn(i)
==
t
(i)[1+(n-2)a(i)], i=1,2, ....Y{..
nwhere
T
3(i)
a.(i)
= - - -
1,t
(i)
3
fork/join queue, in order to obtain T3
(i),
i = 1, 2, ...,~. 'YVe can also obtaint
(i),
i3
= 1. 2, ..,~1, approximately from step 1 of the above approximation algorithm.
Using these two quantities, we can obtain the correction factor a[i), i
=
1,2, ..,~1,which can then be used to construct an improved estimate of the system
throughput,
Te,K(i).
1=
1,2'._J~I. of the final 2-dimensional fork/join queue obtained from step 1. We haveBefore, we proceed. with step 2, we need to adjust the state-dependent service rate ...
c(i),
i = 1, 2, .. ,M, of the composite queue of the final 2-dimensional fork/joinqueue so that the system throughput is equal to Te.K(i), i
=
1, 2, ...M, This iscal-culated as follows :
1. set m = 1;
3.
4.
(i~l)(m)
=
Te.~(m)
*J.l(i)(m). UseJ.lJi+ll(m)
to obtain the adjustment...c T
M)(m)
ethroughput
TR"l)(m)
from equation (10).if
I
T ( ) T 0)( )I
<
~
,then set 1I".(m)=
IIJi}(rn) and go set i := i+
1; 1 e,K m - K m l:. r-... r- ...to step ,), else go to step 3.
stop-vVe can apply the same numerical procedure as in step 2to obtain the
approx-imate solution.
This modified approximation algorithm was implemented on a V4~'{-11/785.
The main results obtained is the system throughput, and the mean queue length of
the primary node, and of each sibling and synchronization queue. From this, other
performance measures, such as the mean response time of the fork/join operation
and the mean synchronization time for each sibling, can also be obtained. The
approximate results were compared against exact numerical values for
4-dimensional fork/join .queues, and with simulation results for 8-dimensional
fork/join queues. The results obtained are summarized in tables 7 to 8. Each
table gives the approximate and exact results or simulation results for the throughput, mean queue lengths and mean response time of the fork/join
opera-tion for various values of fJ.o. The relative error (expressed as a percen tage) is also given.
The modified procedure gives very good results for the system throughput and
the mean response time of the fork/join operation (the relative error is less than
3%). But, we get a big error for the mean queue lengths of a sibling queue and its
synchronization queue when
""0
>
1. We note, however, that the sum of these twoJ..Ll
mean queue lengths is practically equal to the exact solution.
We developed an approximation procedure for analyzing a closed queueing
network with a K-dimensional fork/join queue. The approximation procedure is
based on Norton's theorem, and it was shown through a number of examples that it gives results which are a lower bound of the system throughput and an upper
bound of the mean response time of the fork/join operation. The modified
pro-cedure is only applicable to the homogeneous case. It gives very good results for the
system throughput and the mean response time of the fork/join operation.
\Ve note that the original queueing network shown in figure 1 can be also approximately reduced-a two-node closed queueing networks consisting of the
ori-ginal primary node and a composite node with a state-dependent service rate equal to T
e,N(i).
This closed queueing network can be easily analyzed. The systemthroughput, the mean queue length of the primary node and the mean response
[1] Amrnar , M.H. and Gershwin, S.B., "Equivalence Relations in Queueing Models of Manufacturing Networks" , Proceeding of the nineteenth IEEE
Conference on Decision and Control, 1981.
[2] Baccelli, F. and Makowski, A.M., "Simple Computable Bounds for the Fork-Join Queue", The John Hopkins Conf. on Inf. Sc., John Hopkins l-., 1985.
[3]
Chandy, K.M.
and Herzog,U.
and Woo, L.~ "Parametric Analysis of Queueing Networks", IBNI J. Res. Develop. 19, 197.3,36-42.[4]
Duda, A. and Cz achorski, T .. "Performance Evaiuation 0" Fork .ind JoinSynchronization Primitives". to appear in ..\CT.~ Inforruation.
[5] Duda, .~.. "..Approximate Performance ..Analysis of parallel ~ystetll'''' Proc. of 2nd Inf. Workshop on .~ppl. Mathematics and Perforrnance/Reliabilitv
Models of Computer /Communication Systems. Rome. Italv. Mav :1:)-:2:-.
1987.
[6] Flatto,L. and Hahn, 5., "Two Parallel Queues Created by .Arrivals with Two Demands 1ft
,
SL-\.vI
J.
Appl. Math. vol. 44, Oct. 1984, 1041-1053.[7] Flatto,L., "Two Parallel Queues Created by Arrivals with Two Demands II", S!A.J.'YI
J.
Appl. ~fath. vol, 45, Oct. 1985,861-878.[8] Heidelberger, P. and Trivedi, S.K., "Queueing Network Models for Parallel Processing with Asynchronous Tasks", IEEE Trans. on Camp. vol. 31, ~ov. 1982,1099-1109.
[9] Heidelberger, P. and Trivedi, S.K., "Analytic Queueing Models for Pro-grams with Internal Concurrency", IEEE Trans. on Camp vol. 32, Jan. 1983, 73-82.
[10] Nelson, R. and Tantawi, A.N., "Approximate Analysis of Fork/ Join Synchronization in Parallel Queues", IBM Research Report RC 11481.
Primary
Node
Fig.
1
The System Under
Study
Fig. 2
The K-dimensional Fork/Join System
System Throughput
JJ.o/
J..Ll Exact Appro. error10.0 1.853 1.843 0.54%
5.0 1.852 1.840 0.65%
1.0 1.712 1.699 0.76%
0.5 0.998 0.998 0.00%
0.1 0.200 0.200 0.00%
Mean Response Time of Fork/join Operation
JJ.o/
1J.1 Exact Appro. error10.0 5.342 5.371 0.55%
5.0 5.279 5.314 0.66%
1.0 3.751 3.823 1.92%
0.5 1.705 1.792 5.10%
0.1 1.005 1.043 3.79%
Mean Queue Length at Primary Node
~o/J-Ll Exact Appro. error
10.0 0.1014 0.1009 0.49%
5.0 0.2238 0 .. 1230 0.35%
1.0 3.578 3.5050 2.00%
0.5 8.298 8.2190 0.95%
0.1 9.799 9.7910 0.08%
Mean Queue Length at Sibling Queue 1
JJ.o/JoLl Exact Appro. error
10.0 6.203 6.215 0.19%
5.0 6.123 6.130 0.11%
1.0 3.934 3.860 1.88:
0.5 0.991 0.998 0.70%
0.1 0.111 0.111 0.00%
• J.Ll
=
1.1.1~=2·J.L3=3.System Throughput
JJ.o/J-Lt Exact Appro. error
10.0 0.9998 1.0000 0.02%
5.0
0.9998 1.0000 0.02%1.0 0.9090 0.9091 0.01%
0.5
0.4997 0.4997 0.00%0.1 0.0999 0.1000 0.10%
-Mean Response Time ofFork/join Operation
..
JJ-o/
J.Ll Exact.
Appro. error10.0 9.8910 9.8890 0.02%
5.0 9.7520 9.7500 0.02%
1.0 5.5620 5.5720 0.18%
0.5 2.1610 2.1860 1.16%
0.1 1.3240 1.3510 2.06%
Mean Queue Length at Primary Node
JJ-o/'rJ.l Exact ..Appro. error
10.0 0.1111 0.1111 0.00%
5.0 0.2499 0.2499 0.00%
1.0 4.9440 4.9340 0.20%
0.5 8.9200 8.9080 0.13%
0.1 9.3680 9.8650 0.03:
Mean Queue Length at Sibling Queue 1
J.1.o/J-L1 Exact Appro. error
10.0 9.8880 9.888 0.00%
5.0 9.7490 9.748 0.01%
1.0 4.9980 4.999 0.02%
0.5 0.9945 0.9947 0.02:
J.Lo/J.L1 Exact Appro. error
10.0 0.001106 0.00136 22.6%
5.0
0.001311 0.00161 22.4%1.0
0.057850 0.06693 15.7%0.5
0.085330 0.09750 14.3% 0.1 0.021140 0.02399 13.5% Mean Queue Length at Sibling Queue 2JJ-o/
JJ.l Exact Appro. error10.0 0.99880 0.9990 0.22%
5.0
0.99870 0.9989 0.02%1.0 0.81910 0.8176 0.18%
0.5
0.33300.
0.3300 0.90%0.1 0.05263 0.0526 0.00%
Mean Queue Length at Synchronization Queue 2
JJ.o/
J.L1 Exact Appro. error10.0 8.89000 8.8900 0.00%
5.0
8.75100 8.7510 0.00%1.0 4.23700 4.2700 0.78%
0.5 0.74690 0.7700 3.10%
0.1 0.07962 0.0824 3.50%
Mean Queue Length at Sibling Queue 3
'tJ.O/~l Exact Appro. error
10.0 0.49970 0.5000 0.06%
5.0
0.49970 0.5000 0.06% 1.0 0.43180 0.4304 0.32:0.5
0.19980 0.1998 0.00%~o/JJ.l
10.0
5.0
1.00.5
0.1Exact 9.38900 9.25000 4.62400 0.88000 0.09777
Appro.
9.3890 9.2500 4.6830 0.9156 0.1008
error
System Throughput
JJ-o/
JJ.l Exact ..Appro, error10.0 0.8315 0.8122 2.32%
5.0 0.8288 0.8082 2.48%
1.0 0.7244 0.7060 2.54%
0.5 0.4786 0.4741 0.94%
0.1 0.1000 0.1000 0.00%
Mean Response Time of Fork/join Operation
~o/J.L1 Exact Appro. error
10.0 5.9050 6.0490 2.44%
5.0 5.8020 5.9540 2.62%
1.0 4.6400 4.8510 4.55%
0.5 3.4300 3.6820 7.33%
0.1 2.2760 2.4560 7.91%
Mean Queue Length at Primary Node
JJ.o/
JL1 Exact Appro. error10.0 0.08913 0.08735 1.99%
5.0 0.19150 0.18790 1.88%
1.0 1.63900 1.72600 3.90%
0.5 3.35900 3.25500 3.10%
0.1 4.77200 4.75400 0.37%
Mean Queue Length at Sibling Queue 1
JJ.o/
J.L1 Exact Appro. error10.0 2.69100 2.65600 1.30%
S.O
2.63000 2.58800 1.60%1.0 1.79200 1.72600 3.68%
0.5 0.84750 0.83400 1.60%
Exact Appro. error
10.0 5.0 1.0 0.5 0.1
2.21900 2.17900 1.56900 0.79390 0.11660
Syste-m Throughput
~o/JJ.l Exact Appro. error
10.0 0.9997 0.9989 0.08%
5.0
0.9992 0.9984 0.08%1.0 0.8317 0.8310 0.08%
0.5
0.4919 0.4918 0.02%0.1 0.1000 0.1000 0.00%
Mean Response Time of Fork/join Operation
JJ.o/
J.L1 Exact Appro. error10.0 4.8905 4.8945 0.08%
5.0 4.7572 4.7612 0.08%
1.0 3.1121 3.1375 0.82%
0.5 2.0248 2.0683 2.15%
0.1 1.3400 1.3940 4.03%
Mean Queue Length at Primary Node
J.Lo/~l Exact Appro. error
10.0 0.1106 0.1105 0.09%
5.0 0.2470 0.2466 0.16%
1.0 2.4120 2.3930 0.79%
0.5 4.0040 3.9830 0.52%
0.1 4.8660 4.8610 0.10%
Mean Queue Length at Sibling Queue 1
fJ.o/~l Exact Appro. error
10.0 4.8560 4.8470 0.18%
5.0
4.7150 4.7050 0.21%1.0 2.4840 2.4780 0.24%
0.5
0.9037 0.9033 0.04%JJ.o/
~1 Exact Appro. error 10.0 0.0330 0.0421 27.53%5.0
0.0384 0.0486 26.60%1.0 0.1043 0.1293 23.97%
0.5
0.0923 0.1139 23.40%0.1 0.0229 0.0283 23.22%
Mean Queue Length at Sibling Queue 2
JJ.o/
JJ-l Exact Appro. error10.0 0.9620 0.9624 0.04%
5.0 0.9561 0.9560 0.01%
1.0 0.6714 .. 0.6661 0.79%
0.5 0.3229 0.3323 0.19%
0.1 0.0526 0.0526 0.00%
Mean Queue Length at Synchronization Queue 2
J.Lo/
J-L1Exact
Appro. error10.0 3.9270 3.9270 0.00%
5.0 3.7970 3.7970 0.00%
1.0 1.9170 1.9530 1.88%
0.5 0.6731 0.7058 4.86%
0.1 0.0814 0.0866 6.32%
Mean Queue Length at Sibling Queue 3
~O/J..Ll Exact Appro, error
10.0 0.4925 0.4967 0.85%
5.0 0.4913 0.4949 0.73%
1.0 0.3737 0.3701 0.96%
0.5 0.1951 0.1946 0.26%
JJ-o/
JJ.l 10.0 5.0 1.0 0.5 0.1 Exact 4.3970 4.2620 2.2140 0.8009 0.0996 Appro. 4.3920 4.2570 2.2540 0.8404 0.1049 error 0.11% 0.11% 1.80% 4.93% 5.34%Mean Queue Length at Sibling Queue 4
~o/J.Ll 10.0 5.0 1.0 0.5 0.1 Exact 0.3298 0.3294 0.2583 0.1398 0.0256 Appro. 0.3324 • 0.3315 0.2556 0.1394 0.0256 error 0.79% 0.64% 1.04% 0.29% 0.00%
Mean Queue Length at Synchronization Queue 4
'tJ-o/fJ.l Exact Appro, error
10.0 4.5600 4.5570 0.06%
S.O
4.4240 4.4200 0.09%1.0 2.3300 2.3720 1.80%
0.5 0.8563 0.8991 5.00%
System Throughput
JJ.o/
IJ.I simulation Appro. error10.0 0.9187 0.8906 3.06%
-
5.0 0.9132 0.8894 2.61%1.0 0.8659 0.8421 2.75%
0.5 0.4931 0.4998 1.36%
0.1 0.0976 0.1000 2.46%
Mean Response Time of Fork/join Operation
JJ.o/
JoLt simulation • Appro. error10.0 16.3130 16.7400 2.50%
5.0 16.2493 16.6236 2.25%
1.0 12.2200 13.2395 7.70%
0.5 4.8097 5.9049 18.55%
0.1 2.9668 3.6230 18.11%
Mean Queue Length at Primary Node
JJ.o/f.Ll simulation Appro. error
10.0 0.10210 0.09743 4.79%
5.0 0.22056 0.21500 2.58%
1.0 4.40822 3.85100 14.47%
0.5 12.63000 12.05000 4.81%
0.1 14.70000 14.64000 0.52%
Mean Queue Length at Sibling Queue 1
~o/J.Ll simulation Appro. error
10.0 6.8389 6.8150 0.35%
5.0 6.6968 6.7360 0.58%
1.0 4.7367 4.4280 6.97%
0.5 0.9742 0.9983 2.41%
J.10/J..L1
10.0 5.0 1.0 0.5 0.1
simulation
8.0567 8.0825 5.8550 1.3956 0.1875
Appro.
8.0870 8.0490 6.7210 1.9530 0.2512
error
""1
=
f.L~=1,J..L3=f..L4=2,f.Ls=
J.l.s=3
,J.L7=J..L8=4.System Throughput
f.Lo/J.L1 simulation Appro. error
10.0 0.9770 0.9666 1.06%
5.0 0.9668 0.9663 0.05%
1.0 0.9171 0.9126 0.49%
0.5 0.5034 0.4899 2.68%
0.1 0.0986 0.1000 1.40%
Mean Response Time
or
Fork/join OperationJJ.o/
JJ-l simulation.
Appro. error10.0 15.40820 15.4044 0.03%
5.0 15.10850 15.2109 1.06%
1.0 9.95020 9.4570 4.96%
0.5 3.10450 3.3192 6.47%
0.1 1.81640 2.0778 12.58%
Mean Queue Length at Primary Node
Jl.o/JJ.l simulation Appro. error
10.0 0.10544 0.1070 1.46%
5.0 0.24202 0.2393 1.15%
1.0 6.32950 5.9273 6.79%
0.5 13.43600 13.3400 0.72%
0.1 14.82000 14.1900 0.20%
Mean Queue Length at Sibling Queue 1
JLo/~l simulation Appro. error
10.0 11.0072 10.9100 0.89%
5.0 10.9437 10.8200 1.14%
1.0 6.3467 6.4430 1.49%
0.5 1.0543 0.9991 5.46%
JJ.o/
JL1 simulation Appro. error10.0 3.8873 3.98000 2.33%
5.0 3.8142 3.94600 3.34%
1.0 2.3237 2.63800 11.91%
0.5 0.5092 0.62650 18.71%
0.1 0.0708 0.09654 26.68%
Mean Queue Length at Sibling Queue 3
JJ.ol
JLl simulation Appro. error10.0 0.90400 0.93690 3.51%
5.0 0.92257 0.93610 1.45%
1.0 0.85246 0.82390 3.47%
0.5
0.33888 0.33333 1.67%0.1 0.05314 0.05263 0.97%
mean Queue Length at Synchronization Queue 3
~o/JJ-l simulation Appro. error
10.0 13.9905 13.9600 0.22%
5.0 13.8354 13.8200 0.11%
1.0 7.8179 8.2400 5.12%
0.5 1.2245 1.3290 7.86%
0.1 0.1259 0.1549 18.72%
Mean Queue Length at Sibling Queue 5
~O/~l simulation Appro. error
10.0 0.47130 0.47600 0.99%
5.0 0.47450 0.47560 0.23%
1.0 0.43900 0.43240 1.53%
0.5 0.20200 0.20000 1.00%
10.0 5.0 1.0 0.5 0.1 simulation 14.4233 14.2835 8.2314 1.3614 0.1454 Appro .. 14.4200 14.2800 8.6430 1.4730 0.1734 error 0.02% 0.02% 4.88% 7.58% 16.14%
Mean Queue Length at Sibling Queue 7
~o/1J.1 10.0
S.O
1.0 0.5 0.1 simulation 0.319318 0.322000 0.297300· 0.143550 0.025460 Appro. 0.31900 0.31880 0.29300 0.14280 0.02564 error 0.01% 1.00% 1.47% 0.53% 0.70%mean Queue Length at Synchronization Queue 7
~o/J.Ll simulation Appro. error
10.0 14.5752 14.5700 0.04%
5.0 14.4368 14.4409 0.03%
1.0 8.3730 8.7850 4.68%
0.5 1.4199 1.5340 7.44%
model; M =5; J.Ll=I-L~=J.L3=f..L4=1..
System Throughput
JJ.o/
~l Exact Appro. error10.0 0.8315 0.8394 0.95%
5.0 0.8288 0.8358 0.84%
1.0 0.7244 0.7268 0.33%
0.5 0.4786 0.4783 0.06%
0.1 0.1000 0.1000 0.00%
Mean Response Time
or
Fork/join OperationlJ-o/
J.Ll Exact Appro. error10.0 5.9050 5.8490 0.09%
5.0
5.8020 5.7480 0.09%1.0 4.6400 4.5620 1.70%
0.5 3.4300 3.3640 1.90%
0.1 2.2760 2.2180 2.60%
Mean Queue Length at Primary Node
~o/1-1-1 Exact Appro. error
10.0 0.08913 0.09055 1.59% 5.0 0.19150 0.19560 2.14% 1.0 1.63900 1.68500 2.80% 0.5 3.35900 3.39100 0.95% 0.1 4.77200 4.77800 0.13% Mean Queue Length at Sibling Queue 1
'tLo/JJ-l Exact Appro. error 10.0 2.69100 2.88700 7.28%
5.0 2.63000 2.81300 6.96%
1.0 1.79200 1.83500 2.40%
0.5
0.84750 0.84910 O~19%IJ-o/
~l10.0 5.0 1.0 0.5 0.1
Exact 2.21900 2.17900 1.56900 0.79390 0.11660
Appro. 2.02300 1.99100 1.48100 0.76010 0.11030
model; M =15; J.Ll=~2=··.. =J-L8=1.
System Throughput
JJ.o/
1J.1 simulation Appro. error10.0 0.9187 0.9150 0.41%
5.0 0.9132 0.9142 0.11%
1.0 0.8659 0.8643 0.18%
0.5 0.4931 0.4999 1.40%
0.1 0.0976 0.1000 2.46%
Mean Response Time
or
Fork/join OperationJJ.o/
JJ-l simulation.
Appro. error10.0 16.3130 16.2800 0.20%
5.0
16.2493 16.1600 0.55%1.0 12.2200 12.3200 0.85%
0.5
4.8097 4.9610 3.10%0.1 2.9668 2.9790 0.41%
Mean Queue Length at Primary Node
J-Lo/J.L1 simulation Appro. error
10.0 0.10210 0.10040 1.67%
5.0 0.22056 0.22200 0.65%
1.0 4.40822 4.34800 1.37%
0.5 12.&3000 12.52000 0.87%
0.1 14.70000 14.70000 0.00%
Mean Queue Length at Sibling Queue 1
J-Lo/J..L1 simulation Appro. error
10.0 6.8389 7.9180 15.78%
5.0
6.6968 7.8280 16.89%1.0 4.7367 4.9770 5.07%
0.5 0.9742 0.9991 2.56%
JJ-o/J.L1 10.0
5.0 1.0 0.5 0.1
simulation
8.0567 8.0825 5.8550 1.3956 0.1875
Appro.
6.9810 6.9500 5.6740 1.4810 0.1868
error