International Journal
of
Innovative Computing
Journal Homepage: http://se.fsksm.utm.my/ijic/index.php/ijic
34
Integration of PSO and K-Means Clustering
Algorithm for Structural-Based Alert Correlation
Model
Hazelyn Ho Wern Hua, Maheyzah Md Siraj, Mazura Mat Din
Information Assurance and Security Research Group (IASRG), Faculty of Computing,
Universiti Teknologi Malaysia, 81310 Skudai Johor, Malaysia.
[email protected], {maheyzah, mazura}@utm.my
Abstract— Network-based Intrusion Detection Systems (NIDS)
will trigger alerts as notifications of abnormal activities detected in computing and networking resources. As Distributed Denial-of-Service (DDOS) attacks are getting more sophisticated, each attack consists of a series of events which in turn trigger a series of alerts. However, the alerts are produced in a huge amount, of low quality and consist of repeated and false positive alerts. This requires clustering algorithm to effectively correlate the alerts for identifying each unique attack. Soft computing including bio-inspired algorithms are explored to optimally cluster the alerts. Therefore, this study investigates the effects of bio-inspired algorithm in alert correlation (AC) model. Particle Swarming Optimization (PSO) is integrated with K-Means clustering algorithm to conduct structural-based AC. It was tested on the benchmarked DARPA 2000 dataset. The efficiency of the AC model was evaluated using clustering accuracy, error rate and processing time measurements. Surprisingly, the experimental results show that K-Means algorithm works better than the integration of PSO and K-Means. K-Means gives 99.67% clustering accuracy while PSO and K-Means gives 92.71% clustering accuracy. This indicates that a single clustering algorithm is sufficient for optimal structural-based AC instead of integrated PSO and K-Means.
Keywords
—
Structural-based Alert Correlation, DARPA 2000, Particle Swarming Optimization, K-Means, ClusteringI.INTRODUCTION
With the emergence of Internet and the increase in the use of networks in our society, there are new possibilities of attack
strategies that are generated by new technologies or vulnerabilities found in the new technologies. This situation leads to the need for effective network security measures.
One of the measures is the use of NIDS which detect any events that might be intrusion attempts. As an attacker might have orchestrated the attack in stages to ensure a successful attempt, the NIDS are expected to be as accurate and effective in their detections of intrusions. However, there are several challenges poised in the use of NIDS such as a large number of alerts generated, heterogeneous alerts and false positives [15]. Due to these properties, human intervention is needed to manually analyze the alerts. It is labor-intensive, time-consuming and prone to errors to manually analyze the alerts produced by the IDS [3].
It is suggested [12] that the only approach to perform alert analysis to identify a multi-step attack strategy is by using Alert Correlation (AC). Various algorithms have been used to build correlation models for obtaining the best correlation possible. Generally, the AC models can be categorized into structural, causal and statistical based models. There are also attempts to create hybrid models. In this paper, it is an effort to address the structural based AC model.
35 presents the results obtained and discusses the results in quantitative and qualitative aspects. Section 8 suggests further work that can be done to further enhance the work in the field of AC. Section 9 concludes the work.
II.RELATED WORK
AC is a mean to correlate alerts for deriving meaningful relationships, data reduction to a manageable rate and access alerts clustered for malicious activities identification [15]. In [18], AC is defined as post-processing modules to enable analyst to identify important alerts and filter false positives efficiently from the output of NIDS. Authors in [19] found AC to be a process that is concise and presents an overall intrusion occurrence or attempt.
There have been previous efforts to determine the effective methods to correlate the alerts. The work in [16] attempted AC using Self-Organizing Mapping, K-Means, Expectation Maximization and Fuzzy C-Means. In the works of [18], machine learning was used for AC. The use of unsupervised learning was implemented in two stages where Autoassociator algorithm on Feedforward Neural Networks are used for correlating individual steps of attacks, followed by Expectation Maximization algorithm to correlate the entire attack. There are also attempts to perform hybridization on the AC techniques for achieving the best possible AC such as using Neuro-Fuzzy, a combination of Neural Networks and Fuzzy [1].
In this study, it is aimed that the AC be done by using soft computing approach, which is, combining soft computing algorithms sequentially. The first algorithm is for clustering parameters optimization. The second algorithm is for clustering the alerts. So it is also essential to review other works related to the use of PSO and K-Means algorithms.
In a study done by [7] on hybridized approaches on data clustering, a hybridization of K-Means with PSO produces zero error rates which show that this hybridization is able to cluster accurately. Hybridization of K-Means and PSO is done so as to take advantage of their strengths and to overcome their drawbacks.
The works [10] have reviewed the comparison between the two popular bio-inspired algorithms, namely, Genetic Algorithm (GA) and PSO. They noted PSO’s advantages are that the algorithm complexity is low, fast convergence without too many parameters and has good global searching ability.
In [13], it is found that their proposed sequential hybridization of PSO and K-Means is more stable and has capability of obtaining better local optimal solution. In the authors’ work, the approach used has been using PSO to discover vicinity of searching the optimal solution by global search before the result is used as the initial seed in the K-Means algorithm.
It is also found that implementation of PSO in clustering data is effective in obtaining the optimum seeds which then enables the ability to get quality clusters [14].
III.PARTICLE SWARM OPTIMIZATION (PSO)
Particle Swarming Optimization (PSO) is an optimization technique that has been inspired by the social behavior of bird flocking or fish schooling [8]. It has been successfully applied in many study and application areas, especially in optimizing complex problems like non-linear, non-differentiate and multiple peak problems [10]. Examples of such researches are [9] and [14].
PSO starts by initializing a population of random solutions or swarm. It then evaluates each solution (or particle) in the swarm and searches for the optima (or leader) by updating generations where they adaptively cooperate and compete. Each particle has two characteristics that help it to associate with others in the swarm which are current position and velocity. Each particle keeps track of its coordinates in the problem space based on the leader. Once the leader is found, other particles will move closer to it. It is done by associating the particles with the best fitness function. The factors that influenced the position of a particle are best position visited by the particle, pbest and the position of the best particle in its
neighborhood, lbest. The position of the best particle of a
neighborhood in an entire swarm is referred as gbest.
PSO works by changing the velocity of each particle towards its pbest and lbestor gbest. The magnitude and direction
of the velocity is influenced by the velocity of previous iterations. Random numbers are generated to be assigned as weights for acceleration towards pbest and lbest.
v = v + c1 * rand * (pbest - present) + c2 * rand *
(gbest - present) (1)
present = present + v (2) where v is the particle velocity, present is the current particle (solution) position, pbest and gbest are defined as pbest and gbest
respectively, rand is a random number between (0,1), c1 and c2 are learning factors (usually c1 = c2 = 2).
IV. K-MEANS ALGORITHM
K-Means is a simple unsupervised learning algorithm that is commonly used to solve problems with a lot of variables or parameters. These problems usually are time consuming requires fast, heuristic approach.
K-Means algorithm as in Algorithm 1, generates the k cluster centroids randomly and fit the data points in those clusters by associating it the data to the nearest centroid. It is repeated for any random points specified and the best value of points is found when there are no more changes to the position of centroids.
Algorithm 1: K-Means algorithm
1. Parameter Initialization: The parameters needed are
36 2. Initialization:k points are placed randomly into the space
represented by the objects representing initial group centroids. The k points are the instances in the dataset. These points are selected and multiplied with a pseudorandom as the values selected may be the same and prevent accurate clustering.
3. Cluster Assignment: Each object is assigned to the cluster which has the closest centroid based on the sum of squared error (SSE) as in Equation 3.
4. Centroid Update: When all objects have been clustered, the positions of the centroids are recalculated by taking the mean of the objects in the clusters.
5. Iteration: Steps (3) and (4) are repeated until the maximum iteration is achieved.
In this study, the fitness function used is the sum of squared error (SSE). The SSE equation is given as
2 (3)
where ║xi(j) - cj║2 is a chosen distance measure between data
point xi(j) and the cluster center centre cj is an indicator of the
distance of the n data points from their respective cluster centers.
V.INTEGRATED PSOAND K-MEANS ALGORITHMS
The motivation to integrate these algorithms is to take advantage of their strengths and to overcome their drawbacks. The K-Means algorithm has the advantages of being simple and the ability to compute a large number of variables rapidly. However, the final clusters obtained are dependent on its initial partitions.
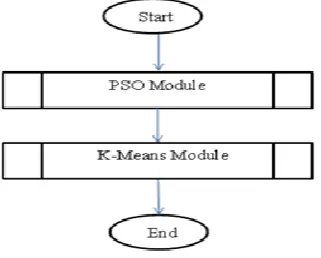
Fig. 1. The integration of PSO and K-Means
Therefore, PSO which has good global searching ability is expected to assist in obtaining the optimal seed in the K-Means initialization. The integrated PSO and K-Means algorithm is done sequentially as shown in Figure 1 and can be represented as in Algorithm 2.
Algorithm 2: Integrated PSO and K-Means (PSO-KM) algorithm
1. Parameter Initialization: The parameters needed are
initialized
2. Random Particles to Cluster Initialization: Each particle represents a possible solution in the search space. The particles are randomly assigned to clusters in the range between 1 to the value of k used.
3. Cluster Assignment: Centroids are calculated based on the mean of the randomly assigned clusters. The Euclidean distances of each particle to the centroids are calculated. Each particle is assigned to the cluster which distance computed is minimum.
4. pbest and gbest Update: The values of pbest and gbest are
updated in which the following conditions are fulfilled: a. Particle’s value is assigned as pbest if it is more than
pbest.
b. Particle’s value is assigned as gbest if it is more than gbest.
5. Position and Velocity Update: The fitness function is calculated. The position and velocity of each particle is also updated using Equations (1) and (2) respectively. If the velocity of the particle is more than the maximum velocity, the velocity of the particle is assigned the maximum velocity.
6. Iteration: Steps (3) to (5) are repeated until the maximum iteration is achieved.
7. Obtain Best Fitness: The mean for best fitness is
obtained to be seeded into the K-Means as initial centroids for clustering. In the standard PSO, gbest is used
as seed. In this study, the mean for best fitness is used because the value is the average of the minimized values of fitness function that will also be used in the K-Means clustering.
8. K-Means Initialization: The mean for best fitness
obtained from the PSO represents the initial group centroids. The centroid values are then multiplied with a pseudorandom number generated as the values selected may be the same and prevent accurate clustering.
9. K-Means Cluster Assignment: Each object is assigned to
the cluster which has the closest centroid based on the sum of squared error (SSE) as in Equation 3.
10. K-Means Centroid Update: When all objects have been
clustered, the positions of the centroids are recalculated by taking the mean of the objects in the clusters.
11. Steps (9) and (10) are repeated until the maximum iteration is achieved.
VI.THE PROPOSED ALERT CORRELATION MODEL
A. Alert Pre-Processing
37 Lincoln Lab, Massachusetts Institute of Technology (MIT) [4]. A semi-preprocessed dataset to the extent of alert formatting is obtained from [17].
Alert Pre-processing is an important stage as it will remove the noise to be more meaningful data before the clustering is done [11]. Important aspects that need attention during this stage include
Alert Formatting: The alerts have nine attributes after Intrusion Detection Message Exchange Format (IDMEF) is used to define the common data formats, namely, AlertID, SensorID, DetectTime, SourceIPAddress, SourcePort, DestinationIPAddress, DestinationPort, ServiceProtocol and AlertType [16]. The data format consists of numerical and non-numerical attributes. The non-numerical attributes are AlertID, SourcePort and DestinationPort. The non-numerical attributes are AlertType, ServiceProtocol, DetectTime, SourceIPAddress and DestinationIPAddress)
Alert Representation. There is a need for
non-numerical attributes conversion and scaling to produce a balanced dataset. For the purpose of automation for correlation, numerical values are also scaled to be within the range [-1, 1] because the range is too big and unsuitable for automated data mining [17]. It is done by i) Data Conversion and ii) Data Scaling. Data Conversion consists of converting Internet Protocol (IP) dotted decimal values into long decimal values. Time format which is represented in the ISO 8601 extended format (hh:mm:ss) is converted into its basic format (hhmmss). Other non-numerical attributes are converted into numerical representations.
Data Scaling is done using decimal scaling which is performed for conversion of all numerical attributes between interval [min, max] into the ranges of [-1, 1]. In the research done by [18], Improved Unit Range (IUR) is used with the intent to remove zero values which is invalid and do not have meaningful representation. This study attempts to use decimal scaling for the same intent. However, invalid data are removed manually. Decimal scaling is similar to the IUR in mapping the raw data into the range of interval [-1, 1] as given in Equation 4 [6].
x’ = x / 10 c (4)
where:
x’ = new scaled value, x = raw value,
c = smallest integer such that max (| x’|) < 1.
B. Feature Selection
Based on [17], the trials done based on Principal Component Analysis result best with attributes, namely,
SourcePort, DestinationPort and AlertType. The alert vector
that will be clustered, A = {SourcePort, DestinationPort, AlertType}.
C. Parameter Settings
K-Means:
Based on preliminary trials, the optimal k value found is 16. This matched the performance obtained by [16] where the number of clusters expected is 16. However, the results done by the author was for raw alerts. The optimal iteration is 5.
Particle Swarming Optimization:
In [13], the authors suggested the algorithm to be run for 10 iterations before using its centroid for further processing. In [2], it is found that Random Inertia Weight produced the best efficiency. The formula of Random Inertia Weight is given by:
w = 0.5 + rand()/2 (5)
The works of [7] noted from other researches that suggested the use of acceleration factors = 2 and inertia weight as in Equation 5. Initial velocity is set to 0 and maximum velocity which is the maximum change a particle can make in an iteration, is set at 2.
D. Clustering
The experiment has been carried out in two parts. The first part is clustering using K-Means algorithm and the other is clustering using the integration of PSO and K-Means algorithms. The first part serves as a control so that a comparison can be done.
E. Benchmarked Performance Measurements
The selected measurements used for performance validation and benchmarks are clustering accuracy, error rate and processing time. Clustering accuracy (CA) is defined as the percentage of correctly clustered alerts. Error rate (ER) is the percentage of wrongly clustered alerts. Processing time is the time taken to complete the algorithm.
In [5], it is noted that there are two extremes in clustering which are: no clustering and maximum clustering. No clustering occurs when all instances for a cluster each. Maximum clustering occurs when all instances are clustered as a single cluster. So, these extremes are not considered as errors in this work. The criteria where the data instance is identified as error are: wrong data clustered and data clustered in more than one cluster
VII.EXPERIMENTAL RESULTS AND DISCUSSIONS
38 (e.g., DMZ1). After pre-processing, the number of alerts is 886, 425, 875 and 482 alerts for DMZ1, DMZ2, Inside1 and Inside2 respectively.
The program is done in MATLAB R2012b and is run on a laptop with the Intel Core i5-2410M 2.30 GHz processor, Windows 7 Home Premium Edition 64-bit operating system and installed RAM of 4.0 GB. Higher specifications provide a better experience in terms of speed and smooth experimentation executions.
The performance measurements are tabulated in Table 1 and Table 2. It can be seen that K-Means clustering algorithm performs better in terms of clustering accuracy, error rate and processing time compared to PSO-KM algorithm.
TABLE I. PERFORMANCE IN TERMS OF CLUSTERING ACCURACY (CA), ERROR RATE (ER) AND PROCESSING TIME (PT) MEASUREMENTS FOR K-MEANS ALGORITHM
CA (%) ER (%) PT (sec)
DMZ1 99.77 0.23 1.41
DMZ2 99.77 0.23 0.81
Inside1 99.76 0.24 1.41
Inside2 99.38 0.62 1.28
Average 99.67 0.33 1.23
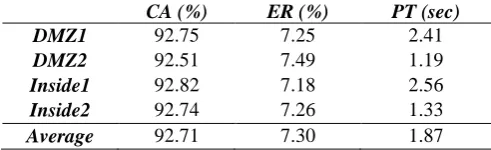
TABLE II. PERFORMANCE IN TERMS OF CLUSTERING ACCURACY (CA), ERROR RATE (ER) AND PROCESSING TIME (PT) MEASUREMENTS FOR PSO-KM ALGORITHM
CA (%) ER (%) PT (sec)
DMZ1 92.75 7.25 2.41
DMZ2 92.51 7.49 1.19
Inside1 92.82 7.18 2.56
Inside2 92.74 7.26 1.33
Average 92.71 7.30 1.87
Overall, there is an average reduction of 6.96% in terms of clustering accuracy for PSO-KM as compared to K-Means. The average PSO-KM error rate is higher by 6.97% compared to the average K-Means error rate. On average, it takes an extra 0.64 seconds. Due to a larger dataset size and a more complex algorithm, the PSO-KM takes a longer processing time compared to the K-Means algorithm.
Based on the benchmarked performance measurements, the efficiency of K-Means algorithm is better than integrated PSO and K-Means. In [17], it is noted from the comparison of similar researches where the clustering accuracy achieved by the author’s experimented using unsupervised Expectation Maximization learning algorithm outperforms other researches which hybridized two algorithms. This indicates that a single clustering algorithm is sufficient to achieve optimal clustering. Apart from the quantitative aspects, there are qualitative aspects that are factors for an effective AC model. It is important to keep in mind that the proposed clustering model aims to investigate the effects of bio-inspired algorithm in clustering similar structural features. Thus, the factors
contributing to such empirical differences in the results are discussed in the following sub-sections.
There are various factors which can affect the results of the clustering algorithm
Centroid value: The centroid values are randomly
selected from the dataset instances which make it possible to select different points with the same values. Pseudorandom generated values lies between [0, 1] are then multiplied to vary the centroid values. Depending on the generated values which are usually less than 1, it has a minimizing effect on the centroid values.
Fitness Function: As the centroid values can vary in a very small magnitude, the differences obtained between each cluster may be negligible. Thus, the data tend to be clustered in a single cluster.
Size of dataset: The size of the dataset affects the processing time. The processing time increases as the size of dataset increases.
VIII.FUTURE WORK
There are areas in this study which can be extended to for further investigations. The PSO module can be improved by using time-varying inertia weights, different fitness functions, acceleration factors, sub-swarms, constriction factor or other PSO variants. A more advanced algorithm can be developed in order to cluster and classify the alerts.
IX.CONCLUSION
In a nutshell, this paper has presented the results from investigating the integration of PSO and K-Means algorithm for structural-based AC. Empirical results from the study show that K-Means algorithm is sufficient for optimal structural-based AC instead of integrated PSO and K-Means. This proved the no free-lunch theory where there is no one solution that can solve all problems and dataset.
REFERENCES
[1] Alshammari, R., Sonamthiang, S., Teimouri, M. and Riordan, D. (2007). Using Neuro-Fuzzy Approach to Reduce False Positives Alerts. IEEE 5th Annual Conf. on Comm. Networks and Services Research (CNSR07):345-349.
[2] Bansal, J. C., Singh, P. K., Saraswat, M., Verma, A., Jadon, S. S., Abraham, A. (2011). Inertia Weight Strategies in Particle SwarmOptimization. 2011 Third World Congress on Nature and Biologically Inspired Computing. IEEE:640-647.
[3] Debar, H. and Wespi, A. (2001). Aggregation and correlation of intrusion detection alerts. Proc. of the 4th Int. Symp. On Recent Advances in Intrusion Detection: 87-105.
39
[5] Julisch, K. (2003). Clustering Intrusion Detection Alarms to Support Root Cause Analysis. ACM Transactions on Information and System Security (TISSEC) 6(4):443-471. [6] Kantardzic, M. (2011). Data Mining: Concepts, Models,
Methods, and Algorithms. John Wiley & Sons, Inc., Hoboken, New Jersey.
[7] Kao, Y.T., Zahara, E., Kao, I. W. (2008). A Hybridized Approach to Data Clustering. Elsevier, Expert Systems with Applications.
[8] Kennedy, J. and Eberhart, R. (1995). Particle Swarming
Optimization. IEEE: 1942-1948.
http://www.cs.tufts.edu/comp/150GA/homeworks/hw3/_reading 6%201995%20particle%20swarming.pdf
[9] Li, L.F. and Zhang, C.M. (2010). Alert Clustering Using Integrated SOM/PSO. 201O International Conference On Computer Design And Applications (ICCDA 2010) (2):571-574. [10]Li, Z. J., Liu, X. D. and Duan, X. D. (2010). Comparative Research on Particle Swarming Optimization and Genetic Algorithm. CCSE 3(1): 120-127.
[11]Mohamed, A.B., Idris, N. B., Shanmugum, B. (2012). Alert Correlation Framework Using a Novel Clustering Approach. Int. Conf. on Comp. & Info. Sc. (ICCIS): Conference Paper. [12]Pouget, F. and Dacier, M. (2003). Alert Correlation: Review of
the State of the Art. Institut Eurecom Sophia Antipolis, France: Research Report RR-03-093.
[13]Rana, S., Jasola, S. and Kumar, R. (2010). A hybrid sequential approach for data clustering using K-Means and particle swarm optimization algorithm. International Journal of Engineering, Science and Technology 2(6): 167-176.
[14]Razak, N. A. (2010). Intrusion Detection System PSO Seeded K-Means Approach. Project Paper (Bachelor Degree of Science (Computer Science)) - Universiti Teknologi Malaysia, 2010. [15]Seyed, A. M., Sajjad, A. and Rasool, J. (2012). Alert Correlation
Algorithms: A Survey and Taxonomy. Cyberspace Safety and Security Lecture Notes in Computer Science Volume 8300, 2013: 183-197.
[16]Siraj, M. M., Maarof, M. A. and Hashim, M. S. Z. (2009). Intelligent Alert Clustering Model for Network Intrusion Analysis. Int. J. of Advances Soft Computing and Its Applications (IJASCA), 1(1):33-48.
[17]Siraj, M. M. (2013). Hybrid of structural-causal and statistical model for intrusion alert correlation. Thesis (Ph.D (Sains Komputer)) - Universiti Teknologi Malaysia, 2013.
[18]Smith, R., Japkowicz, N., Dondo, M. and Mason, P. (2008). Using unsupervised learning for network alert correlation,
Springer-Verlag LNAI 5032, (2008):308-319.