Application of various 'response surface' - based algorithms in
optimization of air manifolds for batch boilers
Mateusz Szubel1,*, Mariusz Filipowicz1, and Anna Mikrut1
1AGH University of Science and Technology, Faculty of Energy and Fuels, al. Mickiewicza 30, 30-059 Krakow, Poland
Abstract. Correct design of air manifolds applied in biomass-fired batch boilers allows to avoid excessive emissions and high flow resistance, as well as helps achieving the required parameters of the fan supplying air to the boiler. The paper describes the process and the results of the optimization performed using selected methods based on the response surface analysis. An experimentally validated CFD model of the state of the art air manifold has been geometrically parametrized, in order to find the shape that is optimal from the point of view of the objective function. In each analysis, the objective function was linked to air flow characteristics. Selected algorithms of the interpolation of design points that were obtained as the result of the numerical experiment have been compared and evaluated. Optimization using the response surface generated using various algorithms has been performed and verified by further direct CFD computations. The obtained optimal values of the input parameters were applied in the final model of the prototype. The flow characteristics of the prototype and the reference state have been compared and discussed. Significant improvement of the operation conditions has been achieved.
1 Introduction
Biomass as a fuel alternative to fossil fuels is again the subject of studies in many research institutes. After the time of dynamic development of large scale power generation systems based on combustion as well as co-combustion of various types of the biomass [1, 2], the centre of gravity of research has moved to smaller installations.
The biggest advantage of the units referred to above, is that they can operate in a cost - efficient way, using fuel near its production site. Moreover, thanks to this approach it is possible to provide heat or/and electricity where its transmission is difficult due to technical issues. Taking these facts into account it is well substantiated to develop installations based on devices equipped with batch combustion chambers or automated fuel supply systems [3 - 5].
In countries with a significant share of agriculture in the economy (such as Eastern Europe and Asia), the energy potential of agricultural wastes, such as straw, is significant. In such countries, straw - fired batch boilers become increasingly popular, due to structural simplicity and the technical robustness. However, to avoid some problems environment-related issues (i.e. emission of pollutants), the process of combustion in this type of boilers has to be performed in a specific manner that requires advanced air distribution systems [6-8]. The key part of this system is the external air manifold dividing and transporting air to appropriate sections of the boiler.
2 Impact of the air supplying techniques
on the biomass combustion
2.1 Experimental and numerical research regarding the air supply systems for the biomass combustion
Increasingly restrictive emission limits of pollutants to the atmosphere drive the need to research new possibilities of improvement in straw combustion quality. In case of reduction of the NOx emission, it is possible to apply primary as well as secondary methods. The first group includes, among other things, fuel and air staging [9], exhaust gas recirculation and optimization of the combustion process. At the industrial scale the most popular secondary methods are the selective catalytic reduction (SCR) and the selective non-catalytic reduction (SNCR) [10], but due to the technical and financial issues these methods are however impractical.
precise than in the case of the reduced-scale physical models. This results in reduced costs of the analysis and shorter prototyping time.
Paper [12] describes the bases for development of the CFD model of the domestic biomass-based heating system, including CO and CO2 emissions. The simulation assumed modelling of the combustion in the fuel bed consisting of layers representing three groups of phenomena: drying, pyrolysis and coke formation. The approach allowed to observe the impact of the air feeding method on the device efficiency and key-emissions levels. The paper confirms that the locations of the air inlet as well as the direction of the air stream inside the combustion chamber are the crucial factors determining the composition of the exhaust gas. Moreover, the results presented in the paper point out the role of the fuel bed geometry in the efficient air distribution. This factor determines the share of incomplete combustion in the entire chemistry of the combustion and determines the presence of combustible particulate matter in the exhaust gas. Consequently, to guarantee clean combustion of biomass, it is necessary to provide the number and the locations of the air inlets designed for a specific type of biomass and geometry of the combustion chamber [7].
Similar conclusions were reached as the result of experimental studies described in [13]. The authors have evaluated the impact of the secondary air staging on the emissions of selected gases and particulate matter. A laboratory-scale wood-fired combustion chamber was considered in the study. Except for the mentioned emission levels, the output parameters included series of process parameters, such as the combustion rate and the temperature in selected points of the chamber. Two considered variants of the experiment assumed different distances between the air inlets and the fuel bed. Moreover, four different air mass flow rates (constant during the measurement) have been applied and compared. It has been observed that the distance between the air inlets and the fuel bed as well as the homogeneity of the air feed determines the intensity of the particulate matter emission. The latter is directly related to the external air distribution system design. However, this issue has not been discussed in the paper.
In addition to the distance of the fuel bed from the secondary air inlets, the axial position of the inlets in the combustion chamber is yet another significant geometrical parameter of the air feeding system in reactors for biomass combustion [14]. In case of biomass stoves and boilers, paths of the solid particles in the chamber depend on parameters of the primary air inlet, geometry of the fuel bed as well as the chimney draft. Appropriate direction and intensity of the secondary air flux can result in intensified turbulences in the burnout area, which significantly reduces PM emissions. Without a well thought design of the external elements of the air distributor it may however be problematic to achieve homogenous or, in other words, symmetrical conditions in the reactions area.
Deeper analysis of the PM thermal decomposition referred to above, allows to note that this process can lead to increased concentration of carbon monoxide in
the exhaust gas. This stems from the nature of the biomass pyrolysis and the conditions required for the gasification of its products [15 - 17]. The issue is especially important in case of the combustion process in straw - fired batch boilers, where relatively large amounts of big solid particles are lifted by the gas flux from the fuel bed [8]. However, some studies have proven that the phenomena occur also in simpler units such as stoves or fireplaces, where advanced air distribution systems aren’t usually applied. The authors of [18] have presented results of research carried out for two different variants of combustion process in fireplaces. A standard device has been compared with modern solution equipped with a system dividing air into the primary and the secondary streams. The second air stream inlet was fed close to the deflector (vault) of the combustion chamber. The study was performed mainly in order to evaluate the impact of this technical solution on the share of OGC (organic gaseous carbon) in products of combustion as well as the content of the organic fraction of the particles flowing to the chimney with the exhaust gas. It has been observed that the implementation of the air division leads to significant reduction both of OGC and harmful components of PM. Furthermore, this air-feeding method allowed to reduce the CO emissions, only, however, at the stage of ignition. It may be expected that the effect of the reduced emissions during the nominal combustion stage as well as during char burnout could be achieved through application of additional secondary air inlet or inlets. However, again this requires a new design of the external air distribution system, which was not the subject of the paper in consideration.
2.2 Previous research conducted by the authors
Despite the availability of a number of scientific works devoted to the study of air feeding systems for biomass-based small scale energy units, just a minor part of these works take into account the issue of the design of external air distribution systems and its impact on the combustion and the overall efficiency of the device.
Moreover, no data concerning the operation of these systems in installations with straw-fired batch boilers has been presented. Due to the above, the authors of this paper performed some preliminary studies devoted to the flow characteristics in air manifolds dedicated for the heating units in concern.
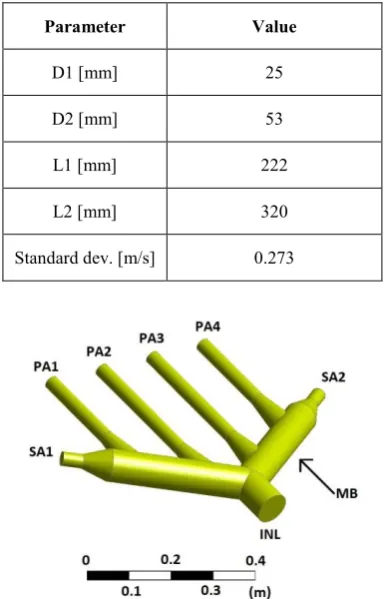
During the attempts to improve the shape of the air distribution system, numerous prototypes have been developed. Three main structures representing stages of development of the technology have been presented in Figure 1. The main design assumptions were the same in case of each of the devices. A series of the primary air ducts (PA1 - PA4) provides air to the primary combustion area in the boiler. Two secondary air ducts (SA1, SA2) are responsible for providing air into the secondary combustion area. Main body (MB) of the air manifold connects each of the ducts with the air inlet (INL) attached to the fan.
Fig. 1. Successive designs of air manifolds developed by the manufacturer and the authors of this paper
The first design (a) is a classic structure of the manifold that has been used in the first generations of the straw-fired batch boilers [21]. Number of the primary air ducts depends on the nominal power of the boiler (180 kW in this case) and, consequently, on the size of the combustion chamber. The location of the secondary air outlets and the air inlet at the bottom of the main duct constitute a major drawback of the design. The geometrical configuration of the mentioned elements of the structure influences the flow characteristics and causes turbulences inside the main body.
This problem was partially solved in case of the second design (b) where each duct was located at the same level, thus reducing the vertical distribution of the stream inside the system. An advanced shape of the main body has been applied in order to simplify the
manufacturing process (welding of ducts). However, this approach causes a higher pressure drop [20] between the inlet and the outlets, especially in case of larger units.
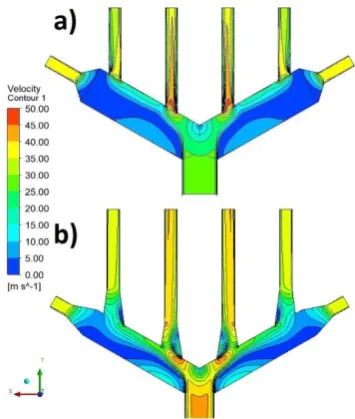
The third, Y-shaped example (c) exhibits the air manifold designed as a result of parametric analysis. The objective of the study was to define the relation between the angle of bending of the main body and the selected output flow parameters, such as air velocity and pressure. The total length of the manifold (between the air inlet and the output terminations) was limited to avoid increasing dimensions of the entire system including the boiler. Due to compromise between the flow characteristics and the manufacturing issues, the angle of 120° between the arms of the main body has been defined as the recommended value of the considered parameter [20]. It has been found that the bent shape reduces pressure drops and results in an increase of air velocities along the manifold and thus the combustion chamber of the boiler (Figure 2). However, a considerable variation of output air velocities has been observed.
Fig. 2. Example of comparison of air flow characteristics (subsequent air outlets) obtained in case of the reference air manifold and the prototype with the bent main body: a) velocity, b) total pressure drop relative to inlet.
2.3 Characteristics of the research problem
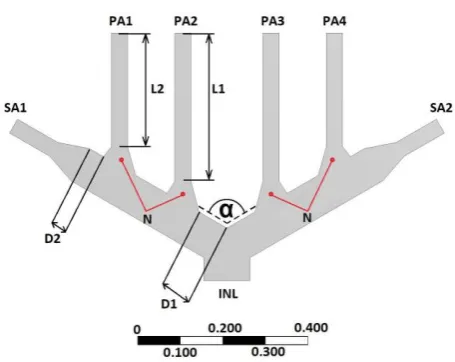
Fig. 3. The proposed shape (cross section of the symmetry plane) of the newly designed air manifold with specified input parameters
Figure 4 presents the symmetry plane of the proposed fourth generation air manifold. Nozzles allowing smooth transition of the air streams are marked with "N" symbols. The angle "α" between the arms of the main body was assumed as in the case of the state-of-the-art solution (Fig. 1.c), that is 120°. Based on previous experience, two groups of input parameters were selected as influencing the air velocity homogeneity at the primary air outlets:
- L1 and L2 - lengths of the primary air ducts, excluding the "N" nozzles,
- D1 and D2 - distances indirectly determining the width of the "N" nozzles.
Furthermore, smaller diameters of the main body and inlet duct were applied (0.1 m in the previous design and 0.08 m in proposed one).
At this level of geometry changes it was expected that the possible improvement of the design is relatively small, which excludes the possibility of efficient application of the classic parametric "what if" analysis. Hence, it was necessary to support the research by advanced optimization techniques.
Due to the multitude of available variants and the efficiency of the method, the "response surface"-based optimization has been selected for the study. The case of the air manifold presented in this chapter has been used to evaluate different approaches to this method of optimization process.
3
“Response
surface”
–
based
optimization of the air manifold
3.1 General scheme of the optimization
As the first stage of the optimization, input and output parameters have to be determined. As mentioned in section 2.3, selected dimensions of the manifold geometry have been defined as the input parameters, while the averaged velocities (mass-weighted average) on the outlets were set as the output parameters. The standard deviation from the primary air velocities (PA1 –
PA4) was defined as an additional output parameter that was used at the stage of optimization to determine the objective function.
A CFD model of the air manifold was developed using ANSYS Workbench 18 software. After the computation performed in order to test the convergence conditions, it was possible to perform the stage of the design of experiment (DOE). DOE allows to set design points that represent samples located in a specific manner in the area of the numerical experiment. These samples are set based on selected values of input parameters. The number and the method of generating the design points depend on the selected algorithm [22, 23]. Within the numerical experiment, the model is solved directly in the design points. From the point of view of the case in consideration, it means that the flow characteristics of the air manifold were simulated for all sets of the input parameters determined in the DOE.
Based on results of the previous stage, the response surface is generated for each of the selected output parameters. This may be understood as a result of the interpolation of the output parameter value between the samples that were obtained during the numerical experiment. Response surface provides the approximated values of the output parameters, everywhere in the analysed design space, without the requirement to carry out a complete computation. Characteristics and complexity level of the response surface depends on the applied generation algorithm [24].
The quality of the response surface can be evaluated using appropriate indicators. Subsequently, based on the limitations of the input parameters and the defined objective function, it is possible to perform the optimization of the considered case. The optimization proceeds using the response surface to avoid direct computations for a number of the input parameters combinations. At the last stage of the procedure the optimal candidate (set of values of the input parameters) is verified by the next direct computation.
3.2 Characteristics of the CFD model
To reduce the time of the successive stages of the optimization, a 2D model of the air manifold has been developed. After the final selection of the optimal set of input parameters, full 3D simulation has been performed for the optimal prototype.
indicators mentioned above, it was decided that the mesh fulfils the requirements of the simulation.
ANSYS Fluent was applied to solve the defined isothermal, turbulent numerical problem. Due to the estimated distribution of the y+ parameter that determines near wall treatment of the flow simulation as well as based on [20], where different turbulences models were tested and experimentally validated, it has been decided to implement k-ε realizable turbulence model. Furthermore, scalable wall functions were activated.
A homogeneous profile of the velocity equal to 12.5 m/s was set as the inlet boundary condition, while a constant relative pressure of 0 Pa was applied for each of the outlets. Due to the simplicity of the 2D model and the high mesh quality, it was possible to run the first calculation already with second order upwind advection scheme in case of the momentum equation as well as both turbulence equations. The residual target was set to 10-5.
The expression describing the standard deviation from the PA1-PA4 output velocities has been developed in a post-processing module. The input and output parameters were integrated using the ANSYS Parameter Set module to allow the numerical experiment and subsequently the optimization.
3.3 The numerical experiment
ANSYS DesignXplorer has been used to design the numerical experiment. The response surface accuracy greatly depends on the DOE scheme as well as the number of design points that were defined and calculated. Three different DOE schemes were applied and compared:
- Central Composite Design (CCD), - Optimal Space Filling Design (OSFD), - Sparse Grid Initialization (SGI).
CCD is a five-level fractional factorial design. It generates one centre point as well as a set of axis points and factorial points located respectively on the axes of the selected input parameter and along the diagonals of the input parameter space. The advantage of the rotatable variant of the CCD selected for the experiment consists in the fact that in such case, the variance prediction is the same for any two locations that are at the same distance from the design center. However, this algorithm does not consider sampling points at all extremes of the numerical experiment space.
OSFD is based on Latin hypercube sampling method optimized in order to achieve better filling of the parameter space. Although the randomness depends on the selected starting point, the method ensures good space filling capabilities. However, it requires the selection of sufficient number of design points to avoid poor quality of the response prediction.
SGI generates one centre point as well as several axis points. Usually it is used in case of creating response surface using certain specific methods (i.e. sparse grid response surfaces), it was selected as the third method,
however, due to the certain similarity to the CCD in terms of generating the design point.
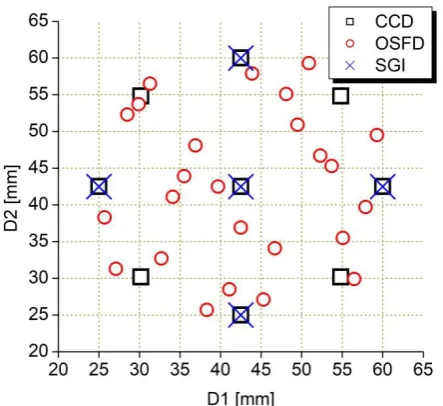
Fig. 4. Comparison of design points created in cases of different schemes of the DOE – D1/D2 pair of the input parameters
The design results in the numerical experiment using the schemes mentioned above, have been presented in Figure 4. This example shows the structure of the experimental space for the D1/D2 parameters. The characteristics of the space for the L1/L2 couple are analogous. At a comparable level of complexity of the numerical experiment, OSFD seems to give the best response prediction, although the SGI is able to automatically refine the matrix of the design points where the gradient of the output parameter is higher (in order to improve the quality of the response surface). In this case, the result obtained for the CCD is a compromise between the number of the design points and the optimal filling of the experimental space.
3.4 Creating response surfaces and the quality analysis
ANSYS Response Surface Optimization module has been used to generate the response surface as well as to optimize the case and to verify the result. The output parameter analyzed on the response surfaces was the previously mentioned standard deviation from the primary air velocities.
Based on the design points matrix generated through each of the considered DOE schemes (CCD, OSFD, SGI), three different types of response surfaces were created (a total of nine combinations). The algorithms used at this stage were as follows:
- genetic aggregation, - Kriging,
- neural network.
creation of the response, the best surfaces are selected and combined. Then, the so-called "aggregation" is build for several response surfaces. This results in high quality of the final response surface [25].
The Kriging method is based on a multidimensional interpolation combining polynomial modelling and the determination of local deviations. The polynomial model function is to describe the general shape of the design space.
Kriging is recommended in cases of non-linear or generally strong variations of the considered output parameter. Moreover, this algorithm automatically runs additional design points based on its internal error prediction in order to reach the required accuracy [25].
The neural network technique uses an analogy to the natural neural network in the brain. Literature [25] provides a list of this method’s capabilities:
it is successful with highly nonlinear responses,
70% of design points are used as the so-called "learning points",
30% of design points are used as the so-called "checking points",
control over the algorithm is relatively limited,
response is noisy in case of a high number of input parameters (and consequently the design points). To evaluate quality of the response surface created using the described methods, values of standard deviation predicted from the responses have been compared with the ones calculated in the designed points. Charts in Figure 5 present the goodness of fit of these values.
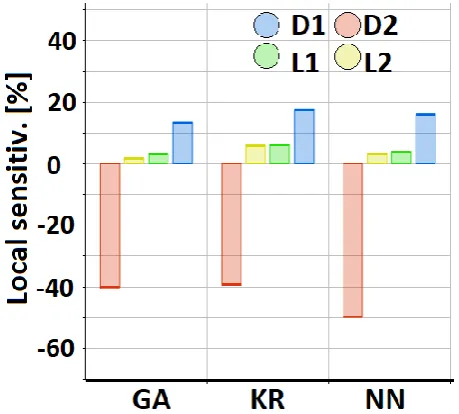
Fig. 6. Local sensitivity of the output parameter (standard deviation) for different response surface designs: GA – genetic aggregation, KR – Kriging, NN – neural network.
For each case of the DOE, both the genetic aggregation and Kriging give satisfying fitting results. However, due to the reduced number of design points in SGI, significant part of the experimental space is not covered, which would worsen the quality of the optimization. Furthermore it would cause a significant difference between the value of the output parameter for the optimal candidate point and the final point verified by computation.
Due to the previously mentioned limited control over the neural network algorithm, the verification using the goodness of fit method was unsuccessful. For each DOE there was no clear correlation between the observed and the calculated values. The worst results, however, were observed for the OSFD method. Based on this analysis it was concluded that further studies shall be carried out based on the CCD schemes.
Local sensitivity analysis (Fig. 6) for three algorithms of the response surface creation has been applied to compare the relative impact of each input parameter on the output parameters. This tool provides information about the relative significance of the parameter as well as whether it causes an increase or decrease of the related output parameter.
Unequivocal convergence of the general trends has been observed. Independently from the response generation method, modifications of D1 and D2 values were causing the largest changes in the flow characteristics. The results obtained for genetic aggregation and Kriging were similar, while for neural network the biggest impact of D1 has been noted. However, this algorithm resulted in the weakest correlation in the analysis of the goodness of fit.
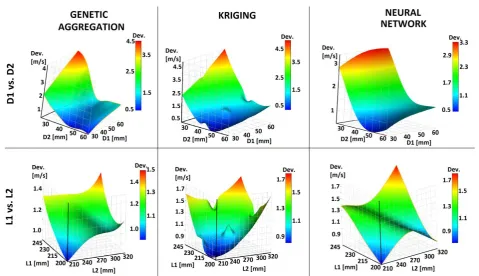
Response surfaces generated using the considered algorithms have been shown in Figure 7. Individual 3D charts present the relation between the output parameter (standard deviation) and the pairs of the input parameters -D1/D2 and L1/L2, respectively. Again, the generic aggregation and Kriging provided similar results while only a general analogy may have been observed in case of the neural network. Furthermore, it has to be noted that the local extremes of the output parameter have been included in the Kriging response.
It may be concluded, that Kriging can be recommended for non-linear responses, such as the one obtained for the air manifold analysis. This constitutes an advantage over the genetic aggregation.
To select the final algorithm that should be used in the optimization process, analysis of selected quality indicators for the response surfaces has been compared and presented in Table 1.
Table 1. Selected parameters of the response surface generated for the central composite design of experiment.
Parameter aggregation Genetic Kriging network Neural
Coefficient of
determination 0.90 0.98 0.75
Root mean
square error 0.34 0.129 0.404
Relative maximum absolute error
[%]
0.74 0.11 0.36
Relative average absolute error
[%]
0.20 0.12 0.37
The coefficient of determination is the part of the variation of the output parameter that occurs due to the nature of the response surface regression equation. The best value for this indicator is 1.
The root mean square error is the square root of the average square of the residuals at the DOE points for the selected regression methods. In case of this indicator the best value is 0.
The relative maximum absolute error is the ratio of the absolute maximum residual value to the standard deviation of the actual output data, modified by the number of samples. The best value is 0%.
Analogously, the relative average absolute error is the average of the residuals relative to the standard deviation of the actual outputs. Again, the best value is 0 [25].
Based on this study, it has been finally decided to select the Kriging response surface built using the CCD schema of the numerical experiment.
3.5 Characteristics of the optimization and the prototype air manifold
The objective function in the optimization process was to minimize the standard deviation from the velocity at the primary air outlets, in order to improve the homogeneity of the air conditions in the primary combustion chamber of the batch boiler. Due to the manufacturing constrains, distances D1 and D2 have been limited to the range of 25-60 mm. Permissible L1 length ranged from 200 to 245 mm, while in case of L2 it ranged from 200 to 320 mm.
Table 2. The values of input parameters for candidate point and the verified values of the output parameter
Parameter Value
D1 [mm] 25
D2 [mm] 53
L1 [mm] 222
L2 [mm] 320
Standard dev. [m/s] 0.273
Fig. 8. Spatial geometry of the designed prototype of the air manifold with conical connectors on the primary air ducts.
As the result of the optimization, three candidate points have been selected by the optimizing module. Each set of the candidate input parameters has been verified by re-simulation conducted in ANSYS Fluent
solver. The best set of data obtained through verification has been shown in Table 2.
New design assumptions have been implemented to develop a fully three dimensional model of the prototype air manifold. The result of the designing process that was carried out in ANSYS DesignModeler module has been presented in Figure 8.
Mesh parameters, boundary conditions and computation schemes developed previously for the optimization of the simplified 2D geometry were implemented at currently described stage of the study - for 3D models of the reference (Fig 1.c) and prototype structures (Fig. 8), in order to compare the selected air flow parameters. The results of the comparison were discussed in the following chapter of the paper.
4 Results and discussion
The distribution of air velocity at the outlets may be considered in two ways: by comparing the air streams in subsequent ducts as well as by analysing the velocity profile at each of the terminations of the ducts.
First, a comparison of the averaged values pertaining to subsequent ducts has been carried out. It was found that the application of optimized values of defined input parameters allowed to move some part of the stream from the secondary air ducts to the external pair of the primary air ducts - PA1 and PA4, which has been exhibited in Figure 9. The chart shows that this modification of the previously partially improved structure of the air manifold - based on the changed assumed input parameters - allows to achieve a slight positive effect in view of the objective function. It has to be noted that the flow characteristics at the external primary air ducts are the key factor for the improvement of the combustion conditions, due to the usually worse conditions at the sides of the primary combustion chamber of batch boilers [6, 8].
Due to the small distance between the ducts PA2 and PA3 and the air inlet it was difficult to influence the flow characteristics in this area significantly. Thus, no clear change of the air velocity occurred in that case.
Fig. 9. Comparison of the outlet velocities for the reference design and the prototype
smooth the velocity gradients in regions of the primary air ducts close to connection of the manifold main body provides a positive change in the studied flow feature. Figure 10 presents the contour of the velocity distribution on the symmetry section plane, where a significant change of the streams structure in each duct is clearly visible. Homogenization of the velocity profiles has been achieved for the external as well as internal air ducts. Furthermore, no change of the profiles has been noted in case of the secondary air ducts (SA1, SA2), where flow reducers were installed both in the reference and the prototype manifolds. The streams in this area were comparably homogenous in studied models.
Due to the higher proximity of the initial sections of the PA2 and PA3 ducts and the air inlet, resulting from the extension of the inlets to these ducts, two symmetrical spots of relatively high velocity were observed. This resulted from the sudden change of flow direction and a similar phenomenon was noted in case of the reference case, although it was observed slightly deeper inside the ducts. In the prototype, however the effect was gradually suppressed, hence the flow characteristic were stabilized in the main part of ducts - closer to the outlets.
Fig. 10. Contour of the velocity distribution for the reference design (a) and the prototype (b) - the symmetry plane
As shown in Figure 11, changes of the total pressure at subsequent outlets were directly related to the previously discussed velocity changes. Increase of the pressure at the P2 and P3 outlets may have a positive effect on the capability of the stream to penetrate the area of the primary combustion chamber of the boiler. However, due to the reduced diameter of the air inlet and the main body of the manifold, in case of a comparison performed using the same inlet boundary conditions (i.e. the same inlet velocity or the mass flow rate) an increased total inlet pressure may be observed. Hence, even in the case of the higher absolute values, the pressure drop may be comparable in both cases or even higher in the latter.
Figure 12 presents the distribution of the turbulence kinetic energy, indirectly confirming the thesis presented above.
Fig. 11. Comparison of the total outlet pressures for the reference design and the prototype
The pressure drop in the manifold is the consequence of energy consumption due to the turbulences. A region of relatively high turbulences in the prototype occurs on the left and the right sides of the narrowed main body, close to the air inlet. However, general distribution of the parameter is advantageous in this case, due to the elimination of sharp edges of inlets in the primary air ducts. This part of the analysis has to be considered together with the sensitivity chart (Fig. 6) exhibiting the key impact of the D2 input parameter on the achievable improvement of the flow characteristics.
Fig. 12. Contour of the turbulence kinetic energy distribution in the reference design (a) and in the prototype (b) - the symmetry plane
Based on this observation, it should be concluded that the reduction of turbulences in the initial sections of the air ducts in the air manifold leads to a more homogenous velocity profile at the outlets of these ducts. Moreover, length and width of the conical connectors has a significant influence on the efficiency of smoothing the stream directed to the ducts. It may be concluded that the application of the selected optimization algorithm gave the opportunity to improve of the previous version of the air manifold even further.
Fig. 13. Detailed contour of the turbulence kinetic energy distribution for the reference design (a) and the prototype (b) - the symmetry plane
4 Summary and general conclusions
The design of the external part of the air distribution system applied in biomass-fired batch boilers may be considered equally important to the location, number and shape of the air inlets in the combustion chamber. Adequate shape of the air manifold provides more homogenous conditions in the combustion area and may reduce the required power of the air fan. Computational fluid dynamics is powerful tool that is widely used in studies of the air distribution systems. To achieve the best possible results, however, the classic (parametric) variant analysis needs to be supported by an optimization method. The preliminary investigation devoted to defining the key details of the geometry provided a set of data required to determine the efficient objective function or functions. Based on the successful results of the optimization performed within the study described in the paper, in case of the air manifolds for boilers, it is recommended to use the response surface-based optimization for the improvement of the air flow characteristics. The results of the optimization are strongly linked with the method of the DOE performance and the algorithm applied to create the response surface. Due to the above, it is advised to analyse the dedicated quality indicators before commencing the optimization process.
This work has been carried out within the framework of the statutory studies of the Faculty of Energy and Fuels, AGH University of Science and Technology, Krakow, Poland and under the contract 15.11.210.433.
References
1. T. B. Johansson, H. Kelly, A. K. N. Reddy, R. H. Williams, Renewable Energy Sources for Fuels and Electricity (Island Press, Washington, 1994)
2. B. Sørensen De Luca, Renewable Energy. Its physics, engineering, environmental impacts, economics & planning (Academic Press, Boston, 2000)
3. K. Sornek, M. Filipowicz, Chem. Proc. Eng., 37, 4 (2016)
4. S. Podlasek, K. Lalik, M. Filipowicz, R. Kupski, A. Raś, EPJ WoC, 114 (2016)
5. K. Sornek, M. Filipowicz, M. Szubel, E. Bożek, K. Izdebski, MATEC WoC, 18 (2014)
6. M. Szubel, EPJ WoC, 114 (2016)
7. M. Szubel, M. Filipowicz, W. Goryl, G. Basista, E3S WoC, 10 (2016)
8. M. Szubel, W. Adamczyk, G. Basista, M. Filipowicz, EPJ WoC, 143 (2017)
9. W. Xuebin, H. Zhongfa, D. Shuanghui, X. Yingying, T. Houzhang, En. Proc. 61 (2014) 10. D. B. N. Thanh, L. Young-Il, E. Won-Hyeon, K.
Seong-Joon, Y. Kyung-Seun, Comp. Chem. Eng., 34 (2010)
11. T. Jiyuan, Y. Guan-Heng, L. Chaoqun, Computational Fluid Dynamics. A Practical Approach (Butterworth – Heinemann, Amsterdam, 2013)
12. F. Tabet, V. Fichet., P. Plion, J. En. Inst., 89 (2016) 13. H. Khoadae, F. Guzzomi, D. Patiño, B. Rashidian,
G. H. Yeohb, Fuel Proc. Tech., 157 (2017)
14. H. Khoadae, F. Guzzomi, G. H. Yeohb, A. Regueiro, D. Patiño, Energy, 118 (2017)
15. N. Zobel, A. Anca-Couce, J. An. App. Pyr., 116 (2015)
16. A. Aqsha, M. M. Tijani, Behdad Moghtaderi, Nader Mahinpey, J. An. App. Pyr., 125 (2017)
17. X. Li, J. Yong, W. Lei, En. Conv. Man., 146 (2017) 18. K. Nuutinen, J. Jokiniemi, O. Sippula, H. Lamberg,
J. Sutinen, P. Horttanainen, J. Tissari, Biom. Bioen., 67 (2014)
19. M. Szubel, T. Siwek, Tech. Trans., 111, 19 (2014) 20. M. Szubel, M. Filipowicz, B. Matras, S. Podlasek,
Energy, 162 (2018)
21. E. F. Kristensen, J. K. Kristensen, Biom. and Bioen., 26, 561-569 (2004)
22. E. A. Moallemi, S. Elsawah, M. J. Ryan, Sim. Mod. Pract.Th., 89 (2018)
23. G. Blondet, J. Le Duigou, N. Boudaoud, B. Eynard, Comp. Ind., 94 (2018)
24. J. Liu, L. Huang, M. Buyukada, F. Evrendilek, App. Therm. Eng., 125 (2017)