Image analysis of particle size: effect of light source type
Roman Formánek1,*, Bohuš Kysela2 and Radek Šulc1
1Czech Technical University in Prague, Faculty of Mechanical Engineering, Department of Process Engineering, Technická 4, 166 07
Prague, Czech Republic
2Czech Academy of Science, Institute of Hydrodynamics, Pod Paťankou 30/5, 166 12, Prague, Czech Republic
Abstract. Agitation of two immiscible liquids or solid-liquid suspension is a frequent operation in chemical and metallurgical industries. The sizes of particles, bubbles or droplets can be determined by the Image Analysis Technique. It is known that the quality of captured images depends significantly on the original image background that is mainly affected by the type of the light source. The aim of this contribution is to investigate the effect of light source type on image quality. The four types of light sources were tested: 1) 1000 W halogen lamp, 2) 72 W LED bar panel, 3) 60 W LED chip, and 4) 90 W LED chip. The illumination intensity and image background quality were investigated for each tested light sources. The effect of the shutter speed on evaluated particle sizes was tested using monodisperse spherical calibration particles having diameter of 1.19 mm. The difference observed between particle sizes evaluated by image analysis for given light source and declared calibration particle diameter was used as a measure of light source quality.
1 Introduction
The in-situ measurement and evaluation of drop sizes via Image Analysis (IA) has been widely used by many researchers 1, 2. The development of new visualization techniques and PIV methods enables to measure directly in a control volume. However, these methods are limited by following parameters such as size of the scanned area, maximal resolution and optical limitations (transparency, refractive index, concentration of dispersed phase).
According to Kysela and Formánek 3 the following parameters are important for image capturing and analysis: a) shutter speed, b) frame rate and c) focus depth. The shutter speed must be sufficiently short to prevent the analysed particles are blurred. The frame rate must be sufficiently high to avoid multiple capturing of individual drops. The focus depth in the scanned area must be sufficient to identify uniquely particles.
Kysela and Formánek 3 estimated shutter speed and minimum frame rate for drops measurement via image analysis technique on the basis of velocity flow analysis in the investigated area. The maximum shutter speed of 16 µs was determined for liquid-liquid dispersion agitated by a Rushton turbine in a baffled vessel of diameter 300 mm.
In our previous work 4 we found that the quality of captured images depends significantly on the raw image background that is mainly affected by the type of the light source.
The aim of this contribution is to investigate the effect of light source type on image quality. The four types of light sources were tested: 1) 1000 W halogen lamp, 2) 72 W LED panel, 3) 60 W LED chip, and
4) 90 W LED chip. The research was focused on quantification of illumination intensity, image background quality and effect of the shutter speed on evaluated particle sizes for tested light sources.
The experiments were carried out in a baffled vessel agitated by a Rushton turbine. The distilled water and aqueous suspension of monodisperse calibration particles were used as a model system. The images were captured by high-speed camera. The captured images were treated by the Image Analysis.
2 Experimental
The experiments were conducted in a fully baffled cylindrical vessel of inner diameter T = 300 mm with flat bottom and 4 baffles per 90°, filled in height H = T. The impeller of diameter D = 100 mm was placed at an off-bottom clearance of C/D = 0.85. The baffle width b/T was 0.1. The vessel was agitated by a Rushton turbine. The impeller motor and speed control unit IKA EUROSTAR POWER control-visc was used in our experiments. The impeller speed was set to 200 rpm for all experiments.
The agitated vessel was placed in the rectangular optical box filled with distilled water. Both vessel and box are made of glass. The optical box reduces an image distortion due to the elimination of the refractive index of the cylindrical vessel wall.
centre of the objective of high speed camera. Both the camera and the light source were placed perpendicularly on the optical box walls (see Fig 1).
The image recording was realized by a high-speed camera SpeedSence MK III with frame rate lowered to 30 fps and with full resolution 1280 x 1024 pixels. The camera was equipped with objective Sigma 105 mm F2.8 EX DG MACRO. The images were captured at the region under the impeller (see Fig. 1). The investigated area was approximately 15.4 x 12.3 mm. The image resolution was 0,01201 mm/pixel in this configuration. The area was placed e = 40 mm from impeller axis, off-bottom distance was c = 30 mm, and approximately
a = 50 mm from vessel wall. This place was chosen according to the circulation loop shape generated by the radial impeller.
Fig. 1. Scheme of image acquisition system.
2.1 Light sources tested
The four types of light sources were tested: 1) 1000 W halogen lamp, 2) 72 W LED panel, 3) 60 W LED chip, and 4) 90 W LED chip.
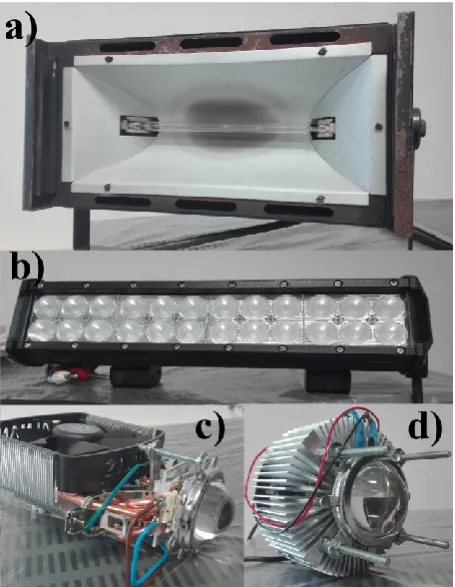
The 1000 W halogen lamp (light source A) has been often used as a light source (Fig. 2a). The main disadvantage of this light source is radiated heat that warms an agitated liquid. For illustration, during our tests the agitated water was warmed up to 7 °C more. The temperature change during experiments is a problem
because the physical properties of liquids such as the interfacial tension, density, and viscosity depend on temperature and thus the experimental conditions are not maintained constant.
For this reason, the commercial 72 W LED bar panel (light source B) was tested (Fig. 2b). This panel is composed of 24 LED chips. The advantage of this light source is low radiation heat. The disadvantage is multi-point character of the light.
Fig. 2. Light sources: a) 1000 W Halogen lamp; b) 72 W LED bar panel; c) 60 W LED chip; d) 90 W LED chip.
Therefore we designed new light sources fulfilling following requirements: 1) high illumination intensity, 2) one-point character of the light source, 3) white or cold white light temperature, and 4) low heat radiation.
To fullfil these requirements we designed a new LED light sources consisting of only one LED chip having a high power input. The light beam enlargement to illuminate the investigated area was ensured opticaly using optical lens and parabolic mirror. The two LED light sources of different power input were built. To maintain LED operational temperature active coolers had to be installed.
The 60 W LED chip (light source C) consists of COB GT-FC60X3-0E chip, the optical lens (accessories of this chip), and cooler Zalman CNPS5X (Fig. 2c).
The 90 W LED chip (light source D) was consists of COB GT-FC90X3-0E chip, the optical lens (accessories of this chip), and cooler Intel LGA775 (Fig. 2d).
Fig. 3. The optical parts of the light sources C and D.
Both 60 W and 90 W LED chips have the same dimensions and same distance between chip and its lens (25 mm).
The technical parameters of tested light sources are presented in Table 1. Compared to halogen lamp, the light flux of LED sources is aprox. 1/3 of halogen lamp, however the light temperature of LED sources is 2-3 times higher. The Both 60 W and 90 W LED chips have the highest light temperature of 8 500 K.
Table 1. Parameters of light sources tested.
Sou
rc
e
typ
e
P
ow
er
in
pu
t
[W]
L
igh
t f
lu
x
[l
m
]
R
ad
ia
ti
on
an
gl
e
[°
]
L
igh
t
te
m
pe
tat
ur
e
[K
]
A 1000 21 000 80 2 900
B (24 x3 W) 72 5 040 60 6 500
C 60 4 500 20 8 500
D 90 6 000 20 8 500
2.2 Experimental procedure
The following tests were carried out to determine: 1) the effect of light source position on a background colour
2) the effect of shutter speed on a background colour 3) the effect of shutter speed on the accuracy of evaluated particle size.
The images were captured in 8-bit grayscale colour depth where the 0 represents totally black colour and 255 represents totally white colour.
3 Results
3.1 Effect of the light source position on a background colour
When the image analysis is used for investigation of liquid-liquid dispersion the cleaning of the vessel is required before and after every measurement run. The cleaning period requires to disassemble the image acquisition system, and after the cleaning to install the acquisition system to the original position again.
The aim of this test was to determine the effect of repeatability of light source installation on a background
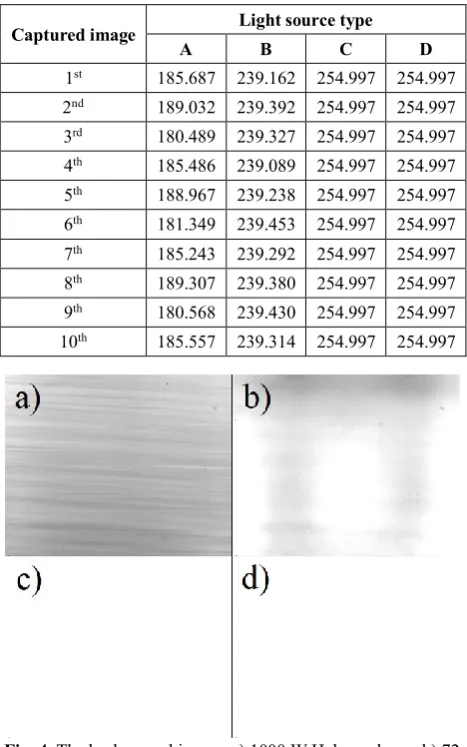
colour. All that tested light sources were 10 times repeatedly installed 10 directly against the centre of the objective of high-speed camera. The light source position was set manually based on visual checking of live streaming video taken by the high-speed camera on the monitor. For every position and for every light source 10 images of the background were taken for 10 µs shutter speed. For each captured image the mean value of pixel colour through image was evaluated. After that, the mean colour value was calculated for each image set containing 10 images. For illustration, the evaluated mean colour values for each captured image at the 5th installation position are presented in Table 2. The evaluated colour values were practically the same regardless of the image sequence.
Table 2. Mean pixels value of taken images in installing 5th position (0 = total black colour, 255 = total white colour)
Captured image Light source type
A B C D
1st 185.687 239.162 254.997 254.997
2nd 189.032 239.392 254.997 254.997
3rd 180.489 239.327 254.997 254.997
4th 185.486 239.089 254.997 254.997
5th 188.967 239.238 254.997 254.997
6th 181.349 239.453 254.997 254.997
7th 185.243 239.292 254.997 254.997
8th 189.307 239.380 254.997 254.997
9th 180.568 239.430 254.997 254.997
10th 185.557 239.314 254.997 254.997
Fig. 4. The background image: a) 1000 W Halogen lamp; b) 72 W LED bar panel; c) 60 W LED chip; d) 90 W LED chip.
Mean background colour values obtained for each light source position are presented graphically in Fig. 5 for tested light sources.
Fig. 5. Mean colour value of background – effect of light source position, shutter speed = 10 s (0 = total black colour, 255 = total white colour).
The light sources C and D were found to be insensitive to the installed source position. The white background colour was observed at all repeated positions. Unlike this, the lowest reproducibility was found for light source B (LED bar panel). In this case the background colour varied significantly in the range from 192 to 242. The multi-point character of light source is responsible for given colour volatility (Fig. 4b). The halogen lamp (light source A) was practically insensitive to source position, however, the background colour was grey (Fig. 4a).
3.2 Effect of the shutter speed on a background colour
The correct setting of the exposure for taking images of fast-moving particles is important. The proper setting of the shutter speed plays an important role.
The shutter speed is a period in which the sensor cells are filled by light flowing through the objective. The sharpness of particle edges depends on shutter speed and shutter speed depends on light intensity. Therefore, to capture fast-moving particles high light intensity and the short shutter speed are needed. The setting of the clone is the next important parameter of exposition. All images were taken without clone during tests because the clone decreases the light intensity.
In this test 10 images of the background for every light source were captured at various shutter speeds. The shutter speed was set from 1 to 10 µs with an increment of 1 µs. From every captured image the average value of pixel colour through the image was evaluated for every shutter speeds. The mean background colour values obtained for each light source at various shutter speeds are presented graphically in Fig. 6.
Fig. 6. Mean colour value of background – effect of shutter speed (0 = total black colour, 255 = total white colour).
Starting the shutter speed of 3 s the white background colour was observed for light sources C and D. For halogen lamp the stable background colour was reached for shutter speed longer then 9 s. The stable background colour was not found in examined range of shutter speed for LED panel (source B).
3.3 Particle size analysis
In this test the influence of light source on the accuracy of particle evaluation in dependence on the shutter speed was investigated. The special polymeric spheres ”Nylon 6/6 Balls” of precise diameter of 3/64’’ = 1.19 mm were used for testing. The photo of these calibration spheres is presented in Figure 7. The 15 000 of these particles were added to the distilled water and this suspension was used as an agitated liquid. The 1000 images were captured for shutter speed of 10, 7, 5, 3 and 2 µs and for each tested light source.
Fig. 7. The precise calibration spheres ”Nylon 6/6 Balls”.
compares shade of neighbouring pixels. The difference in pixel shade between neighbouring pixels is compared with the set gradient value. If the difference is greater then set gradient value it assumed that the particle boundary was identified. The standard approach utilizing a threshold value was found to be not quite accurate for particle size determination. The boundary of particles was not resolved properly and particles outside the focused plane were also evaluated.
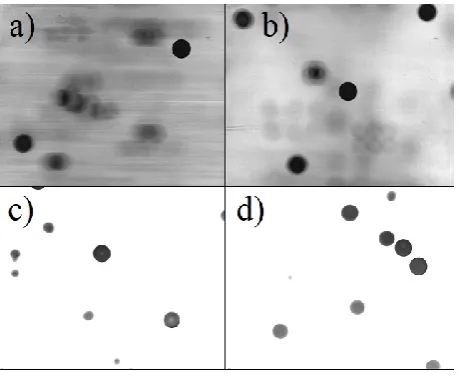
For illustration, the captured background images are presented in Fig. 7 and 8 for shutter speed 3 and 10 s respectively.
Fig. 7. The captured image for shutter speed 3 s: a) 1000 W Halogen lamp; b) 72 W LED bar panel; c) 60 W LED chip; d) 90 W LED chip.
Fig. 8. The capture image for shutter speed 10 s: a) 1000 W Halogen lamp; b) 72 W LED bar panel; c) 60 W LED chip; d) 90 W LED chip.
From captured images the particles were identified and their equivalent diameter according to projected area was calculated. The Image Analysis setting was the same for all light sources tested to ensure the comparison of results.
The dependence of number of identified particles on shutter speed is graphically presented in Fig. 9.
Fig. 9. Number of identified particles – effect of shutter speed.
For halogen lamp and LED panel the number of identified particles was found to be very low (around 30 to 40 particles) regardless of shutter speed. Increasing shutter speed, the number of identified particles increases for our LED sources C and D. For shutter speed longer then 5 s the number of identified particles is greater then 1000 particles.
The obtained particle size distributions were treated by the Normal (Gauss) distribution as follows:
(1)
where the µ [mm] characterized the mean value of diameter evaluated from identified particles and σ [mm] is a standard deviation from the mean value.
The dependence of mean particle value and standard deviation on the shutter speed is presented graphically in Fig. 10 and 11 respectively.
Fig. 11. Normal distribution – standard deviation – effect of shutter speed.
Low values of standard deviation for halogen lamp (source A) and LED panel (source B) indicate narow particle size distribution (Fig. 11). Simultaneously, constant values of particle size were evaluated for halogen lamp (source A) and LED panel (source B) for shutter speed longer then 5 s. The evaluated size of calibration particles for these light sources obtained by the used image analysis procedure is around 1.3 mm, i.e. the diameters evaluated by the used image analysis procedure were overestimated comparing with the declared diameter of calibration particles.
Unlike this, our LED sources C and D exhibit increasing deviation and decreasing mean value for increasing shutter speed. In our opinion, the qualitative white background is responsible for this volatility. White background enables to determine particles behind the illuminated plane also (it results to high number of identified particles) thus the results are distorted and shifted (it results to changing and ). The lower background image quality of light sources A and B allows paradoxically to eliminate particles behind the illuminated plane. Therefore, the successful application of designed light sources requires to modify the Image Analysis procedure to eliminate particles outside of the illuminated plane.
4 Conclusions
The following results have been obtained in this study: The sizes of particles, bubbles or droplets can be determined by the Image Analysis Technique. It is known that the quality of captured images depends significantly on the original image background that is mainly affected by the type of the light source.
The 1000 W halogen lamp has been often used as a light source. The main disadvantage of this light source is radiated heat that warms an agitated liquid. For these reasons LED light sources (commercial LED bar panel and our designed one-point LED sources) having low radiated heat were tested.
The following tests were carried out to determine: 1) the effect of light source position on a background colour
2) the effect of shutter speed on a background colour 3) the effect of shutter speed on the accuracy of evaluated particle size.
The experiments were carried out in a baffled vessel agitated by a Rushton turbine. Distilled water and aqueous suspension of calibration monodisperse particles were used as a model system. The special plastic spheres ”Nylon 6/6 Balls” of precise diameter of 3/64’’ = 1.19 mm were used for particle identification testing.
It was found that the designed light sources 60 W LED chip and 90 W LED chip ensure practically white image background that is insensitive to installed source position. For shutter speed longer then 5 s the number of identified particles is greater then 1000 particles. However, a decrease in the mean particle value and an increase in its standard deviation were found for increasing shutter speed. The qualitative white background obtained for these light sources is responsible for this volatility. The white background enables to determine particles behind the illuminated plane as well thus the results are distorted and shifted. Therefore, the successful application of designed light sources requires to modify the Image Analysis procedure to eliminate particles outside of the illuminated plane.
The halogen lamp and commercial LED panel generate grey image background resulting into low number of identified particles. On the other side, the lower background image quality of these light sources allows paradoxically eliminate particles behind the illuminated plane, thus the low values of standard deviation and practically constant mean particle size evaluated were reached for shutter speed longer 5 s.
This research has been supported by GA CR project No. 16-20175S and by GA CTU project No. SGS18/129.
References
1. J. Baldyga, J.R. Bourne, A.W. Pacek, A. Amanullah, A.W. Nienow, Chem. Eng. Sci., 56, 3377–3385 (2001)
2. P. O. Hong, J. M. Lee, Industrial and Engineering Chemistry, Process Design and Development, 22, 130–135 (1983)
3. B. Kysela, R. Formánek, Z. Chára, J. Konfršt, D. Jašíková, R. Šulc, Evaluation of flow rate through the measurement volume during droplet size evaluation, Symposium on anemometry: proceedings (2018)
4. E. Bucciarelli, R. Formánek, B. Kysela, I. Fořt, R. Šulc, Dispersion kinetics in mechanically agitated vessel, Experimental Fluid Mechanics (2018) (to be published)
5. B. Kysela, J. Konfršt, Z. Chára, R. Šulc, P. Ditl, In-situ measurement of particle size distribution in an agitated vessel. In: Proceedings of 18th International